Lorton: Fire Incidents, Virginia (VA)
Where are fire incidents reported in Lorton, VA
Something went wrong! Please refresh the page.
|
| |||||||||||||||||||||||||||||||||||||||||||||||||||||||||||||||||||||||||||||||||||||||||||||||||||||||||||||
2005 - 2018 National Fire Incident Reporting System (NFIRS) incidents
- Incident types reported to NFIRS in Lorton, VA
- 7,35862.2%Rescue & EMS
- 1,23310.4%False Alarm
- 1,0058.5%Good Intent Call
- 7716.5%Service Call
- 7366.2%Fire
- 6635.6%Hazardous Condition
- 430.4%Special Incident
- 120.1%Overpressure Rupture
- Fire incident types reported to NFIRS in Lorton, VA
- 26335.7%Outside Fires
- 23832.3%Structure Fires
- 20928.4%Mobile Property/Vehicle Fires
- 263.5%Other
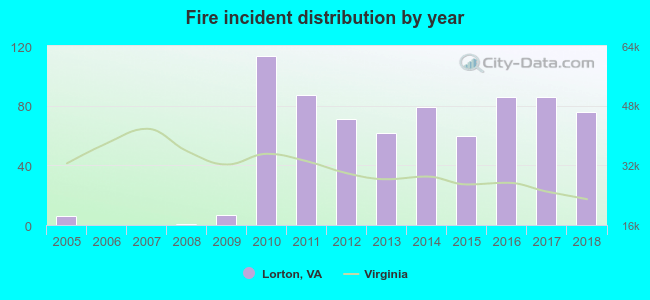 Based on the data from the years 2005 - 2018 the average number of fire incidents per year is 52. The highest number of reported fires - 113 took place in 2010, and the least - 0 in 2006. The data has a growing trend.
The average number of yearly fire incidents per 10k residents in Lorton, VA compared to nearest cities:
(Note: Based on data for the last 3 years, including only cities with population 5,000 and above)
| Lorton: | 44.4 |
| Fort Belvoir: | 8.5 |
| Burke: | 11.0 |
| West Springfield: | 11.6 |
| Springfield: | 41.9 |
| North Springfield: | 22.0 |
| Dale City: | 0.3 |
| Fairfax Station: | 26.3 |
| Rose Hill: | 4.1 |
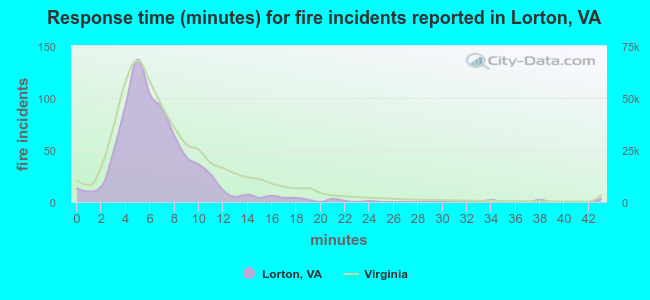 The median response time based on all reported fire incidents is 6 minutes. This is about the same as the Virginia median value.
The median response time in Lorton, VA compared to nearest cities:
(Note: Based on data for all years, including only cities with at least 500 fire incidents)
| Lorton: | 6 minutes |
| Woodbridge: | 5 minutes |
| Springfield: | 6 minutes |
| Indian Head: | 6 minutes |
| Annandale: | 5 minutes |
| Bryans Road: | 6 minutes |
| Fairfax: | 6 minutes |
| Alexandria: | 5 minutes |
| Accokeek: | 9 minutes |
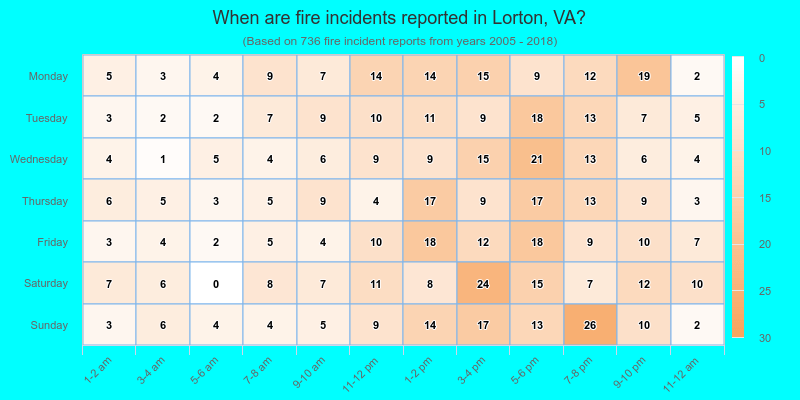
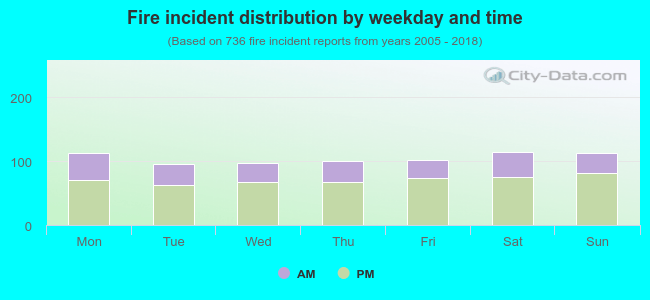 31.8% incidents where reported in the morning and 68.2% in the evening. The most fires (15.6%) took place on Saturday, and the least (13.0%) on Tuesday.
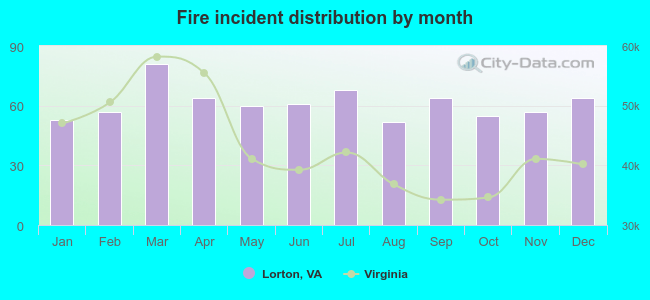 Based on the 736 fire incident reports from years 2005 - 2018 most fires (11.0%) took place during March, and the least (7.1%) in August.
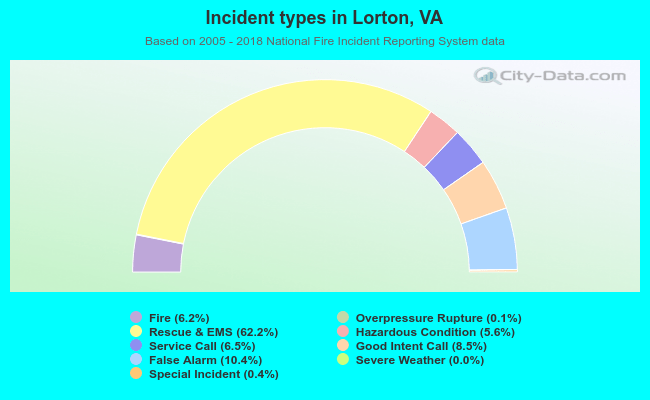 Out of all 11,822 cases reported during the years 2005 - 2018, the most belonged to the categories: Rescue & EMS (62.2%), False Alarm (10.4%), and Good Intent Call (8.5%).
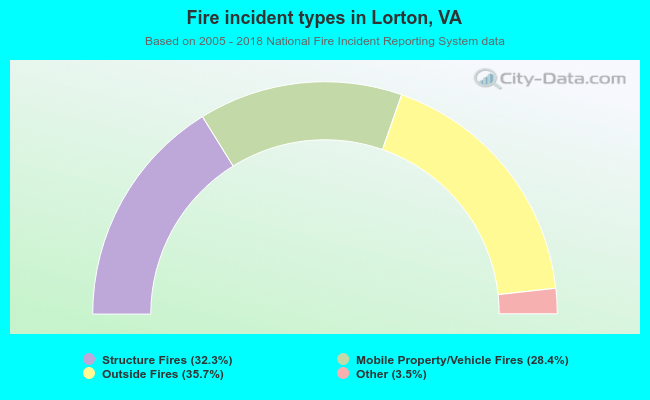 When looking into fire subcategories, the most incidents belonged to: Outside Fires (35.7%), and Structure Fires (32.3%).