Annandale: Fire Incidents, Virginia (VA)
Where are fire incidents reported in Annandale, VA
Something went wrong! Please refresh the page.
|
| |||||||||||||||||||||||||||||||||||||||||||||||||||||||||||||||||||||||||||||||||||||||||||||||||||||||||||||
2005 - 2018 National Fire Incident Reporting System (NFIRS) incidents
- Incident types reported to NFIRS in Annandale, VA
- 16,39073.0%Rescue & EMS
- 1,6037.1%Good Intent Call
- 1,5396.9%Service Call
- 1,1465.1%False Alarm
- 1,0464.7%Hazardous Condition
- 6683.0%Fire
- 430.2%Special Incident
- 270.1%Overpressure Rupture
- Fire incident types reported to NFIRS in Annandale, VA
- 32949.3%Structure Fires
- 21932.8%Outside Fires
- 9514.2%Mobile Property/Vehicle Fires
- 253.7%Other
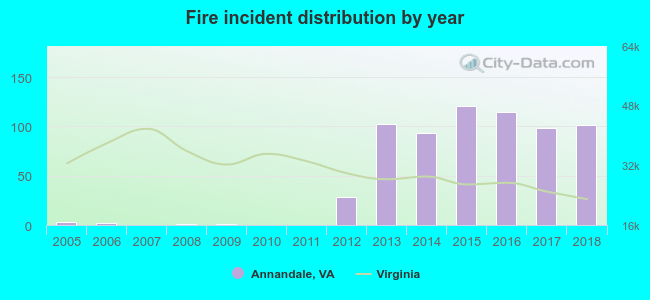 According to the data from the years 2005 - 2018 the average number of fires per year is 48. The highest number of reported fire incidents - 121 took place in 2015, and the least - 0 in 2007. The data has an increasing trend.
The average number of yearly fire incidents per 10k residents in Annandale, VA compared to nearest cities:
(Note: Based on data for the last 3 years, including only cities with population 5,000 and above)
| Annandale: | 25.5 |
| North Springfield: | 22.0 |
| Jefferson: | 1.1 |
| Merrifield: | 1.1 |
| West Springfield: | 11.6 |
| Springfield: | 41.9 |
| Idylwood: | 6.9 |
| Falls Church: | 173.3 |
| Dunn Loring: | 5.7 |
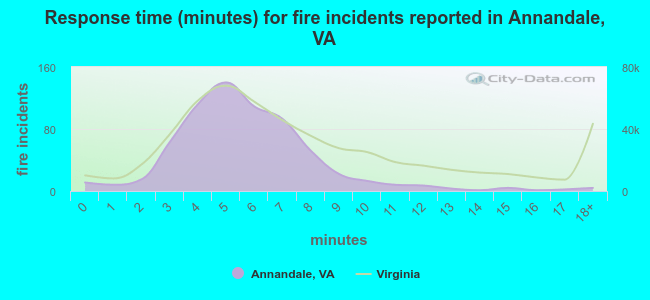 The median response time based on all reported fire incidents is 5 minutes. This is lower compared to the Virginia median value.
The median response time in Annandale, VA compared to nearest cities:
(Note: Based on data for all years, including only cities with at least 500 fire incidents)
| Annandale: | 5 minutes |
| Springfield: | 6 minutes |
| Falls Church: | 5 minutes |
| Fairfax: | 6 minutes |
| Vienna: | 5 minutes |
| Arlington: | 5 minutes |
| McLean: | 6 minutes |
| Alexandria: | 5 minutes |
| Lorton: | 6 minutes |
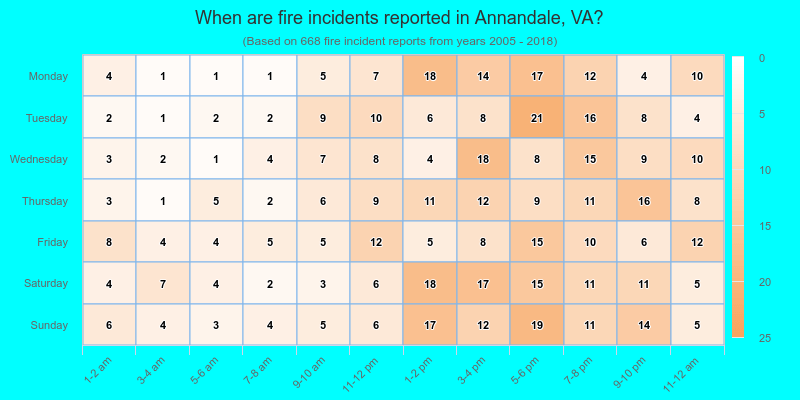
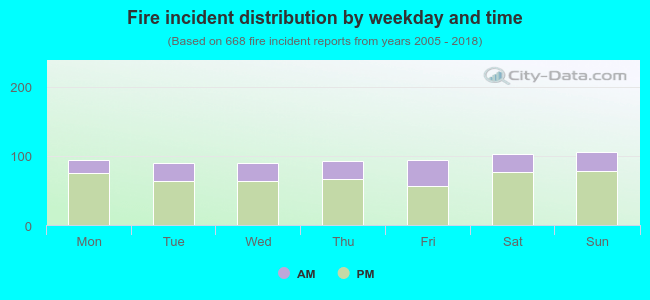 28.1% incidents where reported in the morning and 71.9% in the evening. The most fires (15.9%) took place on Sunday, and the least (13.3%) on Tuesday.
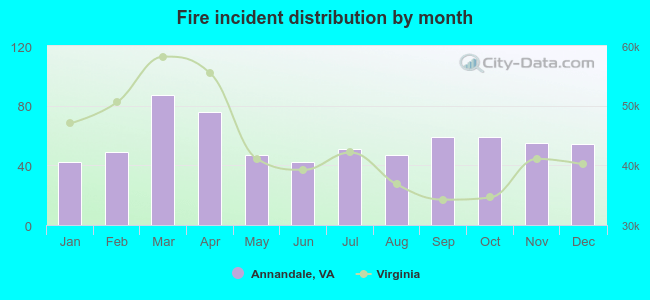 Based on the 668 fires from years 2005 - 2018 most fires (13.0%) took place during March, and the least (6.3%) in January.
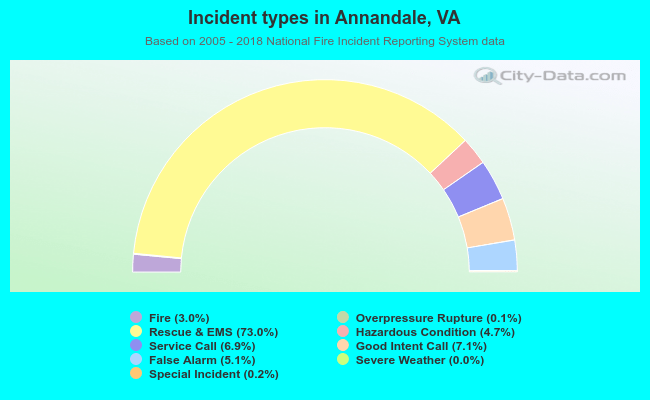 Out of all 22,467 cases reported during the years 2005 - 2018, the most belonged to the categories: Rescue & EMS (73.0%), Good Intent Call (7.1%), and Service Call (6.9%).
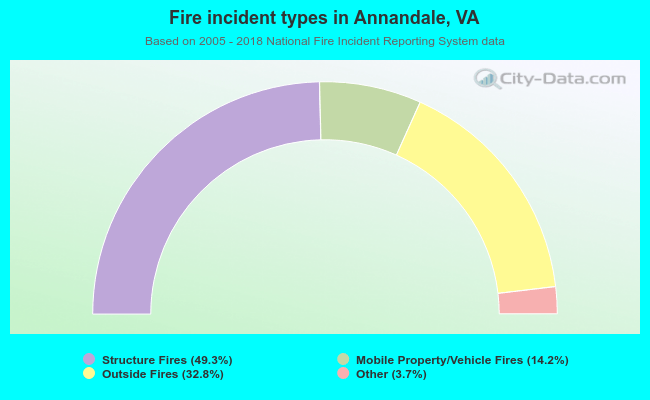 When looking into fire subcategories, the most reports belonged to: Structure Fires (49.3%), and Outside Fires (32.8%).