Lynn: Fire Incidents, Massachusetts (MA)
Where are fire incidents reported in Lynn, MA
Something went wrong! Please refresh the page.
| Fire incidents reported | |
|---|---|
| Sreet name | Count |
| WASHINGTON ST ST | 350 |
| ESSEX ST ST | 200 |
| LYNNWAY | 148 |
| BROAD ST ST | 138 |
| WESTERN AV ST | 134 |
| LYNNWAY ST | 128 |
| WESTERN AVE | 122 |
| WASHINGTON ST | 108 |
| CHESTNUT ST ST | 100 |
| NEPTUNE BLVD ST | 94 |
| NORTH COMMON ST ST | 88 |
| FRANKLIN ST ST | 86 |
| WESTERN AV | 86 |
| PARK ST ST | 84 |
| BOSTON ST ST | 82 |
| LAIGHTON ST ST | 82 |
| SOUTH COMMON ST ST | 80 |
| BOSTON ST | 76 |
| BROADWAY | 76 |
| ESSEX ST | 76 |
| ESSEX ST | 72 |
| GREEN ST ST | 70 |
| LIGHT ST ST | 70 |
| WASHINGTON ST | 68 |
| HANOVER ST ST | 66 |
| LEWIS ST ST | 64 |
| NEWHALL ST ST | 64 |
| UNION ST ST | 58 |
| LEWIS ST | 56 |
| FRANKLIN ST | 52 |
| Other | 2,289 |
2002 - 2018 National Fire Incident Reporting System (NFIRS) incidents
- Incident types reported to NFIRS in Lynn, MA
- 31,38955.1%Rescue & EMS
- 7,76013.6%False Alarm
- 5,2679.2%Fire
- 5,1519.0%Service Call
- 3,9657.0%Good Intent Call
- 3,2015.6%Hazardous Condition
- 1630.3%Severe Weather
- Fire incident types reported to NFIRS in Lynn, MA
- 3,84873.1%Structure Fires
- 88816.9%Outside Fires
- 4809.1%Mobile Property/Vehicle Fires
- 511.0%Other
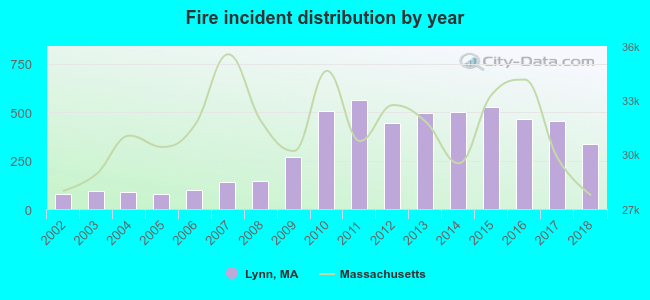 According to the data from the years 2002 - 2018 the average number of fires per year is 310. The highest number of reported fire incidents - 561 took place in 2011, and the least - 76 in 2005. The data has a growing trend.
The average number of yearly fire incidents per 10k residents in Lynn, MA compared to nearest cities:
(Note: Based on data for the last 3 years, including only cities with population 5,000 and above)
| Lynn: | 45.3 |
| Swampscott: | 28.8 |
| Saugus: | 48.2 |
| Salem: | 37.4 |
| Peabody: | 23.0 |
| Revere: | 68.1 |
| Marblehead: | 19.2 |
| Lynnfield: | 81.9 |
| Melrose: | 6.6 |
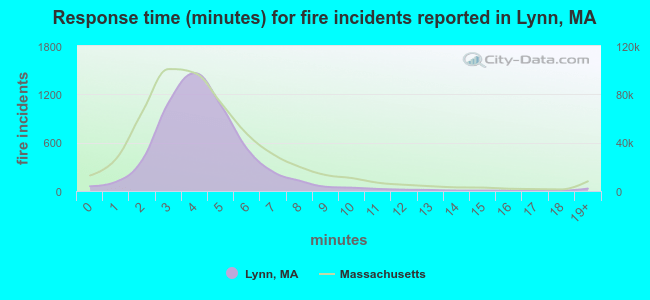 The median response time based on all reported fire incidents is 4 minutes. This is close to the state median value.
The median response time in Lynn, MA compared to nearest cities:
(Note: Based on data for all years, including only cities with at least 500 fire incidents)
| Lynn: | 4 minutes |
| Swampscott: | 4 minutes |
| Saugus: | 5 minutes |
| Salem: | 3 minutes |
| Peabody: | 5 minutes |
| Revere: | 3 minutes |
| Marblehead: | 4 minutes |
| Lynnfield: | 5 minutes |
| Wakefield: | 2 minutes |
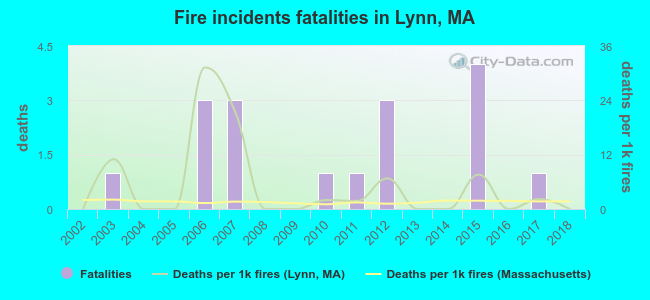 Based on the reports from the years 2002 - 2018 the average number of fire-related yearly deaths is 1. The highest number of deaths - 4 took place in 2015, and the lowest - 0 in 2002. The data has a constant trend.
The average number of fatalities per 1,000 fires is 5. This indicator was the highest - 31 in 2006, and the lowest 0 in 2002. The trend for deaths per 1,000 fires is increasing. Compared to the Massachusetts value the number of fatalities per 1,000 fires is much higher.
Based on the reports from the years 2002 - 2018 the average number of fire-related yearly deaths is 1. The highest number of deaths - 4 took place in 2015, and the lowest - 0 in 2002. The data has a constant trend.
The average number of fatalities per 1,000 fires is 5. This indicator was the highest - 31 in 2006, and the lowest 0 in 2002. The trend for deaths per 1,000 fires is increasing. Compared to the Massachusetts value the number of fatalities per 1,000 fires is much higher.
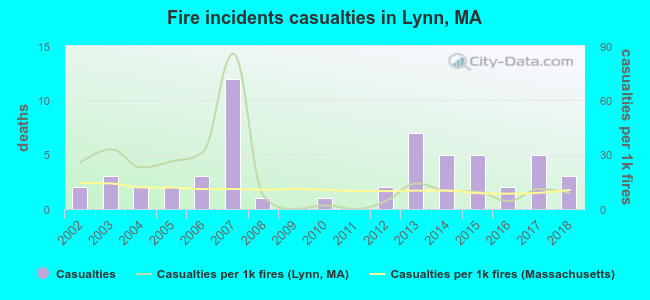 According to the data from the years 2002 - 2018 the average number of fire-related casualties per year is 3. The highest number of injuries - 12 took place in 2007, and the lowest - 0 in 2009. The data has a growing trend.
The average number of casualties per 1,000 fire incidents is 17. This indicator was the highest - 86 in 2007, and the lowest 0 in 2009. The trend for casualties per 1,000 incidents is decreasing. Compared to the state value the number of casualties per 1,000 fires is about the same.
According to the data from the years 2002 - 2018 the average number of fire-related casualties per year is 3. The highest number of injuries - 12 took place in 2007, and the lowest - 0 in 2009. The data has a growing trend.
The average number of casualties per 1,000 fire incidents is 17. This indicator was the highest - 86 in 2007, and the lowest 0 in 2009. The trend for casualties per 1,000 incidents is decreasing. Compared to the state value the number of casualties per 1,000 fires is about the same.Casualties per 1,000 incidents in Lynn, MA compared to nearest cities:
(Note: Based on data for all years, including only cities with at least 500 fire incidents)
| Lynn: | 10.4 |
| Swampscott: | 6.5 |
| Saugus: | 11.2 |
| Salem: | 6.8 |
| Peabody: | 6.9 |
| Revere: | 4.2 |
| Marblehead: | 6.5 |
| Lynnfield: | 2.5 |
| Wakefield: | 5.8 |
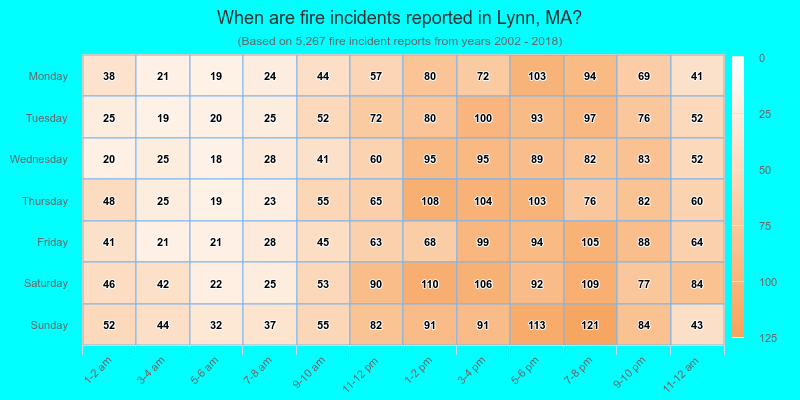
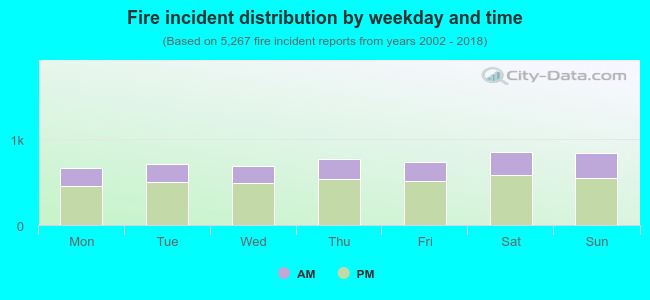 31.2% incidents where reported in the morning and 68.8% in the evening. The most fires (16.3%) took place on Saturday, and the least (12.6%) on Monday.
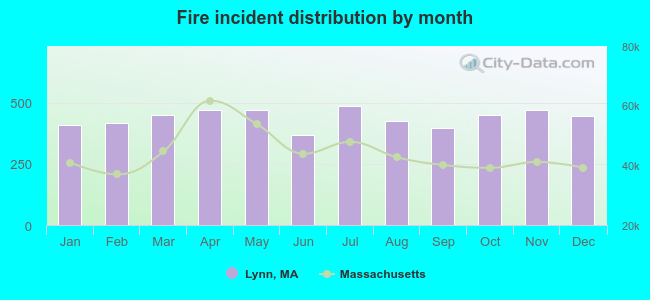 According to the 5,267 fires from years 2002 - 2018 most fires (9.3%) took place during July, and the least (7.0%) in June.
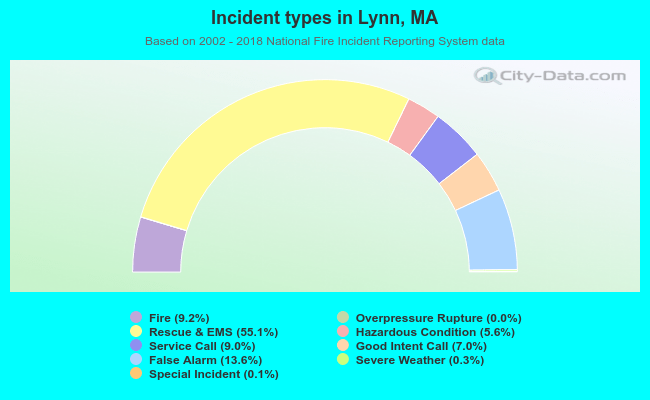 Out of all 56,970 cases reported during the years 2002 - 2018, the most belonged to the categories: Rescue & EMS (55.1%), False Alarm (13.6%), and Fire (9.2%).
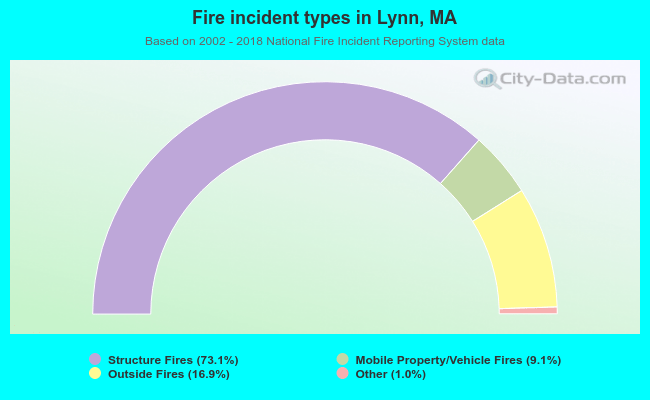 When looking into fire subcategories, the most incidents belonged to: Structure Fires (73.1%), and Outside Fires (16.9%).