Marblehead: Fire Incidents, Massachusetts (MA)
Where are fire incidents reported in Marblehead, MA
Something went wrong! Please refresh the page.
| Fire incidents reported | |
|---|---|
| Sreet name | Count |
| PLEASANT ST | 78 |
| WASHINGTON ST | 58 |
| WOODFIN TER | 56 |
| ATLANTIC AVE | 52 |
| HUMPHREY ST | 50 |
| OCEAN AVE | 44 |
| FRONT ST | 28 |
| GREEN ST | 24 |
| WEST SHORE DR | 24 |
| BEACON ST | 22 |
| TEDESCO ST | 22 |
| ELM ST | 20 |
| BROUGHTON RD | 16 |
| FOSTER ST | 16 |
| JERSEY ST | 16 |
| FARRELL CT | 14 |
| CLIFTON AVE | 12 |
| GREGORY ST | 12 |
| MAPLE ST | 12 |
| ROBERT RD | 12 |
| SMITH ST | 12 |
| STONYBROOK RD | 12 |
| BESSOM ST | 10 |
| COUNTRYSIDE LN | 10 |
| DEVEREUX ST | 10 |
| FORT SEWALL LN | 10 |
| HARBOR AVE | 10 |
| HIGHLAND TER | 10 |
| INTREPID CIR | 10 |
| LAFAYETTE ST | 10 |
| Other | 83 |
2002 - 2018 National Fire Incident Reporting System (NFIRS) incidents
- Incident types reported to NFIRS in Marblehead, MA
- 4,86336.7%Rescue & EMS
- 2,58319.5%Hazardous Condition
- 1,78013.4%Service Call
- 1,77113.3%False Alarm
- 1,42410.7%Good Intent Call
- 7755.8%Fire
- 330.2%Severe Weather
- 330.2%Special Incident
- Fire incident types reported to NFIRS in Marblehead, MA
- 44757.7%Structure Fires
- 17021.9%Outside Fires
- 9612.4%Other
- 628.0%Mobile Property/Vehicle Fires
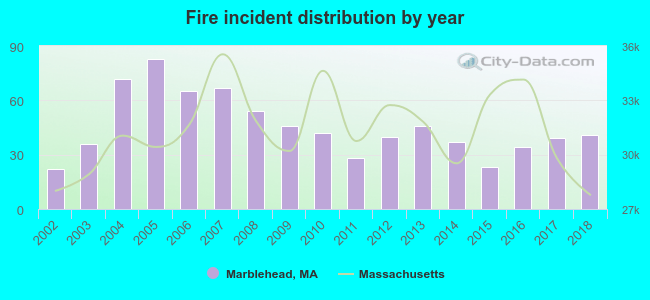 Based on the data from the years 2002 - 2018 the average number of fire incidents per year is 46. The highest number of reported fires - 83 took place in 2005, and the least - 22 in 2002. The data has a rising trend.
The average number of yearly fire incidents per 10k residents in Marblehead, MA compared to nearest cities:
(Note: Based on data for the last 3 years, including only cities with population 5,000 and above)
| Marblehead: | 19.2 |
| Salem: | 37.4 |
| Swampscott: | 28.8 |
| Beverly: | 25.5 |
| Lynn: | 45.3 |
| Peabody: | 23.0 |
| Danvers: | 40.5 |
| Saugus: | 48.2 |
| Hamilton: | 21.5 |
 The median response time based on all reported fire incidents is 4 minutes. This is close to the state median value.
The median response time in Marblehead, MA compared to nearest cities:
(Note: Based on data for all years, including only cities with at least 500 fire incidents)
| Marblehead: | 4 minutes |
| Salem: | 3 minutes |
| Swampscott: | 4 minutes |
| Beverly: | 4 minutes |
| Lynn: | 4 minutes |
| Peabody: | 5 minutes |
| Danvers: | 5 minutes |
| Saugus: | 5 minutes |
| Hamilton: | 5 minutes |
 Based on the data from the years 2002 - 2018 the average number of fire-related yearly casualties is 0. The highest number of reported casualties - 2 took place in 2007, and the lowest - 0 in 2002. The data has a constant trend.
The average number of casualties per 1,000 fires is 6. This indicator was the highest - 36 in 2011, and the lowest 0 in 2002. The trend for casualties per 1,000 fires is constant. Compared to the state value the number of casualties per 1,000 fire incidents is lower.
Based on the data from the years 2002 - 2018 the average number of fire-related yearly casualties is 0. The highest number of reported casualties - 2 took place in 2007, and the lowest - 0 in 2002. The data has a constant trend.
The average number of casualties per 1,000 fires is 6. This indicator was the highest - 36 in 2011, and the lowest 0 in 2002. The trend for casualties per 1,000 fires is constant. Compared to the state value the number of casualties per 1,000 fire incidents is lower.
 33.8% incidents where reported in the morning and 66.2% in the evening. The most fires (16.0%) took place on Friday, and the least (13.4%) on Wednesday.
 According to the 775 reports from years 2002 - 2018 most fires (10.5%) took place during November, and the least (6.3%) in August.
 Out of all 13,266 cases reported during the years 2002 - 2018, the most belonged to the categories: Rescue & EMS (36.7%), Hazardous Condition (19.5%), and Service Call (13.4%).
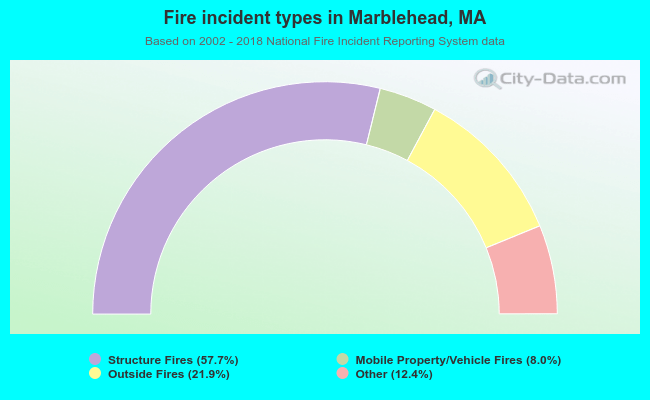 When looking into fire subcategories, the most reports belonged to: Structure Fires (57.7%), and Outside Fires (21.9%).