Medford: Fire Incidents, Massachusetts (MA)
Where are fire incidents reported in Medford, MA
Something went wrong! Please refresh the page.
| Fire incidents reported | |
|---|---|
| Sreet name | Count |
| MYSTIC VLY PRKWY | 620 |
| FELLSWAY | 372 |
| WINTHROP ST | 328 |
| RIVERSIDE AV | 314 |
| HIGH ST | 260 |
| MAIN ST | 232 |
| BOSTON AV | 206 |
| STATION LANDING | 188 |
| FELLSWAY WEST | 176 |
| SALEM ST | 176 |
| MYSTIC AV | 152 |
| GOVERNORS AV | 132 |
| WALKLING CT | 130 |
| FELLSWAY ST | 124 |
| I93N | 124 |
| FULTON ST | 118 |
| REVERE BEACH PRKWY | 110 |
| MIDDLESEX AV | 108 |
| PACKARD AV | 98 |
| FOSTER CT | 94 |
| I93S | 88 |
| WASHINGTON ST | 84 |
| CAPEN ST | 80 |
| MEDFORD ST | 74 |
| WATER ST | 72 |
| ELM ST | 70 |
| FOREST ST | 68 |
| HARVARD AV | 66 |
| CENTRAL AV | 64 |
| ALLSTON ST | 60 |
2002 - 2018 National Fire Incident Reporting System (NFIRS) incidents
- Incident types reported to NFIRS in Medford, MA
- 33,93751.0%Rescue & EMS
- 12,65519.0%Hazardous Condition
- 7,51911.3%False Alarm
- 5,3368.0%Service Call
- 4,7367.1%Fire
- 2,1363.2%Good Intent Call
- 1710.3%Special Incident
- Fire incident types reported to NFIRS in Medford, MA
- 2,79058.9%Structure Fires
- 1,35928.7%Outside Fires
- 4359.2%Mobile Property/Vehicle Fires
- 1523.2%Other
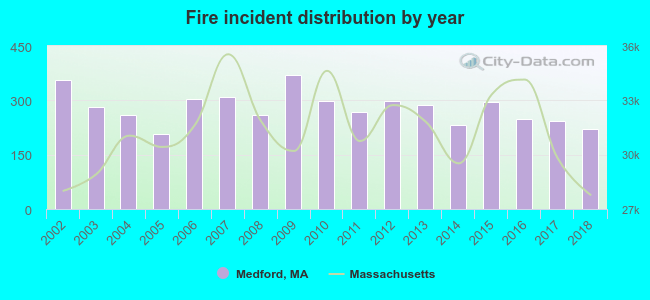 According to the data from the years 2002 - 2018 the average number of fires per year is 279. The highest number of reported fire incidents - 371 took place in 2009, and the least - 206 in 2005. The data has a dropping trend.
The average number of yearly fire incidents per 10k residents in Medford, MA compared to nearest cities:
(Note: Based on data for the last 3 years, including only cities with population 5,000 and above)
| Medford: | 41.3 |
| Somerville: | 56.2 |
| Malden: | 22.3 |
| Winchester: | 12.9 |
| Everett: | 27.9 |
| Arlington: | 23.8 |
| Cambridge: | 99.2 |
| Melrose: | 6.6 |
| Belmont: | 42.3 |
 The median response time based on all reported fire incidents is 3 minutes. This is lower than the state median value.
The median response time in Medford, MA compared to nearest cities:
(Note: Based on data for all years, including only cities with at least 500 fire incidents)
| Medford: | 3 minutes |
| Somerville: | 3 minutes |
| Malden: | 3 minutes |
| Winchester: | 4 minutes |
| Everett: | 2 minutes |
| Arlington: | 3 minutes |
| Cambridge: | 5 minutes |
| Belmont: | 4 minutes |
| Chelsea: | 3 minutes |
 Based on the data from the years 2002 - 2018 the average number of fire-related fatalities per year is 0. The highest number of reported deaths - 2 took place in 2003, and the lowest - 0 in 2002. The data has a constant trend.
The average number of deaths per 1,000 fires is 1. This indicator was the highest - 7 in 2003, and the lowest 0 in 2002. The trend for fatalities per 1,000 fires is declining. Compared to the state value the number of deaths per 1,000 fire incidents is lower.
Based on the data from the years 2002 - 2018 the average number of fire-related fatalities per year is 0. The highest number of reported deaths - 2 took place in 2003, and the lowest - 0 in 2002. The data has a constant trend.
The average number of deaths per 1,000 fires is 1. This indicator was the highest - 7 in 2003, and the lowest 0 in 2002. The trend for fatalities per 1,000 fires is declining. Compared to the state value the number of deaths per 1,000 fire incidents is lower.
 According to the reports from the years 2002 - 2018 the average number of fire-related casualties per year is 2. The highest number of reported injuries - 7 took place in 2003, and the lowest - 0 in 2004. The data has a dropping trend.
The average number of injuries per 1,000 fires is 8. This indicator was the highest - 25 in 2003, and the lowest 0 in 2004. The trend for casualties per 1,000 fire incidents is declining. Compared to the state value the number of casualties per 1,000 fire incidents is lower.
According to the reports from the years 2002 - 2018 the average number of fire-related casualties per year is 2. The highest number of reported injuries - 7 took place in 2003, and the lowest - 0 in 2004. The data has a dropping trend.
The average number of injuries per 1,000 fires is 8. This indicator was the highest - 25 in 2003, and the lowest 0 in 2004. The trend for casualties per 1,000 fire incidents is declining. Compared to the state value the number of casualties per 1,000 fire incidents is lower.Casualties per 1,000 incidents in Medford, MA compared to nearest cities:
(Note: Based on data for all years, including only cities with at least 500 fire incidents)
| Medford: | 8.0 |
| Somerville: | 16.3 |
| Malden: | 7.3 |
| Winchester: | 24.3 |
| Everett: | 18.4 |
| Arlington: | 8.0 |
| Cambridge: | 4.7 |
| Belmont: | 5.9 |
| Chelsea: | 10.4 |
 28.2% incidents where reported in the morning and 71.8% in the evening. The most fires (15.2%) took place on Sunday, and the least (12.5%) on Wednesday.
 According to the 4,736 fire incidents from years 2002 - 2018 most fires (12.4%) took place during April, and the least (6.6%) in November.
 Out of all 66,601 cases reported during the years 2002 - 2018, the most belonged to the categories: Rescue & EMS (51.0%), Hazardous Condition (19.0%), and False Alarm (11.3%).
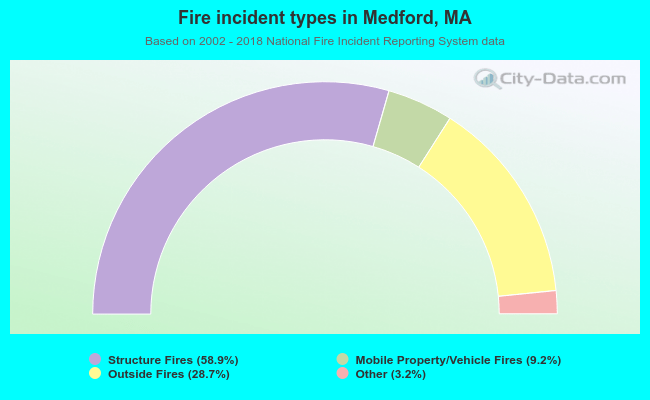 When looking into fire subcategories, the most reports belonged to: Structure Fires (58.9%), and Outside Fires (28.7%).