Cambridge: Fire Incidents, Massachusetts (MA)
Where are fire incidents reported in Cambridge, MA
Something went wrong! Please refresh the page.
| Fire incidents reported | |
|---|---|
| Sreet name | Count |
| MASSACHUSETTS AVE | 1,372 |
| MEMORIAL DR | 1,300 |
| CAMBRIDGE ST | 962 |
| MASS AVE | 898 |
| HARVARD ST | 664 |
| RINDGE AVE | 532 |
| EVERETT ST | 506 |
| OXFORD ST | 420 |
| BROADWAY | 358 |
| BRATTLE ST | 332 |
| ALBANY ST | 322 |
| FRANKLIN ST | 308 |
| NORFOLK ST | 306 |
| CONCORD AVE | 302 |
| GARDEN ST | 300 |
| HARVARD YARD | 296 |
| CAMBRIDGEPARK DR | 282 |
| MT AUBURN ST | 236 |
| VASSAR ST | 220 |
| LINNAEAN ST | 214 |
| MAIN ST | 212 |
| BISHOP ALLEN DR | 204 |
| KIRKLAND ST | 186 |
| HAMPSHIRE ST | 182 |
| ERIE ST | 178 |
| WENDELL ST | 172 |
| COLUMBIA ST | 170 |
| HURON AVE | 170 |
| JFK ST | 168 |
| LAMBERT ST | 166 |
| Other | 1,739 |
2002 - 2018 National Fire Incident Reporting System (NFIRS) incidents
- Incident types reported to NFIRS in Cambridge, MA
- 36,51436.9%Rescue & EMS
- 19,66819.9%False Alarm
- 13,67713.8%Fire
- 13,34013.5%Hazardous Condition
- 11,07211.2%Good Intent Call
- 4,3804.4%Service Call
- 1000.1%Special Incident
- Fire incident types reported to NFIRS in Cambridge, MA
- 11,52884.3%Structure Fires
- 1,69112.4%Outside Fires
- 3402.5%Mobile Property/Vehicle Fires
- 1180.9%Other
 According to the data from the years 2002 - 2018 the average number of fires per year is 805. The highest number of reported fires - 1,113 took place in 2017, and the least - 483 in 2005. The data has an increasing trend.
The average number of yearly fire incidents per 10k residents in Cambridge, MA compared to nearest cities:
(Note: Based on data for the last 3 years, including only cities with population 5,000 and above)
| Cambridge: | 99.2 |
| Somerville: | 56.2 |
| Medford: | 41.3 |
| Brookline: | 72.0 |
| Belmont: | 42.3 |
| Watertown: | 12.2 |
| Boston: | 83.7 |
| Everett: | 27.9 |
| Arlington: | 23.8 |
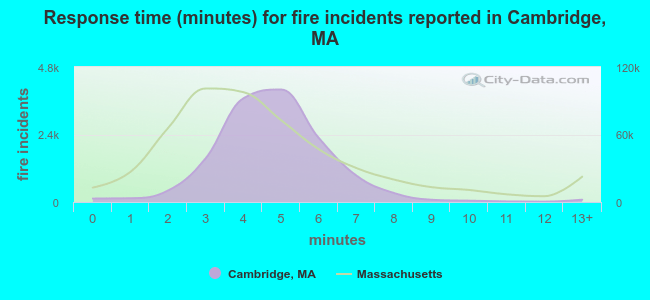 The median response time based on all reported fire incidents is 5 minutes. This is higher compared to the state median value.
The median response time in Cambridge, MA compared to nearest cities:
(Note: Based on data for all years, including only cities with at least 500 fire incidents)
| Cambridge: | 5 minutes |
| Somerville: | 3 minutes |
| Medford: | 3 minutes |
| Brookline: | 3 minutes |
| Belmont: | 4 minutes |
| Watertown: | 4 minutes |
| Boston: | 3 minutes |
| Everett: | 2 minutes |
| Arlington: | 3 minutes |
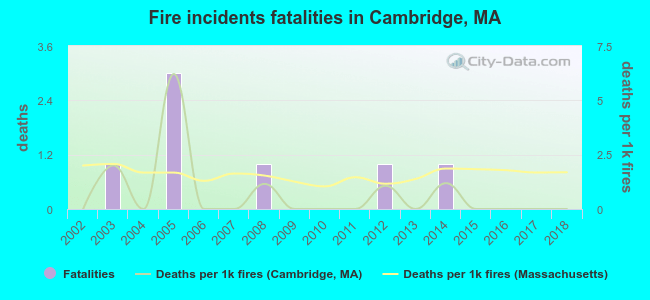 According to the data from the years 2002 - 2018 the average number of fire-related yearly deaths is 0. The highest number of reported deaths - 3 took place in 2005, and the lowest - 0 in 2002. The data has a constant trend.
The average number of deaths per 1,000 fire incidents is 1. This indicator was the highest - 6 in 2005, and the lowest 0 in 2002. The trend for fatalities per 1,000 fires is constant. Compared to the Massachusetts value the number of fatalities per 1,000 fires is much lower.
According to the data from the years 2002 - 2018 the average number of fire-related yearly deaths is 0. The highest number of reported deaths - 3 took place in 2005, and the lowest - 0 in 2002. The data has a constant trend.
The average number of deaths per 1,000 fire incidents is 1. This indicator was the highest - 6 in 2005, and the lowest 0 in 2002. The trend for fatalities per 1,000 fires is constant. Compared to the Massachusetts value the number of fatalities per 1,000 fires is much lower.
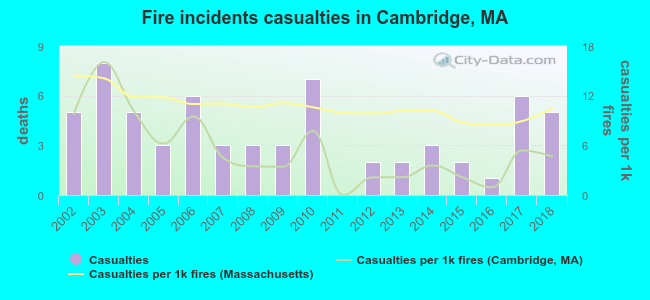 Based on the data from the years 2002 - 2018 the average number of fire-related casualties per year is 4. The highest number of reported injuries - 8 took place in 2003, and the lowest - 0 in 2011. The data has a constant trend.
The average number of injuries per 1,000 fires is 5. This indicator was the highest - 16 in 2003, and the lowest 0 in 2011. The trend for casualties per 1,000 fires is dropping. Compared to the Massachusetts value the number of casualties per 1,000 incidents is much lower.
Based on the data from the years 2002 - 2018 the average number of fire-related casualties per year is 4. The highest number of reported injuries - 8 took place in 2003, and the lowest - 0 in 2011. The data has a constant trend.
The average number of injuries per 1,000 fires is 5. This indicator was the highest - 16 in 2003, and the lowest 0 in 2011. The trend for casualties per 1,000 fires is dropping. Compared to the Massachusetts value the number of casualties per 1,000 incidents is much lower.
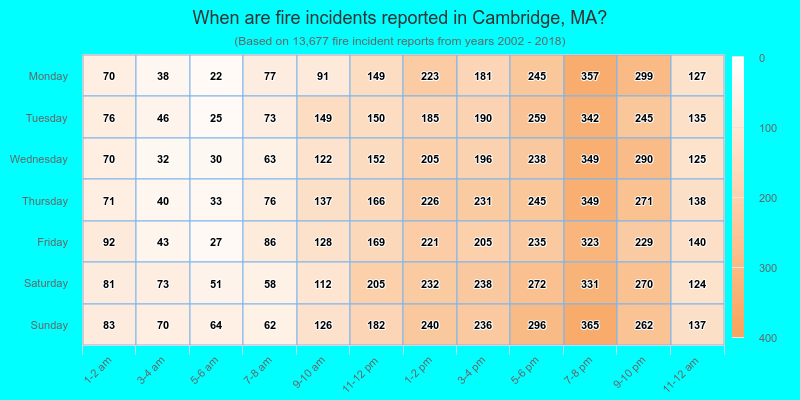
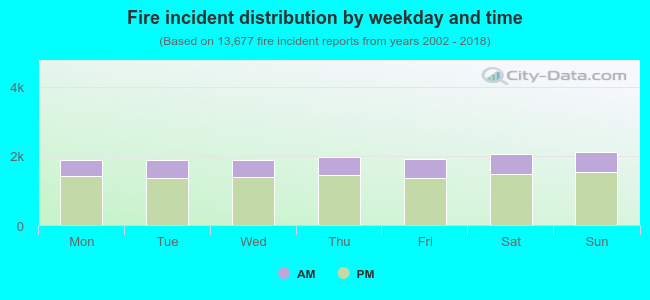 26.8% incidents where reported in the morning and 73.2% in the evening. The most fires (15.5%) took place on Sunday, and the least (13.7%) on Wednesday.
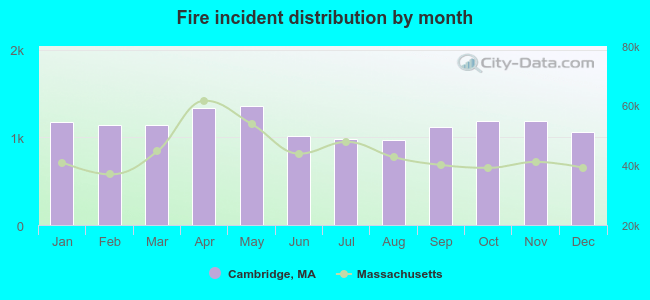 According to the 13,677 fires from years 2002 - 2018 most fires (10.0%) took place during May, and the least (7.1%) in August.
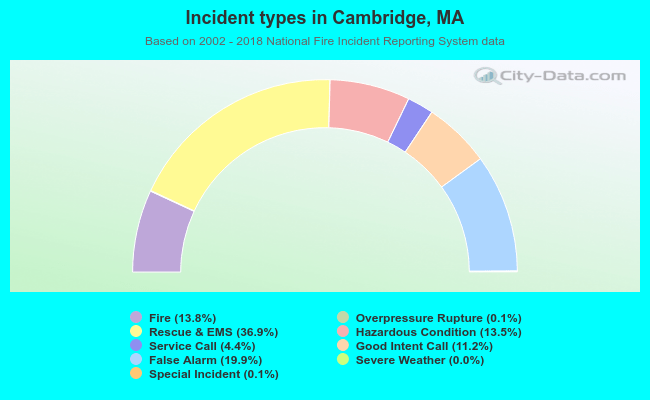 Out of all 98,863 cases reported during the years 2002 - 2018, the most belonged to the categories: Rescue & EMS (36.9%), False Alarm (19.9%), and Fire (13.8%).
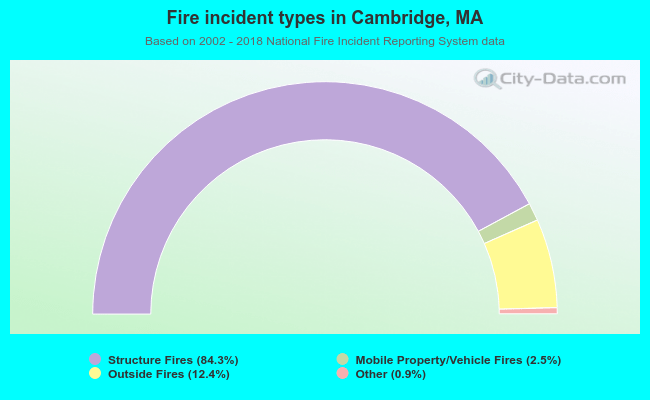 When looking into fire subcategories, the most reports belonged to: Structure Fires (84.3%), and Outside Fires (12.4%).