Jersey City: Fire Incidents, New Jersey (NJ)
Where are fire incidents reported in Jersey City, NJ
Something went wrong! Please refresh the page.
| Fire incidents reported | |
|---|---|
| Sreet name | Count |
| KENNEDY BLVD | 1,924 |
| BERGEN AVE | 1,420 |
| MONTGOMERY ST | 1,166 |
| OCEAN AVE | 1,026 |
| NEWARK AVE | 838 |
| SUMMIT AVE | 806 |
| DUNCAN AVE | 610 |
| PALISADE AVE | 584 |
| WASHINGTON BLVD | 554 |
| DANFORTH AVE | 490 |
| GRAND ST | 488 |
| GARFIELD AVE | 482 |
| UNION ST | 464 |
| MARIN BLVD | 454 |
| WEST SIDE AVE | 446 |
| 2ND ST | 436 |
| CENTRAL AVE | 434 |
| COMMUNIPAW AVE | 408 |
| MLK DR | 406 |
| HUDSON ST | 388 |
| COLUMBUS DR | 366 |
| NEWPORT PKWY | 328 |
| RANDOLPH AVE | 326 |
| ERIE ST | 324 |
| RT 440 | 308 |
| HAGUE ST | 304 |
| ST PAULS AVE | 302 |
| PAVONIA AVE | 296 |
| SIP AVE | 278 |
| GLENWOOD AVE | 274 |
| Other | 4,803 |
2003 - 2018 National Fire Incident Reporting System (NFIRS) incidents
- Incident types reported to NFIRS in Jersey City, NJ
- 43,44830.5%Rescue & EMS
- 27,28519.2%Hazardous Condition
- 21,73315.3%Fire
- 16,74811.8%Good Intent Call
- 15,96111.2%False Alarm
- 15,20010.7%Service Call
- 1,7341.2%Special Incident
- 1910.1%Overpressure Rupture
- Fire incident types reported to NFIRS in Jersey City, NJ
- 17,55080.8%Structure Fires
- 2,42211.1%Outside Fires
- 1,4966.9%Mobile Property/Vehicle Fires
- 2651.2%Other
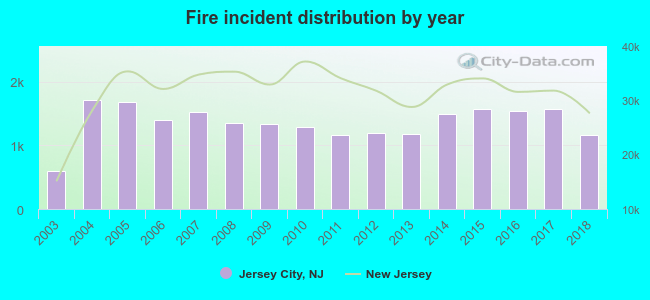 According to the data from the years 2003 - 2018 the average number of fire incidents per year is 1,358. The highest number of reported fire incidents - 1,705 took place in 2004, and the least - 595 in 2003. The data has a rising trend.
The average number of yearly fire incidents per 10k residents in Jersey City, NJ compared to nearest cities:
(Note: Based on data for the last 3 years, including only cities with population 5,000 and above)
| Jersey City: | 54.2 |
| Hoboken: | 42.3 |
| Union City: | 27.0 |
| Secaucus: | 39.3 |
| Kearny: | 23.8 |
| Bayonne: | 12.1 |
| Harrison: | 30.8 |
| West New York: | 20.0 |
| Guttenberg: | 20.6 |
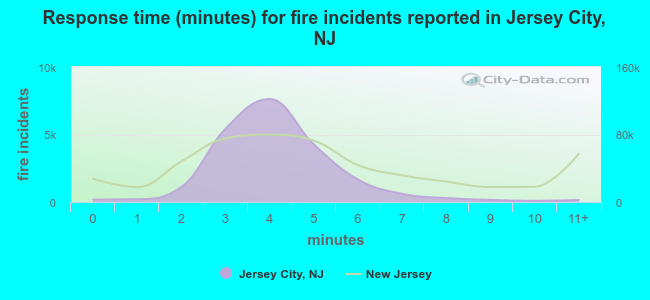 The median response time based on all reported fire incidents is 4 minutes. This is lower compared to the New Jersey median value.
The median response time in Jersey City, NJ compared to nearest cities:
(Note: Based on data for all years, including only cities with at least 500 fire incidents)
| Jersey City: | 4 minutes |
| Hoboken: | 3 minutes |
| Union City: | 4 minutes |
| Secaucus: | 4 minutes |
| Kearny: | 4 minutes |
| Bayonne: | 4 minutes |
| Harrison: | 2 minutes |
| West New York: | 4 minutes |
| Newark: | 3 minutes |
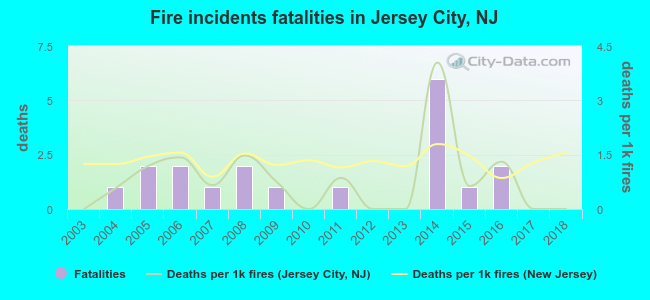 Based on the data from the years 2003 - 2018 the average number of fire-related yearly deaths is 1. The highest number of reported deaths - 6 took place in 2014, and the lowest - 0 in 2003. The data has a constant trend.
The average number of deaths per 1,000 fires is 1. This indicator was the highest - 4 in 2014, and the lowest 0 in 2003. The trend for deaths per 1,000 fires is rising. Compared to the state value the number of deaths per 1,000 incidents is lower.
Based on the data from the years 2003 - 2018 the average number of fire-related yearly deaths is 1. The highest number of reported deaths - 6 took place in 2014, and the lowest - 0 in 2003. The data has a constant trend.
The average number of deaths per 1,000 fires is 1. This indicator was the highest - 4 in 2014, and the lowest 0 in 2003. The trend for deaths per 1,000 fires is rising. Compared to the state value the number of deaths per 1,000 incidents is lower.Deaths per 1,000 incidents in Jersey City, NJ compared to nearest cities:
(Note: Based on data for all years, including only cities with at least 2,500 fire incidents)
| Jersey City: | 0.9 |
| Hoboken: | 0.7 |
| Union City: | 2.6 |
| Newark: | 1.3 |
| East Orange: | 3.9 |
| Elizabeth: | 1.3 |
| Irvington: | 2.9 |
| Passaic: | 0.3 |
| Union: | 2.7 |
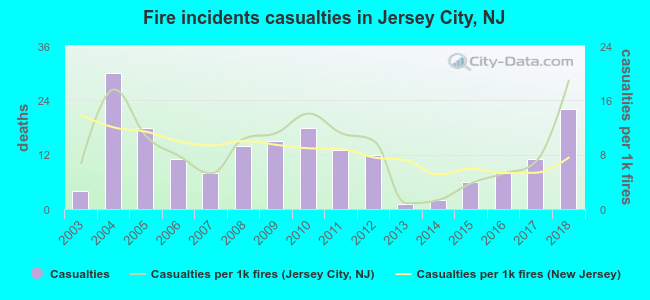 According to the reports from the years 2003 - 2018 the average number of fire-related yearly casualties is 12. The highest number of casualties - 30 took place in 2004, and the lowest - 1 in 2013. The data has a growing trend.
The average number of injuries per 1,000 fire incidents is 9. This indicator was the highest - 19 in 2018, and the lowest 1 in 2013. The trend for injuries per 1,000 incidents is growing. Compared to the state value the number of injuries per 1,000 fires is similar.
According to the reports from the years 2003 - 2018 the average number of fire-related yearly casualties is 12. The highest number of casualties - 30 took place in 2004, and the lowest - 1 in 2013. The data has a growing trend.
The average number of injuries per 1,000 fire incidents is 9. This indicator was the highest - 19 in 2018, and the lowest 1 in 2013. The trend for injuries per 1,000 incidents is growing. Compared to the state value the number of injuries per 1,000 fires is similar.Casualties per 1,000 incidents in Jersey City, NJ compared to nearest cities:
(Note: Based on data for all years, including only cities with at least 500 fire incidents)
| Jersey City: | 8.9 |
| Hoboken: | 4.4 |
| Union City: | 10.8 |
| Secaucus: | 5.0 |
| Kearny: | 16.0 |
| Bayonne: | 6.3 |
| Harrison: | 8.3 |
| West New York: | 3.4 |
| Newark: | 5.7 |
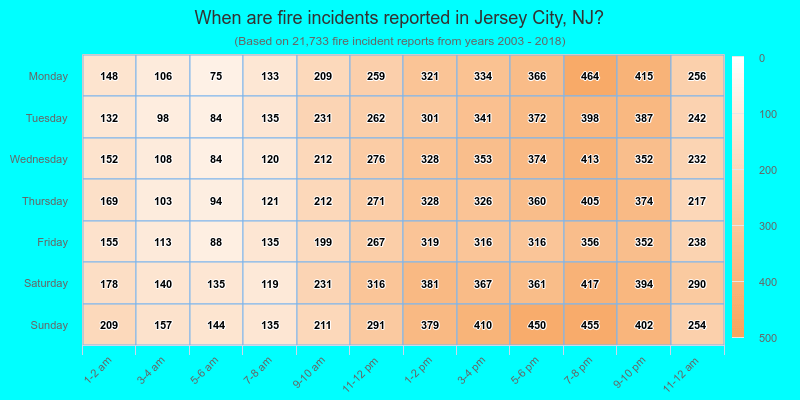
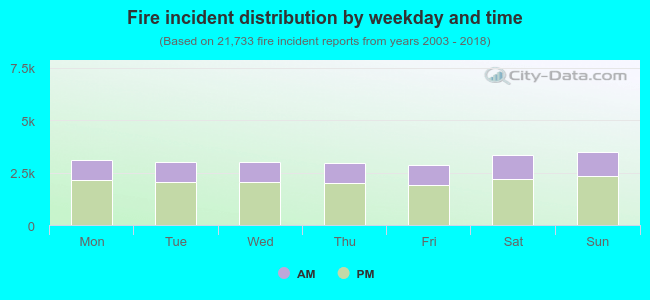 32.3% incidents where reported in the morning and 67.7% in the evening. The most fires (16.1%) took place on Sunday, and the least (13.1%) on Friday.
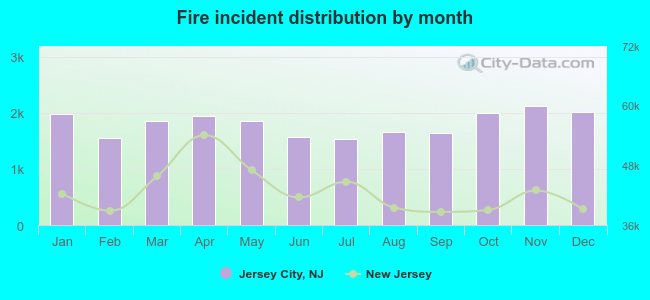 Based on the 21,733 reports from years 2003 - 2018 most fires (9.8%) took place during November, and the least (7.1%) in July.
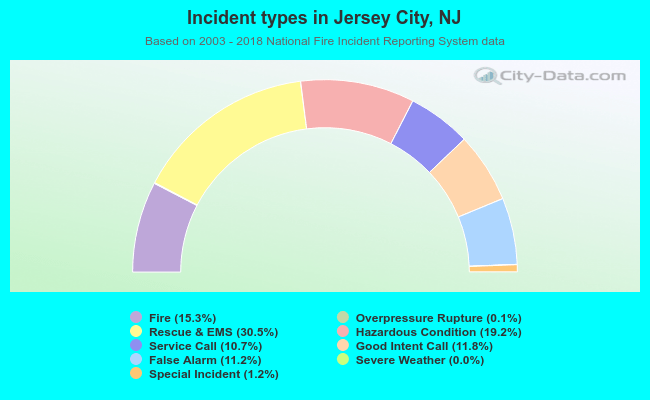 Out of all 142,312 cases reported during the years 2003 - 2018, the most belonged to the categories: Rescue & EMS (30.5%), Hazardous Condition (19.2%), and Fire (15.3%).
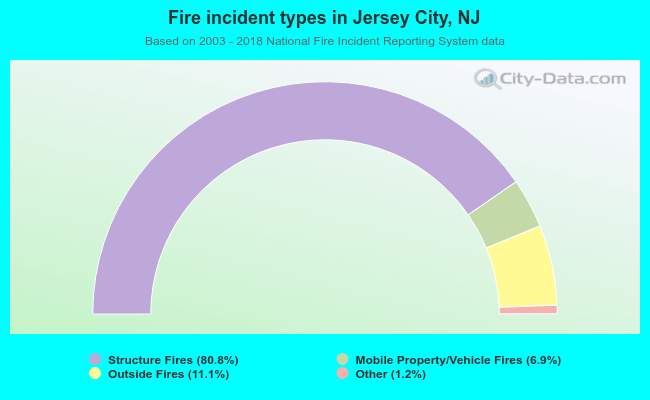 When looking into fire subcategories, the most incidents belonged to: Structure Fires (80.8%), and Outside Fires (11.1%).