Newark: Fire Incidents, New Jersey (NJ)
Where are fire incidents reported in Newark, NJ
Something went wrong! Please refresh the page.
| Fire incidents reported | |
|---|---|
| Sreet name | Count |
| BROAD ST | 736 |
| ELIZABETH AVE | 510 |
| HUNTERDON ST | 450 |
| BROADWAY | 424 |
| ORANGE AVE | 320 |
| BERGEN ST | 284 |
| MARKET ST | 284 |
| AVON AVE | 280 |
| CLINTON AVE | 268 |
| IRVINE TURNER BLVD | 254 |
| 6TH ST | 252 |
| CLIFTON AVE | 236 |
| FERRY ST | 236 |
| 11TH ST | 230 |
| CENTRAL AVE | 230 |
| SANFORD AVE | 222 |
| SUMMER AVE | 220 |
| ORANGE ST | 218 |
| 12TH ST | 214 |
| 10TH ST | 208 |
| 7TH ST | 208 |
| FRELINGHUYSEN AVE | 202 |
| 13TH ST | 200 |
| MUNN AVE | 188 |
| MOUNT PROSPECT AVE | 182 |
| BROAD ST | 174 |
| 19TH ST | 170 |
| SPRINGFIELD AVE | 168 |
| ROSEVILLE AVE | 164 |
| COURT ST | 162 |
| Other | 8,878 |
2003 - 2018 National Fire Incident Reporting System (NFIRS) incidents
- Incident types reported to NFIRS in Newark, NJ
- 19,20426.0%Hazardous Condition
- 16,77222.7%Fire
- 16,09721.8%False Alarm
- 9,13112.3%Rescue & EMS
- 7,45910.1%Service Call
- 4,2005.7%Good Intent Call
- 5930.8%Special Incident
- 4460.6%Overpressure Rupture
- 940.1%Severe Weather
- Fire incident types reported to NFIRS in Newark, NJ
- 9,02253.8%Structure Fires
- 4,35826.0%Outside Fires
- 3,24819.4%Mobile Property/Vehicle Fires
- 1440.9%Other
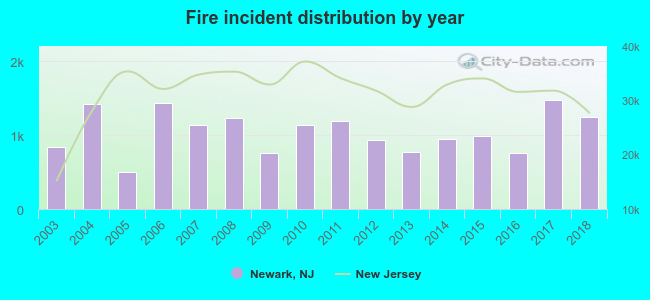 According to the data from the years 2003 - 2018 the average number of fires per year is 1,048. The highest number of fires - 1,469 took place in 2017, and the least - 505 in 2005. The data has a growing trend.
The average number of yearly fire incidents per 10k residents in Newark, NJ compared to nearest cities:
(Note: Based on data for the last 3 years, including only cities with population 5,000 and above)
| Newark: | 41.2 |
| Harrison: | 30.8 |
| East Orange: | 48.4 |
| Irvington: | 26.2 |
| Kearny: | 23.8 |
| Orange: | 24.7 |
| Hillside: | 34.1 |
| South Orange: | 24.3 |
| Belleville: | 25.0 |
 The median response time based on all reported fire incidents is 3 minutes. This is lower compared to the state median value.
The median response time in Newark, NJ compared to nearest cities:
(Note: Based on data for all years, including only cities with at least 500 fire incidents)
| Newark: | 3 minutes |
| Harrison: | 2 minutes |
| East Orange: | 4 minutes |
| Irvington: | 3 minutes |
| Kearny: | 4 minutes |
| Orange: | 3 minutes |
| Hillside: | 3 minutes |
| South Orange: | 3 minutes |
| Belleville: | 3 minutes |
 Based on the reports from the years 2003 - 2018 the average number of fire-related yearly deaths is 1. The highest number of reported deaths - 6 took place in 2014, and the lowest - 0 in 2004. The data has a constant trend.
The average number of fatalities per 1,000 fires is 1. This indicator was the highest - 6 in 2014, and the lowest 0 in 2004. The trend for fatalities per 1,000 fires is dropping. Compared to the New Jersey value the number of deaths per 1,000 fires is about the same.
Based on the reports from the years 2003 - 2018 the average number of fire-related yearly deaths is 1. The highest number of reported deaths - 6 took place in 2014, and the lowest - 0 in 2004. The data has a constant trend.
The average number of fatalities per 1,000 fires is 1. This indicator was the highest - 6 in 2014, and the lowest 0 in 2004. The trend for fatalities per 1,000 fires is dropping. Compared to the New Jersey value the number of deaths per 1,000 fires is about the same.Deaths per 1,000 incidents in Newark, NJ compared to nearest cities:
(Note: Based on data for all years, including only cities with at least 2,500 fire incidents)
| Newark: | 1.3 |
| East Orange: | 3.9 |
| Irvington: | 2.9 |
| Union: | 2.7 |
| Elizabeth: | 1.3 |
| Jersey City: | 0.9 |
| Hoboken: | 0.7 |
| Union City: | 2.6 |
| Passaic: | 0.3 |
 According to the data from the years 2003 - 2018 the average number of fire-related casualties per year is 6. The highest number of reported casualties - 27 took place in 2007, and the lowest - 0 in 2011. The data has a declining trend.
The average number of injuries per 1,000 fire incidents is 6. This indicator was the highest - 24 in 2005, and the lowest 0 in 2011. The trend for injuries per 1,000 fires is decreasing. Compared to the state value the number of casualties per 1,000 fires is lower.
According to the data from the years 2003 - 2018 the average number of fire-related casualties per year is 6. The highest number of reported casualties - 27 took place in 2007, and the lowest - 0 in 2011. The data has a declining trend.
The average number of injuries per 1,000 fire incidents is 6. This indicator was the highest - 24 in 2005, and the lowest 0 in 2011. The trend for injuries per 1,000 fires is decreasing. Compared to the state value the number of casualties per 1,000 fires is lower.Casualties per 1,000 incidents in Newark, NJ compared to nearest cities:
(Note: Based on data for all years, including only cities with at least 500 fire incidents)
| Newark: | 5.7 |
| Harrison: | 8.3 |
| East Orange: | 10.9 |
| Irvington: | 15.3 |
| Kearny: | 16.0 |
| Orange: | 6.0 |
| Hillside: | 3.4 |
| South Orange: | 8.9 |
| Belleville: | 10.2 |
 36.7% incidents where reported in the morning and 63.3% in the evening. The most fires (15.8%) took place on Sunday, and the least (13.3%) on Monday.
 Based on the 16,772 fire incident reports from years 2003 - 2018 most fires (9.8%) took place during April, and the least (6.8%) in December.
 Out of all 73,996 cases reported during the years 2003 - 2018, the most belonged to the categories: Hazardous Condition (26.0%), Fire (22.7%), and False Alarm (21.8%).
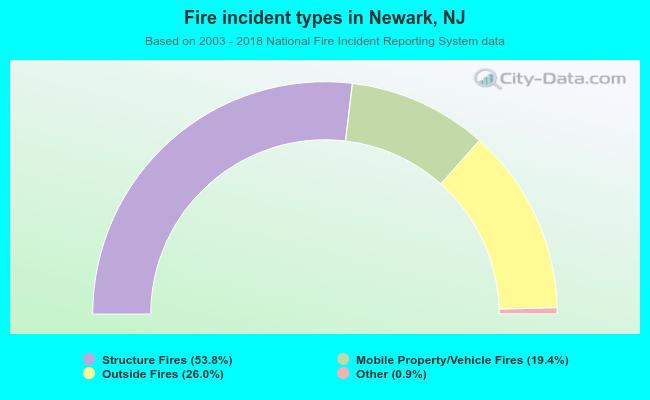 When looking into fire subcategories, the most incidents belonged to: Structure Fires (53.8%), and Outside Fires (26.0%).