West New York: Fire Incidents, New Jersey (NJ)
Where are fire incidents reported in West New York, NJ
Something went wrong! Please refresh the page.
| Fire incidents reported | |
|---|---|
| Sreet name | Count |
| BLVD EAST | 314 |
| PARK AVE | 296 |
| AVE AT PORT IMPERIAL | 130 |
| BROADWAY | 116 |
| BERGENLINE AVENUE | 92 |
| BERGENLINE AVE | 90 |
| HUDSON AVE | 82 |
| HUDSON AVENUE | 82 |
| 60TH ST | 64 |
| 59TH STREET | 62 |
| PALISADE AVE | 62 |
| PALISADE AVENUE | 58 |
| 52ND STREET | 54 |
| KENNEDY BLVD | 54 |
| 60TH STREET | 52 |
| 57TH STREET | 48 |
| 62ND ST | 48 |
| 51ST STREET | 46 |
| 54TH STREET | 42 |
| ADAMS ST | 40 |
| JEFFERSON STREET | 40 |
| 62ND STREET | 38 |
| 59TH ST | 36 |
| 56TH STREET | 34 |
| 61ST STREET | 34 |
| 64TH STREET | 34 |
| 67TH STREET | 34 |
| MONROE PLACE | 34 |
| 54TH ST | 32 |
| MADISON STREET | 30 |
2004 - 2018 National Fire Incident Reporting System (NFIRS) incidents
- Incident types reported to NFIRS in West New York, NJ
- 2,87331.8%Hazardous Condition
- 2,59528.8%False Alarm
- 1,48316.4%Fire
- 99911.1%Service Call
- 5686.3%Rescue & EMS
- 4815.3%Good Intent Call
- 130.1%Special Incident
- Fire incident types reported to NFIRS in West New York, NJ
- 1,12976.1%Structure Fires
- 25617.3%Outside Fires
- 694.7%Mobile Property/Vehicle Fires
- 292.0%Other
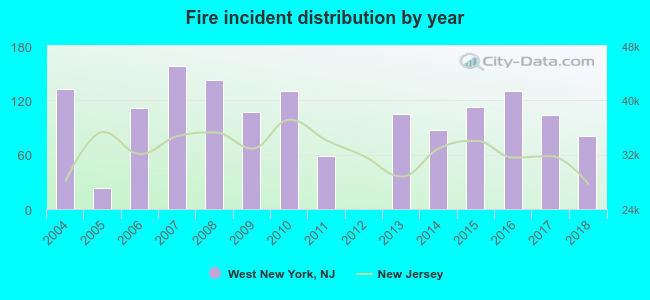 According to the data from the years 2004 - 2018 the average number of fire incidents per year is 99. The highest number of fires - 158 took place in 2007, and the least - 0 in 2012. The data has a decreasing trend.
The average number of yearly fire incidents per 10k residents in West New York, NJ compared to nearest cities:
(Note: Based on data for the last 3 years, including only cities with population 5,000 and above)
| West New York: | 20.0 |
| Guttenberg: | 20.6 |
| Union City: | 27.0 |
| Fairview: | 16.3 |
| Secaucus: | 39.3 |
| Cliffside Park: | 53.6 |
| Ridgefield: | 38.7 |
| Hoboken: | 42.3 |
| Edgewater: | 39.4 |
 The median response time based on all reported fire incidents is 4 minutes. This is lower compared to the New Jersey median value.
The median response time in West New York, NJ compared to nearest cities:
(Note: Based on data for all years, including only cities with at least 500 fire incidents)
| West New York: | 4 minutes |
| Union City: | 4 minutes |
| Secaucus: | 4 minutes |
| Cliffside Park: | 5 minutes |
| Ridgefield: | 3 minutes |
| Hoboken: | 3 minutes |
| Edgewater: | 3 minutes |
| Palisades Park: | 2 minutes |
| Fort Lee: | 4 minutes |
 According to the data from the years 2004 - 2018 the average number of fire-related casualties per year is 0. The highest number of reported casualties - 3 took place in 2006, and the lowest - 0 in 2004. The data has a constant trend.
The average number of injuries per 1,000 fire incidents is 3. This indicator was the highest - 27 in 2006, and the lowest 0 in 2004. The trend for casualties per 1,000 incidents is constant. Compared to the state value the number of injuries per 1,000 fire incidents is much lower.
According to the data from the years 2004 - 2018 the average number of fire-related casualties per year is 0. The highest number of reported casualties - 3 took place in 2006, and the lowest - 0 in 2004. The data has a constant trend.
The average number of injuries per 1,000 fire incidents is 3. This indicator was the highest - 27 in 2006, and the lowest 0 in 2004. The trend for casualties per 1,000 incidents is constant. Compared to the state value the number of injuries per 1,000 fire incidents is much lower.Casualties per 1,000 incidents in West New York, NJ compared to nearest cities:
(Note: Based on data for all years, including only cities with at least 500 fire incidents)
| West New York: | 3.4 |
| Union City: | 10.8 |
| Secaucus: | 5.0 |
| Cliffside Park: | 4.7 |
| Ridgefield: | 7.6 |
| Hoboken: | 4.4 |
| Edgewater: | 0.0 |
| Palisades Park: | 7.4 |
| Fort Lee: | 18.4 |
 31.0% incidents where reported in the morning and 69.0% in the evening. The most fires (16.0%) took place on Sunday, and the least (13.2%) on Monday.
 According to the 1,483 fires from years 2004 - 2018 most fires (10.8%) took place during May, and the least (5.6%) in September.
 Out of all 9,021 cases reported during the years 2004 - 2018, the most belonged to the categories: Hazardous Condition (31.8%), False Alarm (28.8%), and Fire (16.4%).
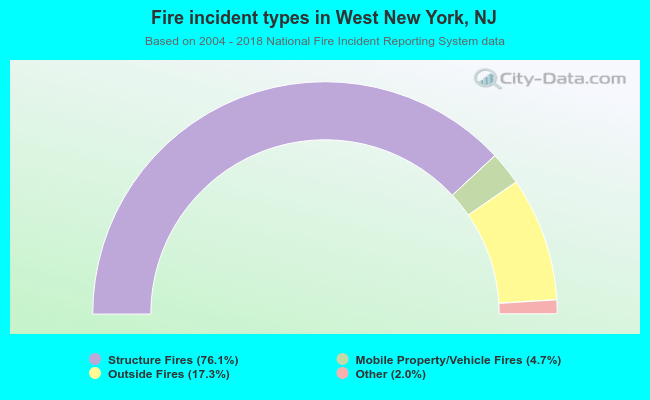 When looking into fire subcategories, the most reports belonged to: Structure Fires (76.1%), and Outside Fires (17.3%).