Edgewater: Fire Incidents, New Jersey (NJ)
Where are fire incidents reported in Edgewater, NJ
Something went wrong! Please refresh the page.
|
| |||||||||||||||||||||||||||||||||||||||||||||||||||||||||||||||||||||||||||||||||||||||||||||||||||||||||||||
2005 - 2018 National Fire Incident Reporting System (NFIRS) incidents
- Incident types reported to NFIRS in Edgewater, NJ
- 75532.1%False Alarm
- 63827.1%Hazardous Condition
- 57524.4%Fire
- 1857.9%Service Call
- 1416.0%Rescue & EMS
- 401.7%Good Intent Call
- 120.5%Special Incident
- 50.2%Overpressure Rupture
- Fire incident types reported to NFIRS in Edgewater, NJ
- 37565.2%Structure Fires
- 14625.4%Outside Fires
- 295.0%Other
- 254.3%Mobile Property/Vehicle Fires
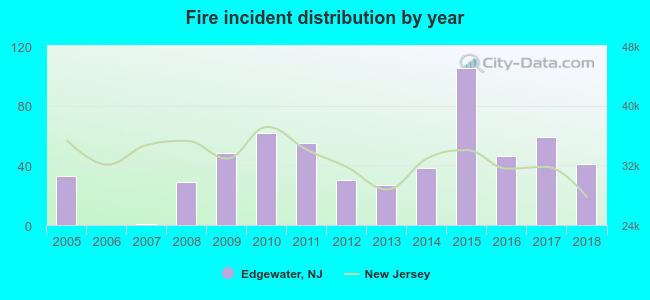 According to the data from the years 2005 - 2018 the average number of fire incidents per year is 41. The highest number of reported fire incidents - 105 took place in 2015, and the least - 0 in 2006. The data has a rising trend.
The average number of yearly fire incidents per 10k residents in Edgewater, NJ compared to nearest cities:
(Note: Based on data for the last 3 years, including only cities with population 5,000 and above)
| Edgewater: | 39.4 |
| Cliffside Park: | 53.6 |
| Fort Lee: | 43.8 |
| Palisades Park: | 37.8 |
| Ridgefield: | 38.7 |
| Fairview: | 16.3 |
| Leonia: | 53.6 |
| Guttenberg: | 20.6 |
| Ridgefield Park: | 30.3 |
 The median response time based on all reported fire incidents is 3 minutes. This is lower compared to the New Jersey median value.
The median response time in Edgewater, NJ compared to nearest cities:
(Note: Based on data for all years, including only cities with at least 500 fire incidents)
| Edgewater: | 3 minutes |
| Cliffside Park: | 5 minutes |
| Fort Lee: | 4 minutes |
| Palisades Park: | 2 minutes |
| Ridgefield: | 3 minutes |
| Leonia: | 3 minutes |
| West New York: | 4 minutes |
| Englewood: | 4 minutes |
| Teaneck: | 3 minutes |
 28.3% incidents where reported in the morning and 71.7% in the evening. The most fires (17.0%) took place on Wednesday, and the least (11.8%) on Sunday.
 According to the 575 fires from years 2005 - 2018 most fires (13.9%) took place during April, and the least (5.0%) in October.
 Out of all 2,353 cases reported during the years 2005 - 2018, the most belonged to the categories: False Alarm (32.1%), Hazardous Condition (27.1%), and Fire (24.4%).
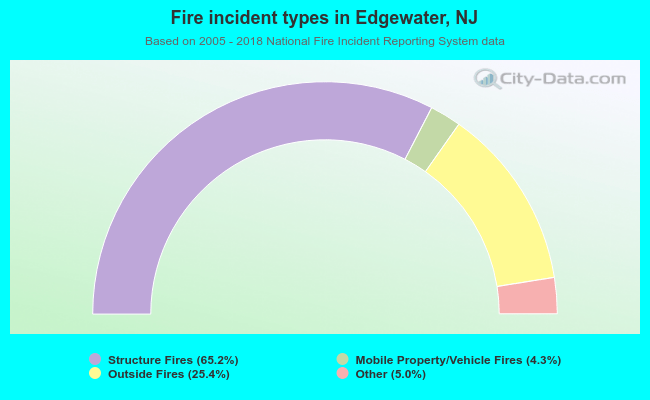 When looking into fire subcategories, the most incidents belonged to: Structure Fires (65.2%), and Outside Fires (25.4%).