Immokalee: Fire Incidents, Florida (FL)
Where are fire incidents reported in Immokalee, FL
Something went wrong! Please refresh the page.
| Fire incidents reported | |
|---|---|
| Sreet name | Count |
| 1ST ST | 168 |
| MAIN ST | 144 |
| LAKE TRAFFORD RD | 128 |
| STATE ROAD 29 | 118 |
| DELAWARE AVE | 90 |
| NEW MARKET RD | 84 |
| 15TH ST | 80 |
| 19TH ST | 80 |
| IMMOKALEE DR | 80 |
| 9TH ST | 76 |
| 3RD ST | 68 |
| 2ND ST | 66 |
| CARSON RD | 62 |
| HOPE CIR | 62 |
| COLORADO AVE | 48 |
| 4TH ST | 44 |
| CHADWICK CIR | 40 |
| 6TH ST | 38 |
| BOSTON AVE | 38 |
| PLUM ST | 38 |
| STATE ROAD 82 | 38 |
| MADISON AVE | 36 |
| SR 29 | 36 |
| 11TH ST | 32 |
| 7TH ST | 32 |
| AIRPARK BLVD | 32 |
| 8TH AVE | 30 |
| BELL CIR | 28 |
| JEFFERSON AVE | 28 |
| MARJORIE ST | 28 |
| Other | 470 |
2002 - 2018 National Fire Incident Reporting System (NFIRS) incidents
- Incident types reported to NFIRS in Immokalee, FL
- 17,46066.0%Rescue & EMS
- 2,3859.0%Good Intent Call
- 2,3428.9%Fire
- 1,7256.5%Service Call
- 1,5235.8%Hazardous Condition
- 9753.7%False Alarm
- Fire incident types reported to NFIRS in Immokalee, FL
- 1,14949.1%Outside Fires
- 66028.2%Structure Fires
- 47620.3%Mobile Property/Vehicle Fires
- 572.4%Other
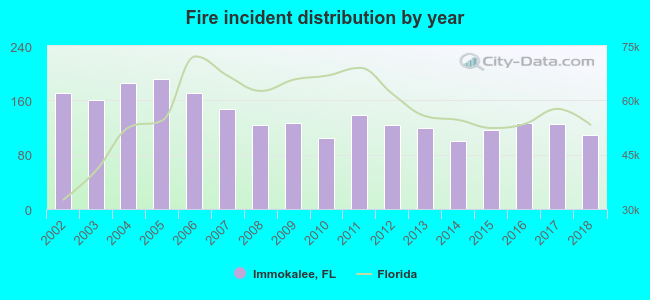 According to the data from the years 2002 - 2018 the average number of fires per year is 138. The highest number of fire incidents - 192 took place in 2005, and the least - 100 in 2014. The data has a decreasing trend.
The average number of yearly fire incidents per 10k residents in Immokalee, FL compared to nearest cities:
(Note: Based on data for the last 3 years, including only cities with population 5,000 and above)
| Immokalee: | 49.8 |
| Lehigh Acres: | 39.2 |
| La Belle: | 44.6 |
| Gateway: | 1.2 |
| Bonita Springs: | 27.4 |
| Golden Gate: | 2.9 |
| Estero: | 26.8 |
| San Carlos Park: | 0.6 |
| Naples: | 238.3 |
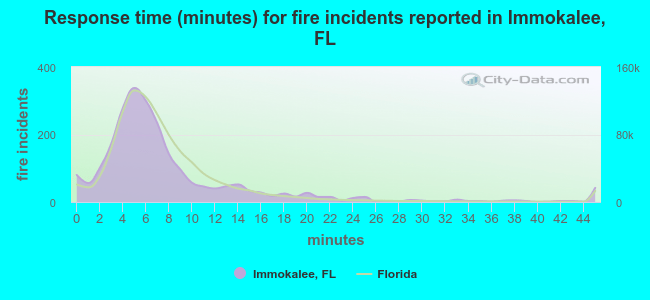 The median response time based on all reported fire incidents is 6 minutes. This is about the same as the state median value.
The median response time in Immokalee, FL compared to nearest cities:
(Note: Based on data for all years, including only cities with at least 500 fire incidents)
| Immokalee: | 6 minutes |
| Lehigh Acres: | 7 minutes |
| La Belle: | 7 minutes |
| Bonita Springs: | 6 minutes |
| Alva: | 7 minutes |
| Estero: | 6 minutes |
| Naples: | 6 minutes |
| Fort Myers: | 5 minutes |
| North Fort Myers: | 6 minutes |
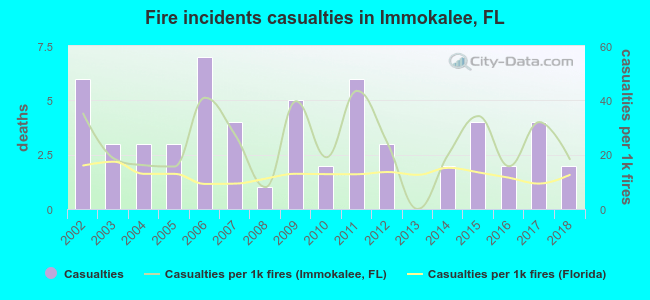 According to the reports from the years 2002 - 2018 the average number of fire-related casualties per year is 3. The highest number of reported casualties - 7 took place in 2006, and the lowest - 0 in 2013. The data has a declining trend.
The average number of casualties per 1,000 fire incidents is 24. This indicator was the highest - 43 in 2011, and the lowest 0 in 2013. The trend for injuries per 1,000 fires is declining. Compared to the state value the number of casualties per 1,000 fires is higher.
According to the reports from the years 2002 - 2018 the average number of fire-related casualties per year is 3. The highest number of reported casualties - 7 took place in 2006, and the lowest - 0 in 2013. The data has a declining trend.
The average number of casualties per 1,000 fire incidents is 24. This indicator was the highest - 43 in 2011, and the lowest 0 in 2013. The trend for injuries per 1,000 fires is declining. Compared to the state value the number of casualties per 1,000 fires is higher.Casualties per 1,000 incidents in Immokalee, FL compared to nearest cities:
(Note: Based on data for all years, including only cities with at least 500 fire incidents)
| Immokalee: | 24.3 |
| Lehigh Acres: | 10.9 |
| La Belle: | 3.9 |
| Bonita Springs: | 5.2 |
| Alva: | 7.9 |
| Estero: | 3.8 |
| Naples: | 8.3 |
| Fort Myers: | 15.4 |
| North Fort Myers: | 7.1 |
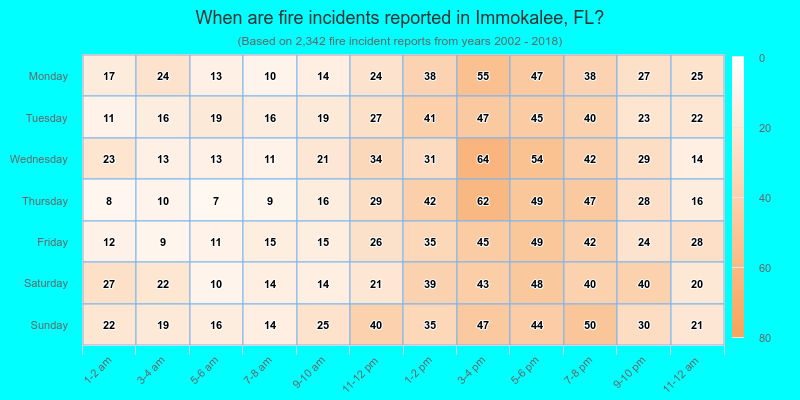
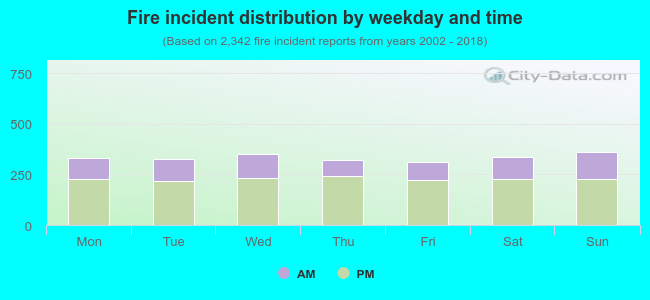 31.4% incidents where reported in the morning and 68.6% in the evening. The most fires (15.5%) took place on Sunday, and the least (13.3%) on Friday.
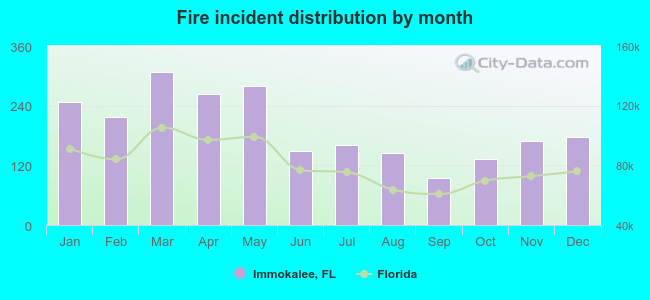 According to the 2,342 fire incident reports from years 2002 - 2018 most fires (13.1%) took place during March, and the least (4.0%) in September.
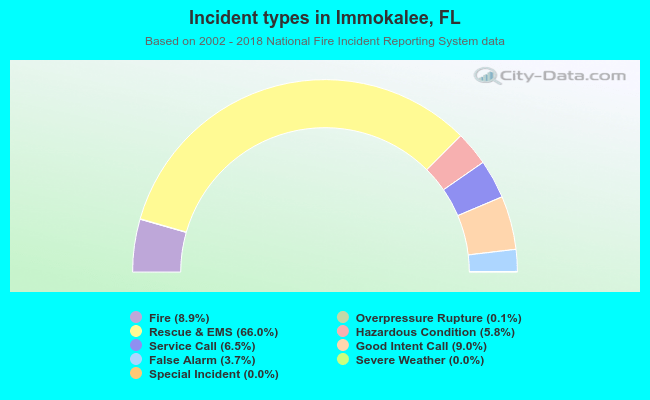 Out of all 26,443 cases reported during the years 2002 - 2018, the most belonged to the categories: Rescue & EMS (66.0%), Good Intent Call (9.0%), and Fire (8.9%).
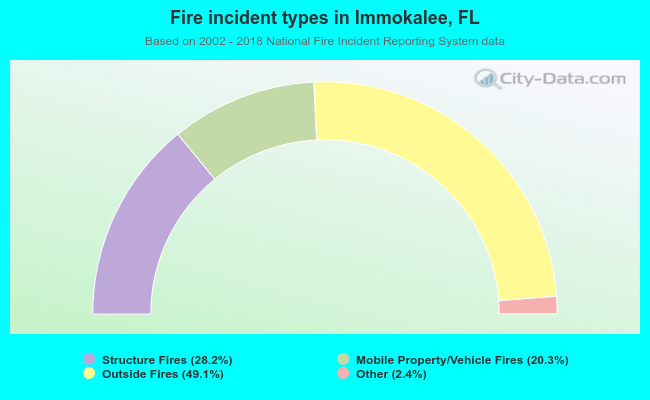 When looking into fire subcategories, the most incidents belonged to: Outside Fires (49.1%), and Structure Fires (28.2%).