Henderson: Fire Incidents, North Carolina (NC)
Where are fire incidents reported in Henderson, NC
Something went wrong! Please refresh the page.
| Fire incidents reported | |
|---|---|
| Sreet name | Count |
| RALEIGH RD | 182 |
| ANDREWS AVE | 174 |
| GARNETT ST | 122 |
| DABNEY DR | 118 |
| NC 39 HWY | 116 |
| VICKSBORO RD | 98 |
| COOPER DR | 86 |
| RUIN CREEK RD | 86 |
| BECKFORD DR | 84 |
| DABNEY RD | 74 |
| OLD EPSOM RD | 72 |
| WARRENTON RD | 72 |
| BEARPOND RD | 62 |
| BODDIE ST | 60 |
| AMERICAL RD | 58 |
| WILLIAMS ST | 58 |
| GUN CLUB RD | 56 |
| NEWTON DAIRY RD | 52 |
| NICHOLAS ST | 52 |
| SATTERWHITE POINT RD | 52 |
| CHESTNUT ST | 50 |
| FAULKNER TOWN RD | 48 |
| LYNNBANK RD | 48 |
| PARHAM RD | 48 |
| HARRIETT ST | 46 |
| HIGHLAND AVE | 46 |
| ROWLAND ST | 46 |
| CLUB POND RD | 42 |
| MONTGOMERY ST | 42 |
| OLD NORLINA RD | 42 |
| Other | 2,221 |
2002 - 2018 National Fire Incident Reporting System (NFIRS) incidents
- Incident types reported to NFIRS in Henderson, NC
- 12,04852.0%Rescue & EMS
- 4,41319.1%Fire
- 2,84512.3%Good Intent Call
- 1,6056.9%Hazardous Condition
- 1,1204.8%False Alarm
- 1,0244.4%Service Call
- 590.3%Overpressure Rupture
- 300.1%Severe Weather
- Fire incident types reported to NFIRS in Henderson, NC
- 1,73039.2%Structure Fires
- 1,61636.6%Outside Fires
- 70215.9%Mobile Property/Vehicle Fires
- 3658.3%Other
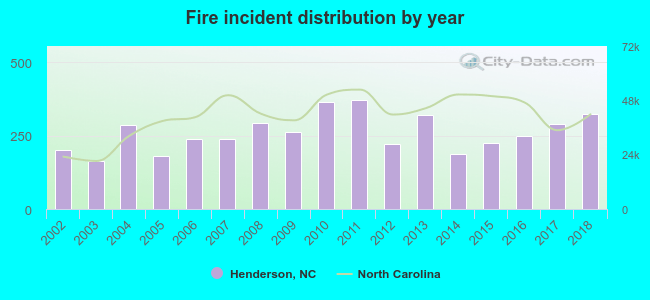 Based on the data from the years 2002 - 2018 the average number of fires per year is 260. The highest number of reported fires - 370 took place in 2011, and the least - 165 in 2003. The data has an increasing trend.
The average number of yearly fire incidents per 10k residents in Henderson, NC compared to nearest cities:
(Note: Based on data for the last 3 years, including only cities with population 5,000 and above)
| Henderson: | 187.8 |
| Oxford: | 123.2 |
| Butner: | 13.0 |
| Wake Forest: | 42.9 |
| Rolesville: | 25.9 |
| Roxboro: | 203.9 |
| Nashville: | 157.4 |
| Durham: | 32.5 |
| Knightdale: | 119.9 |
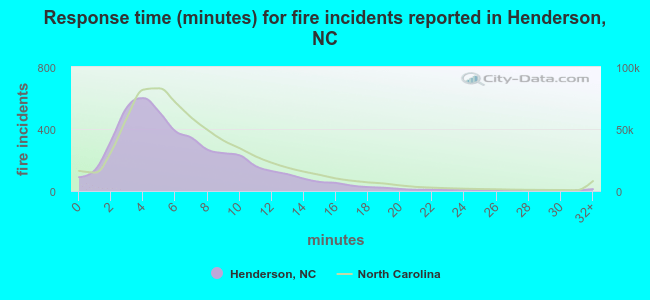 The median response time based on all reported fire incidents is 6 minutes. This is similar to the state median value.
The median response time in Henderson, NC compared to nearest cities:
(Note: Based on data for all years, including only cities with at least 500 fire incidents)
| Henderson: | 6 minutes |
| Oxford: | 7 minutes |
| Franklinton: | 9 minutes |
| Louisburg: | 7 minutes |
| Creedmoor: | 8 minutes |
| Youngsville: | 9 minutes |
| Wake Forest: | 6 minutes |
| Bunn: | 8 minutes |
| Littleton: | 9 minutes |
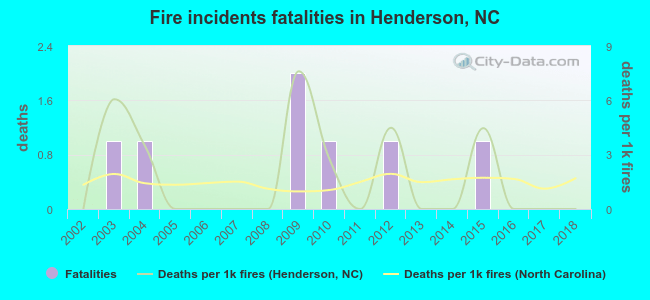 Based on the reports from the years 2002 - 2018 the average number of fire-related fatalities per year is 0. The highest number of reported deaths - 2 took place in 2009, and the lowest - 0 in 2002. The data has a constant trend.
The average number of fatalities per 1,000 fires is 2. This indicator was the highest - 8 in 2009, and the lowest 0 in 2002. The trend for fatalities per 1,000 fires is constant. Compared to the North Carolina value the number of fatalities per 1,000 fire incidents is about the same.
Based on the reports from the years 2002 - 2018 the average number of fire-related fatalities per year is 0. The highest number of reported deaths - 2 took place in 2009, and the lowest - 0 in 2002. The data has a constant trend.
The average number of fatalities per 1,000 fires is 2. This indicator was the highest - 8 in 2009, and the lowest 0 in 2002. The trend for fatalities per 1,000 fires is constant. Compared to the North Carolina value the number of fatalities per 1,000 fire incidents is about the same.Deaths per 1,000 incidents in Henderson, NC compared to nearest cities:
(Note: Based on data for all years, including only cities with at least 2,500 fire incidents)
| Henderson: | 1.6 |
| Wake Forest: | 0.0 |
| Durham: | 1.4 |
| Raleigh: | 0.6 |
| Rocky Mount: | 1.7 |
| Cary: | 1.1 |
| Chapel Hill: | 0.5 |
| Garner: | 1.6 |
| Clayton: | 0.0 |
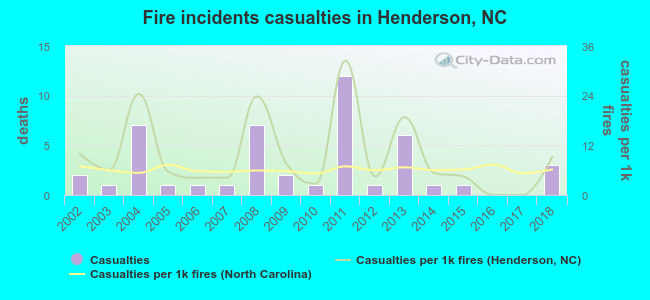 Based on the data from the years 2002 - 2018 the average number of fire-related yearly casualties is 3. The highest number of injuries - 12 took place in 2011, and the lowest - 0 in 2016. The data has an increasing trend.
The average number of casualties per 1,000 fire incidents is 10. This indicator was the highest - 32 in 2011, and the lowest 0 in 2016. The trend for casualties per 1,000 fire incidents is decreasing. Compared to the state value the number of casualties per 1,000 fires is higher.
Based on the data from the years 2002 - 2018 the average number of fire-related yearly casualties is 3. The highest number of injuries - 12 took place in 2011, and the lowest - 0 in 2016. The data has an increasing trend.
The average number of casualties per 1,000 fire incidents is 10. This indicator was the highest - 32 in 2011, and the lowest 0 in 2016. The trend for casualties per 1,000 fire incidents is decreasing. Compared to the state value the number of casualties per 1,000 fires is higher.Casualties per 1,000 incidents in Henderson, NC compared to nearest cities:
(Note: Based on data for all years, including only cities with at least 500 fire incidents)
| Henderson: | 10.7 |
| Oxford: | 0.0 |
| Franklinton: | 2.5 |
| Louisburg: | 3.0 |
| Creedmoor: | 8.9 |
| Youngsville: | 0.0 |
| Wake Forest: | 2.2 |
| Bunn: | 0.0 |
| Littleton: | 0.0 |
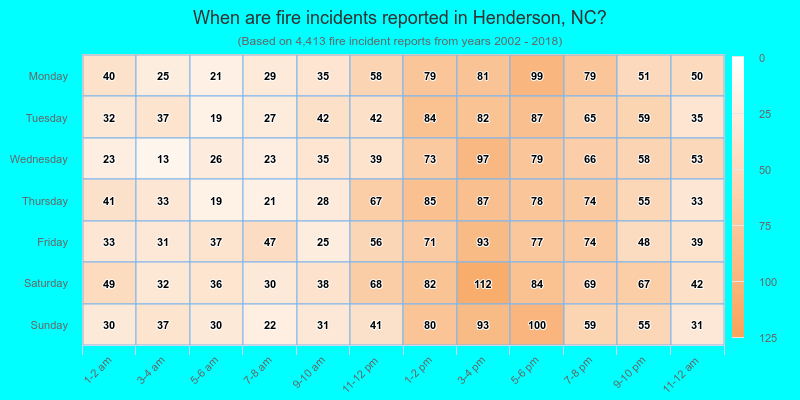
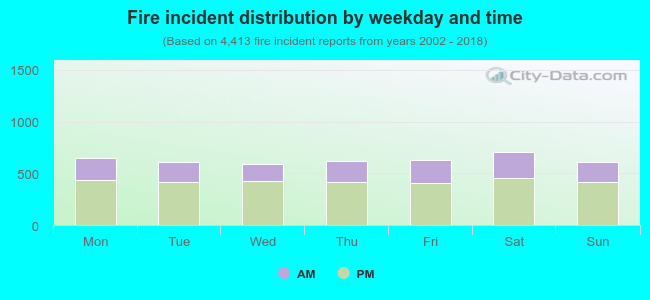 32.8% incidents where reported in the morning and 67.2% in the evening. The most fires (16.1%) took place on Saturday, and the least (13.3%) on Wednesday.
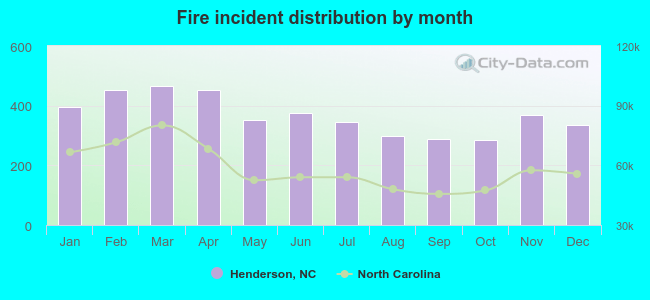 According to the 4,413 reports from years 2002 - 2018 most fires (10.6%) took place during March, and the least (6.5%) in October.
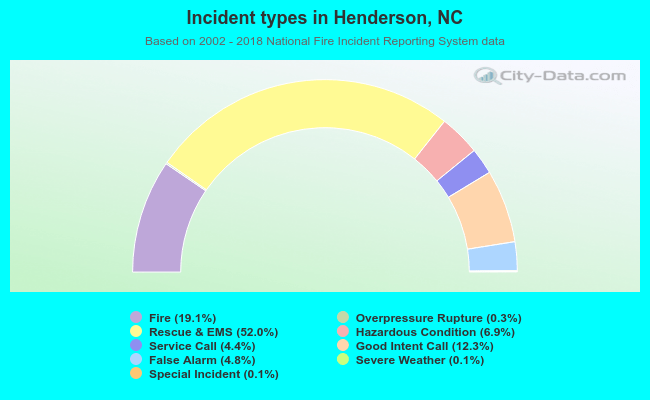 Out of all 23,156 cases reported during the years 2002 - 2018, the most belonged to the categories: Rescue & EMS (52.0%), Fire (19.1%), and Good Intent Call (12.3%).
 When looking into fire subcategories, the most incidents belonged to: Structure Fires (39.2%), and Outside Fires (36.6%).