Rocky Mount: Fire Incidents, North Carolina (NC)
Where are fire incidents reported in Rocky Mount, NC
Something went wrong! Please refresh the page.
| Fire incidents reported | |
|---|---|
| Sreet name | Count |
| SUNSET AVE | 468 |
| WESLEYAN BLVD | 322 |
| CHURCH ST | 164 |
| COKEY RD | 150 |
| HALIFAX RD | 132 |
| HUNTER HILL RD | 98 |
| BENVENUE RD | 92 |
| RALEIGH ST | 92 |
| OLD CARRIAGE RD | 90 |
| LEGGETT RD | 80 |
| THOMAS ST | 78 |
| WEST MOUNT DR | 76 |
| BRANCH ST | 74 |
| RALEIGH BLVD | 72 |
| ARLINGTON ST | 64 |
| ATLANTIC AVE | 64 |
| OLD WILSON RD | 64 |
| GRACE ST | 60 |
| MARIGOLD ST | 60 |
| RALEIGH RD | 56 |
| BULLUCK SCHOOL RD | 54 |
| NASHVILLE RD | 54 |
| PLEASANT HILL RD | 52 |
| WESTERN AVE | 52 |
| EASTERN AVE | 50 |
| PAUL ST | 50 |
| SYCAMORE ST | 50 |
| US64 HWY | 50 |
| HILL ST | 48 |
| PENDER ST | 48 |
| Other | 3,054 |
2002 - 2018 National Fire Incident Reporting System (NFIRS) incidents
- Incident types reported to NFIRS in Rocky Mount, NC
- 33,56363.9%Rescue & EMS
- 5,91811.3%Fire
- 4,5018.6%Hazardous Condition
- 3,4666.6%Good Intent Call
- 3,2776.2%False Alarm
- 1,6253.1%Service Call
- 1110.2%Overpressure Rupture
- Fire incident types reported to NFIRS in Rocky Mount, NC
- 2,62644.4%Structure Fires
- 2,27138.4%Outside Fires
- 91115.4%Mobile Property/Vehicle Fires
- 1101.9%Other
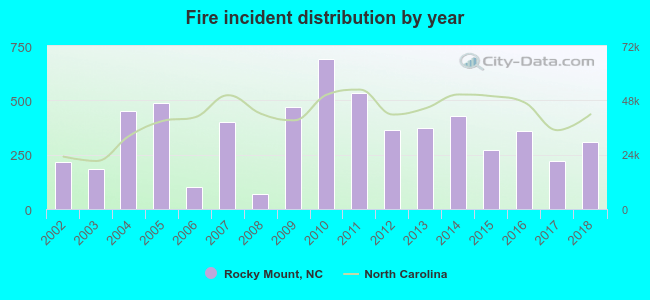 According to the data from the years 2002 - 2018 the average number of fires per year is 348. The highest number of fires - 688 took place in 2010, and the least - 70 in 2008. The data has a growing trend.
The average number of yearly fire incidents per 10k residents in Rocky Mount, NC compared to nearest cities:
(Note: Based on data for the last 3 years, including only cities with population 5,000 and above)
| Rocky Mount: | 52.5 |
| Nashville: | 157.4 |
| Tarboro: | 72.2 |
| Wilson: | 51.0 |
| Wendell: | 196.8 |
| Greenville: | 51.0 |
| Roanoke Rapids: | 47.1 |
| Rolesville: | 25.9 |
| Winterville: | 89.7 |
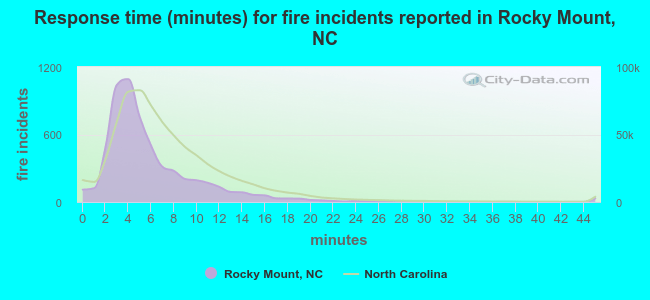 The median response time based on all reported fire incidents is 5 minutes. This is lower compared to the state median value.
The median response time in Rocky Mount, NC compared to nearest cities:
(Note: Based on data for all years, including only cities with at least 500 fire incidents)
| Rocky Mount: | 5 minutes |
| Nashville: | 9 minutes |
| Elm City: | 11 minutes |
| Whitakers: | 12 minutes |
| Tarboro: | 5 minutes |
| Wilson: | 5 minutes |
| Spring Hope: | 11 minutes |
| Enfield: | 11 minutes |
| Bailey: | 10 minutes |
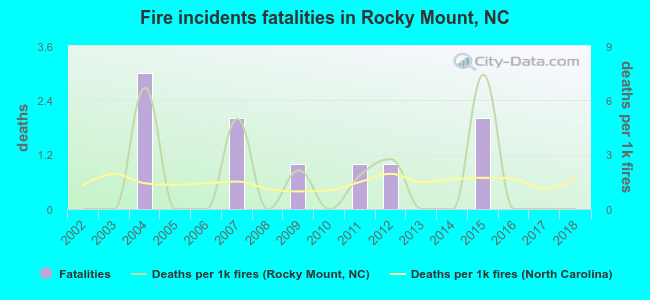 Based on the data from the years 2002 - 2018 the average number of fire-related fatalities per year is 1. The highest number of reported deaths - 3 took place in 2004, and the lowest - 0 in 2002. The data has a constant trend.
The average number of fatalities per 1,000 fires is 2. This indicator was the highest - 7 in 2015, and the lowest 0 in 2002. The trend for fatalities per 1,000 incidents is constant. Compared to the state value the number of fatalities per 1,000 incidents is similar.
Based on the data from the years 2002 - 2018 the average number of fire-related fatalities per year is 1. The highest number of reported deaths - 3 took place in 2004, and the lowest - 0 in 2002. The data has a constant trend.
The average number of fatalities per 1,000 fires is 2. This indicator was the highest - 7 in 2015, and the lowest 0 in 2002. The trend for fatalities per 1,000 incidents is constant. Compared to the state value the number of fatalities per 1,000 incidents is similar.Deaths per 1,000 incidents in Rocky Mount, NC compared to nearest cities:
(Note: Based on data for all years, including only cities with at least 2,500 fire incidents)
| Rocky Mount: | 1.7 |
| Wilson: | 1.9 |
| Greenville: | 1.8 |
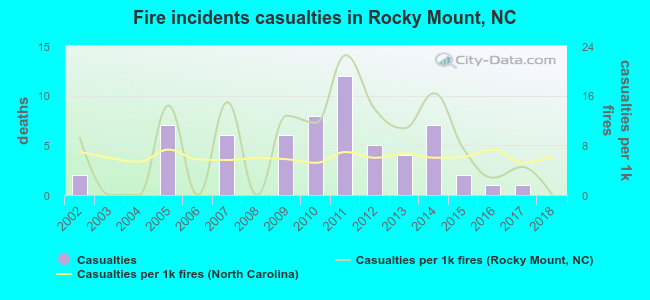 Based on the data from the years 2002 - 2018 the average number of fire-related yearly casualties is 4. The highest number of reported casualties - 12 took place in 2011, and the lowest - 0 in 2003. The data has a dropping trend.
The average number of injuries per 1,000 fires is 8. This indicator was the highest - 23 in 2011, and the lowest 0 in 2003. The trend for casualties per 1,000 incidents is decreasing. Compared to the state value the number of casualties per 1,000 fire incidents is higher.
Based on the data from the years 2002 - 2018 the average number of fire-related yearly casualties is 4. The highest number of reported casualties - 12 took place in 2011, and the lowest - 0 in 2003. The data has a dropping trend.
The average number of injuries per 1,000 fires is 8. This indicator was the highest - 23 in 2011, and the lowest 0 in 2003. The trend for casualties per 1,000 incidents is decreasing. Compared to the state value the number of casualties per 1,000 fire incidents is higher.
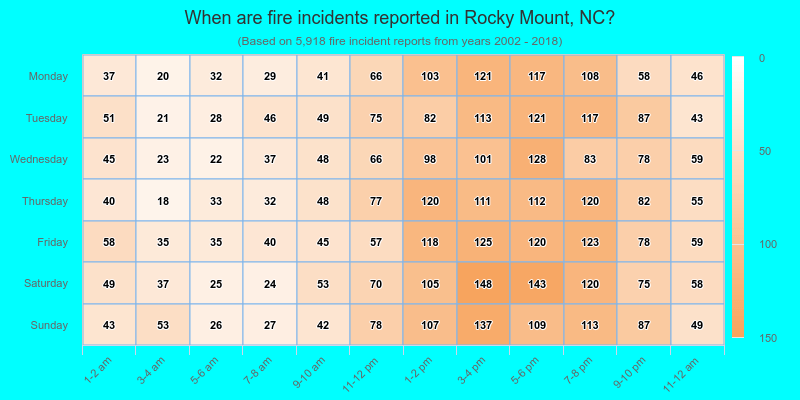
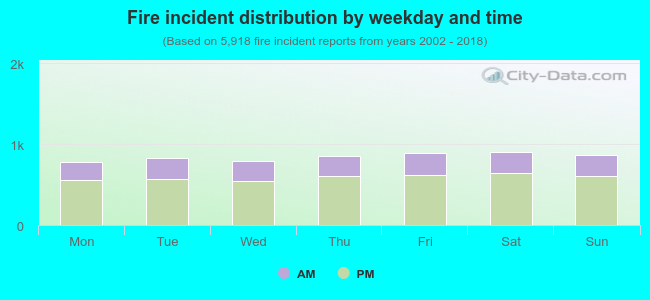 30.1% incidents where reported in the morning and 69.9% in the evening. The most fires (15.3%) took place on Saturday, and the least (13.1%) on Monday.
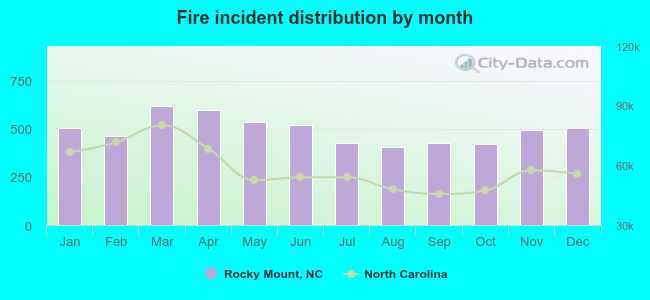 Based on the 5,918 fire incident reports from years 2002 - 2018 most fires (10.5%) took place during March, and the least (6.9%) in August.
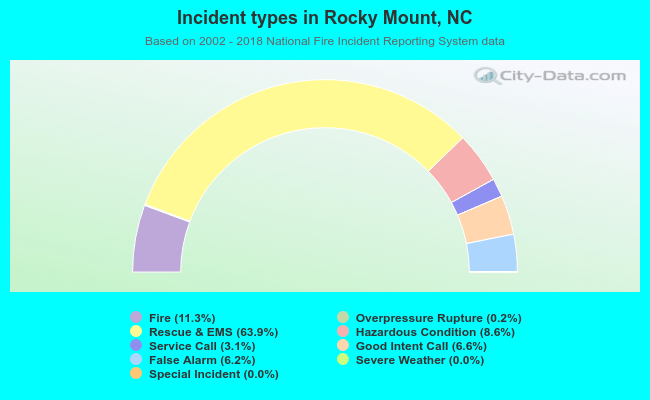 Out of all 52,484 cases reported during the years 2002 - 2018, the most belonged to the categories: Rescue & EMS (63.9%), Fire (11.3%), and Hazardous Condition (8.6%).
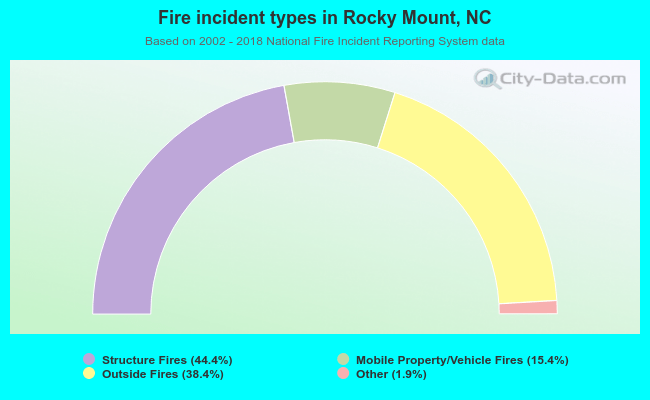 When looking into fire subcategories, the most reports belonged to: Structure Fires (44.4%), and Outside Fires (38.4%).