Wake Forest: Fire Incidents, North Carolina (NC)
Where are fire incidents reported in Wake Forest, NC
Something went wrong! Please refresh the page.
| Fire incidents reported | |
|---|---|
| Sreet name | Count |
| CAPITAL BLVD | 206 |
| MAIN ST | 162 |
| DURHAM RD | 150 |
| WAIT AVE | 88 |
| CREEDMOOR RD | 74 |
| FORESTVILLE RD | 68 |
| OLD WEAVER TRL | 58 |
| NEW LIGHT RD | 56 |
| FRANKLIN ST | 54 |
| WHITE ST | 52 |
| LIGON MILL RD | 50 |
| POWELL RD | 48 |
| JONES DAIRY RD | 46 |
| BURLINGTON MILLS RD | 44 |
| ROGERS RD | 44 |
| FALLS OF NEUSE RD | 40 |
| WOODLAND CHURCH RD | 40 |
| LOUISBURG RD | 38 |
| MITCHELL MILL RD | 38 |
| BOLD RUN HILL RD | 36 |
| BURLINGTON MILL RD | 34 |
| JONESVILLE RD | 34 |
| ALLEN RD | 32 |
| AVERETTE RD | 32 |
| CHALK RD | 32 |
| ZEBULON RD | 32 |
| RETAIL DR | 30 |
| LILLIE LILES RD | 28 |
| LOUISBURY RD | 28 |
| OAK GROVE CHURCH RD | 28 |
| Other | 1,066 |
2002 - 2018 National Fire Incident Reporting System (NFIRS) incidents
- Incident types reported to NFIRS in Wake Forest, NC
- 12,48253.0%Rescue & EMS
- 2,76811.8%Fire
- 2,56310.9%Good Intent Call
- 2,2359.5%False Alarm
- 2,1159.0%Hazardous Condition
- 1,2765.4%Service Call
- 560.2%Severe Weather
- 310.1%Overpressure Rupture
- Fire incident types reported to NFIRS in Wake Forest, NC
- 1,18842.9%Structure Fires
- 1,09539.6%Outside Fires
- 35112.7%Mobile Property/Vehicle Fires
- 1344.8%Other
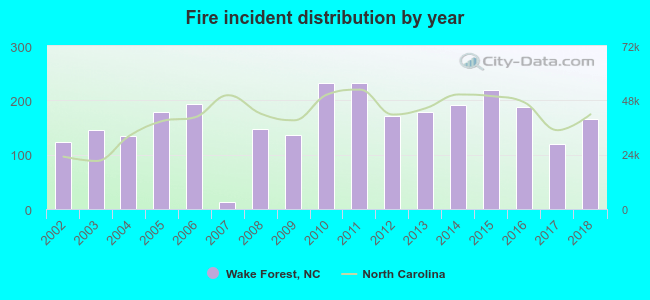 According to the data from the years 2002 - 2018 the average number of fire incidents per year is 163. The highest number of reported fire incidents - 232 took place in 2010, and the least - 12 in 2007. The data has an increasing trend.
The average number of yearly fire incidents per 10k residents in Wake Forest, NC compared to nearest cities:
(Note: Based on data for the last 3 years, including only cities with population 5,000 and above)
| Wake Forest: | 42.9 |
| Rolesville: | 25.9 |
| Knightdale: | 119.9 |
| Raleigh: | 24.8 |
| Wendell: | 196.8 |
| Butner: | 13.0 |
| Garner: | 53.3 |
| Morrisville: | 25.0 |
| Cary: | 16.8 |
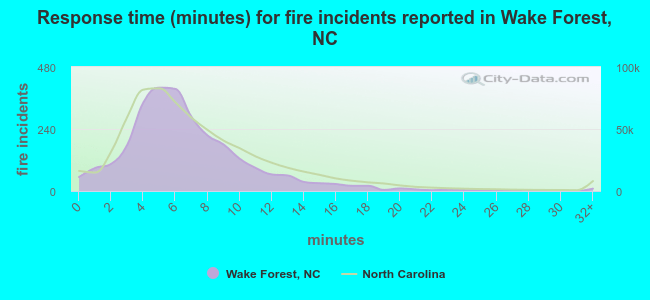 The median response time based on all reported fire incidents is 6 minutes. This is about the same as the state median value.
The median response time in Wake Forest, NC compared to nearest cities:
(Note: Based on data for all years, including only cities with at least 500 fire incidents)
| Wake Forest: | 6 minutes |
| Youngsville: | 9 minutes |
| Franklinton: | 9 minutes |
| Knightdale: | 5 minutes |
| Raleigh: | 5 minutes |
| Creedmoor: | 8 minutes |
| Bunn: | 8 minutes |
| Louisburg: | 7 minutes |
| Zebulon: | 6 minutes |
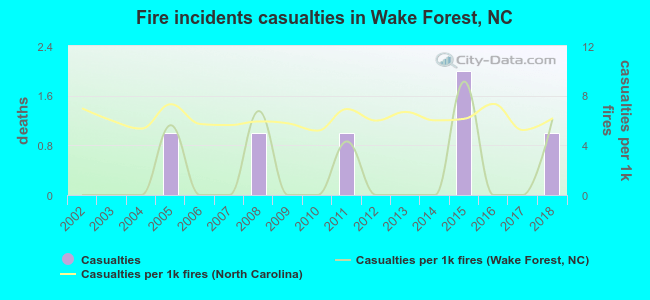 Based on the data from the years 2002 - 2018 the average number of fire-related yearly casualties is 0. The highest number of injuries - 2 took place in 2015, and the lowest - 0 in 2002. The data has an increasing trend.
The average number of casualties per 1,000 fires is 2. This indicator was the highest - 9 in 2015, and the lowest 0 in 2002. The trend for casualties per 1,000 incidents is increasing. Compared to the North Carolina value the number of injuries per 1,000 fire incidents is much lower.
Based on the data from the years 2002 - 2018 the average number of fire-related yearly casualties is 0. The highest number of injuries - 2 took place in 2015, and the lowest - 0 in 2002. The data has an increasing trend.
The average number of casualties per 1,000 fires is 2. This indicator was the highest - 9 in 2015, and the lowest 0 in 2002. The trend for casualties per 1,000 incidents is increasing. Compared to the North Carolina value the number of injuries per 1,000 fire incidents is much lower.Casualties per 1,000 incidents in Wake Forest, NC compared to nearest cities:
(Note: Based on data for all years, including only cities with at least 500 fire incidents)
| Wake Forest: | 2.2 |
| Youngsville: | 0.0 |
| Franklinton: | 2.5 |
| Knightdale: | 12.1 |
| Raleigh: | 7.0 |
| Creedmoor: | 8.9 |
| Bunn: | 0.0 |
| Louisburg: | 3.0 |
| Zebulon: | 2.6 |
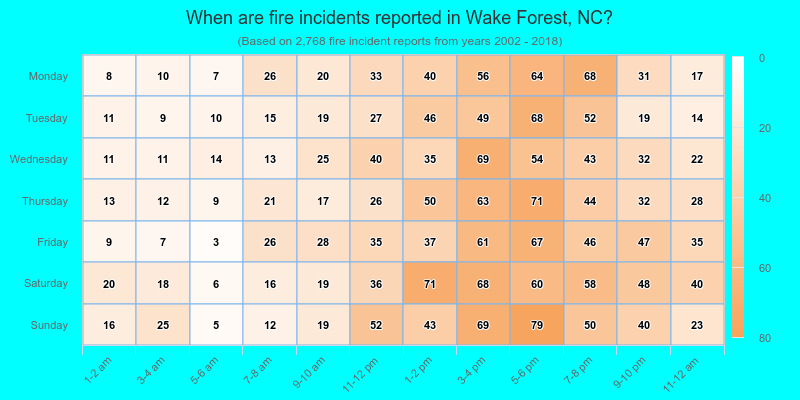
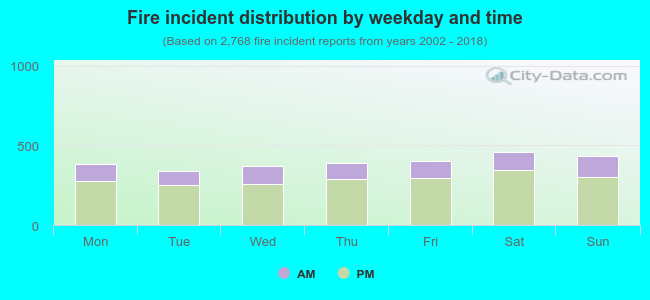 27.4% incidents where reported in the morning and 72.6% in the evening. The most fires (16.6%) took place on Saturday, and the least (12.2%) on Tuesday.
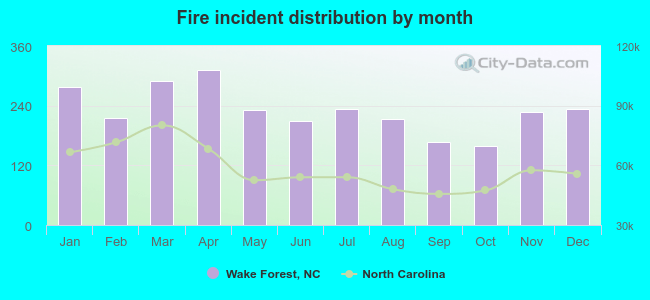 According to the 2,768 fire incidents from years 2002 - 2018 most fires (11.3%) took place during April, and the least (5.7%) in October.
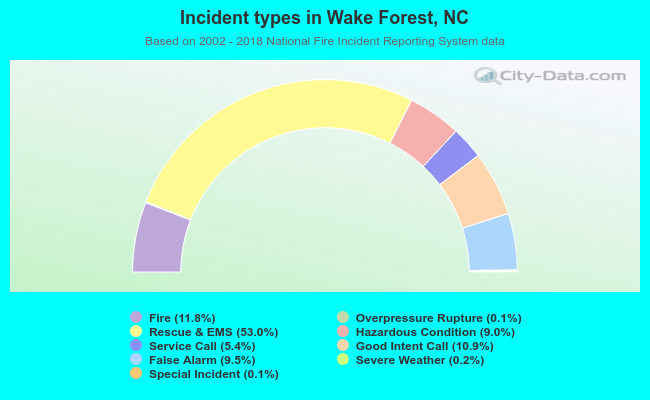 Out of all 23,547 cases reported during the years 2002 - 2018, the most belonged to the categories: Rescue & EMS (53.0%), Fire (11.8%), and Good Intent Call (10.9%).
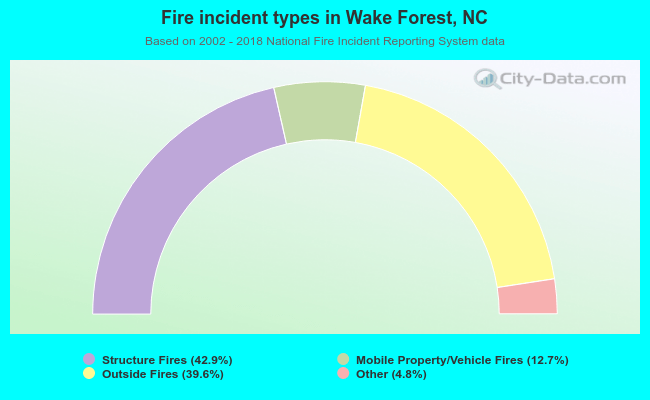 When looking into fire subcategories, the most reports belonged to: Structure Fires (42.9%), and Outside Fires (39.6%).