Florissant: Fire Incidents, Missouri (MO)
Where are fire incidents reported in Florissant, MO
Something went wrong! Please refresh the page.
| Fire incidents reported | |
|---|---|
| Sreet name | Count |
| NEW HALLS FERRY RD | 306 |
| NORTH HIGHWAY 67 | 170 |
| DUNN RD | 152 |
| CHARBONIER RD | 136 |
| SUGAR PINE DR | 116 |
| SANTIAGO DR | 110 |
| SHACKELFORD RD | 106 |
| WEST FLORISSANT AVE | 106 |
| HIGHWAY 67 | 96 |
| OLD HALLS FERRY RD | 90 |
| HWY 67 | 88 |
| DERHAKE RD | 76 |
| GRANDVIEW PLZ | 76 |
| PARKER RD | 72 |
| CROSS KEYS DR | 70 |
| WASHINGTON ST | 68 |
| GREENWAY MANOR DR | 64 |
| OLD JAMESTOWN RD | 62 |
| WATERFORD DR | 62 |
| HOWDERSHELL RD | 58 |
| HIGHWAY 67 ST | 54 |
| THOMPSON DR | 54 |
| SUMMER RUN DR | 52 |
| KINGSFORD DR | 50 |
| GRAHAM RD | 46 |
| NEW FLORISSANT SOUTH | 46 |
| SUGAR PINES CT | 44 |
| CENTRAL PKY | 42 |
| NORTHPORT HILLS DR | 42 |
| NEW FLORISSANT RD | 40 |
| Other | 2,687 |
2002 - 2018 National Fire Incident Reporting System (NFIRS) incidents
- Incident types reported to NFIRS in Florissant, MO
- 19,42249.5%Rescue & EMS
- 6,20015.8%Hazardous Condition
- 5,24113.4%Fire
- 3,2928.4%Service Call
- 3,1678.1%Good Intent Call
- 1,8034.6%False Alarm
- 530.1%Overpressure Rupture
- Fire incident types reported to NFIRS in Florissant, MO
- 2,13640.8%Structure Fires
- 1,59430.4%Outside Fires
- 82315.7%Other
- 68813.1%Mobile Property/Vehicle Fires
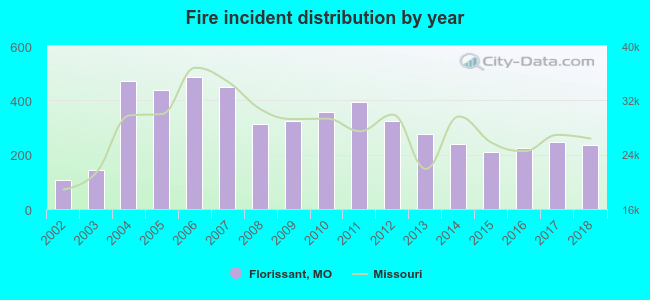 According to the data from the years 2002 - 2018 the average number of fires per year is 308. The highest number of fire incidents - 485 took place in 2006, and the least - 108 in 2002. The data has a rising trend.
The average number of yearly fire incidents per 10k residents in Florissant, MO compared to nearest cities:
(Note: Based on data for the last 3 years, including only cities with population 5,000 and above)
| Florissant: | 45.0 |
| Hazelwood: | 29.2 |
| Black Jack: | 7.2 |
| Berkeley: | 76.3 |
| Dellwood: | 51.9 |
| Ferguson: | 75.6 |
| Bridgeton: | 76.7 |
| Spanish Lake: | 8.7 |
| Jennings: | 83.5 |
 The median response time based on all reported fire incidents is 5 minutes. This is lower than the state median value.
The median response time in Florissant, MO compared to nearest cities:
(Note: Based on data for all years, including only cities with at least 500 fire incidents)
| Florissant: | 5 minutes |
| Hazelwood: | 6 minutes |
| Berkeley: | 4 minutes |
| Ferguson: | 4 minutes |
| Bridgeton: | 5 minutes |
| Normandy: | 6 minutes |
| Spanish Lake: | 7 minutes |
| Jennings: | 4 minutes |
| Riverview: | 5 minutes |
 According to the reports from the years 2002 - 2018 the average number of fire-related fatalities per year is 1. The highest number of reported deaths - 2 took place in 2006, and the lowest - 0 in 2002. The data has an increasing trend.
The average number of deaths per 1,000 fires is 2. This indicator was the highest - 6 in 2012, and the lowest 0 in 2002. The trend for deaths per 1,000 fires is increasing. Compared to the Missouri value the number of fatalities per 1,000 fire incidents is similar.
According to the reports from the years 2002 - 2018 the average number of fire-related fatalities per year is 1. The highest number of reported deaths - 2 took place in 2006, and the lowest - 0 in 2002. The data has an increasing trend.
The average number of deaths per 1,000 fires is 2. This indicator was the highest - 6 in 2012, and the lowest 0 in 2002. The trend for deaths per 1,000 fires is increasing. Compared to the Missouri value the number of fatalities per 1,000 fire incidents is similar.Deaths per 1,000 incidents in Florissant, MO compared to nearest cities:
(Note: Based on data for all years, including only cities with at least 2,500 fire incidents)
| Florissant: | 1.7 |
| Alton: | 2.7 |
| Granite City: | 2.0 |
| St. Louis: | 0.8 |
 According to the reports from the years 2002 - 2018 the average number of fire-related yearly casualties is 2. The highest number of reported injuries - 13 took place in 2003, and the lowest - 0 in 2004. The data has a decreasing trend.
The average number of casualties per 1,000 fire incidents is 11. This indicator was the highest - 92 in 2003, and the lowest 0 in 2004. The trend for injuries per 1,000 fire incidents is declining. Compared to the Missouri value the number of casualties per 1,000 incidents is higher.
According to the reports from the years 2002 - 2018 the average number of fire-related yearly casualties is 2. The highest number of reported injuries - 13 took place in 2003, and the lowest - 0 in 2004. The data has a decreasing trend.
The average number of casualties per 1,000 fire incidents is 11. This indicator was the highest - 92 in 2003, and the lowest 0 in 2004. The trend for injuries per 1,000 fire incidents is declining. Compared to the Missouri value the number of casualties per 1,000 incidents is higher.
 30.2% incidents where reported in the morning and 69.8% in the evening. The most fires (16.7%) took place on Sunday, and the least (13.2%) on Thursday.
 Based on the 5,241 reports from years 2002 - 2018 most fires (11.2%) took place during March, and the least (7.4%) in January.
 Out of all 39,212 cases reported during the years 2002 - 2018, the most belonged to the categories: Rescue & EMS (49.5%), Hazardous Condition (15.8%), and Fire (13.4%).
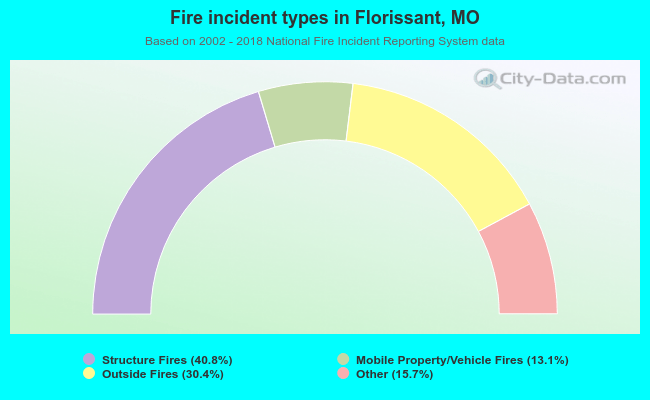 When looking into fire subcategories, the most reports belonged to: Structure Fires (40.8%), and Outside Fires (30.4%).