Spanish Lake: Fire Incidents, Missouri (MO)
Where are fire incidents reported in Spanish Lake, MO
Something went wrong! Please refresh the page.
|
| |||||||||||||||||||||||||||||||||||||||||||||||||||||||||||||||||||||||||||||||||||||||||||||||||||||||||||||
| Other | 55 | |||||||||||||||||||||||||||||||||||||||||||||||||||||||||||||||||||||||||||||||||||||||||||||||||||||||||||||
2002 - 2018 National Fire Incident Reporting System (NFIRS) incidents
- Incident types reported to NFIRS in Spanish Lake, MO
- 59743.1%Fire
- 36026.0%Good Intent Call
- 23717.1%Service Call
- 16111.6%Hazardous Condition
- 201.4%Rescue & EMS
- 60.4%False Alarm
- 40.3%Overpressure Rupture
- Fire incident types reported to NFIRS in Spanish Lake, MO
- 38063.7%Structure Fires
- 16327.3%Other
- 305.0%Outside Fires
- 244.0%Mobile Property/Vehicle Fires
 Based on the data from the years 2002 - 2018 the average number of fire incidents per year is 35. The highest number of reported fire incidents - 92 took place in 2006, and the least - 10 in 2014. The data has a decreasing trend.
The average number of yearly fire incidents per 10k residents in Spanish Lake, MO compared to nearest cities:
(Note: Based on data for the last 3 years, including only cities with population 5,000 and above)
| Spanish Lake: | 8.7 |
| Glasgow Village: | 7.4 |
| Black Jack: | 7.2 |
| Dellwood: | 51.9 |
| Jennings: | 83.5 |
| Ferguson: | 75.6 |
| Florissant: | 45.0 |
| Berkeley: | 76.3 |
| Hazelwood: | 29.2 |
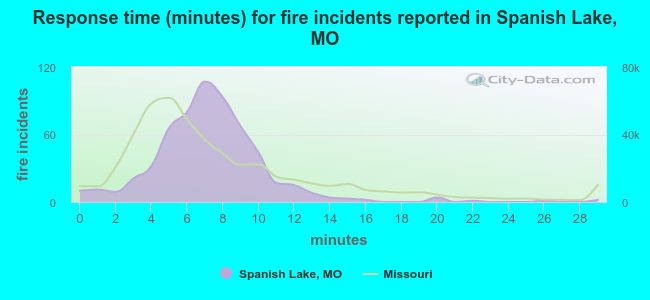 The median response time based on all reported fire incidents is 7 minutes. This is similar to the Missouri median value.
The median response time in Spanish Lake, MO compared to nearest cities:
(Note: Based on data for all years, including only cities with at least 500 fire incidents)
| Spanish Lake: | 7 minutes |
| Riverview: | 5 minutes |
| Jennings: | 4 minutes |
| Ferguson: | 4 minutes |
| Florissant: | 5 minutes |
| Granite City: | 3 minutes |
| Normandy: | 6 minutes |
| Berkeley: | 4 minutes |
| Madison: | 6 minutes |
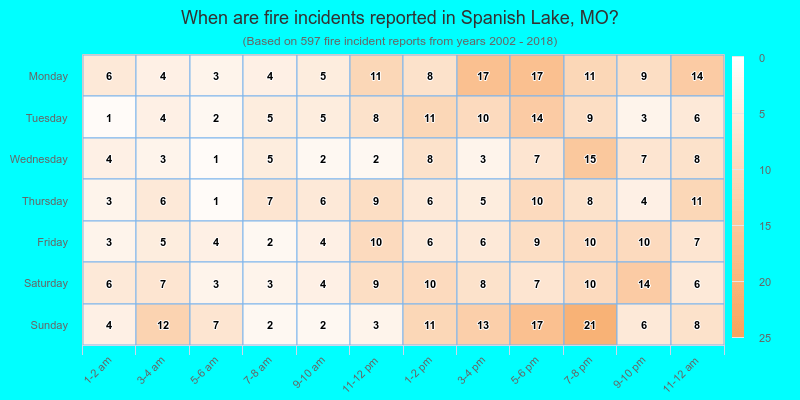
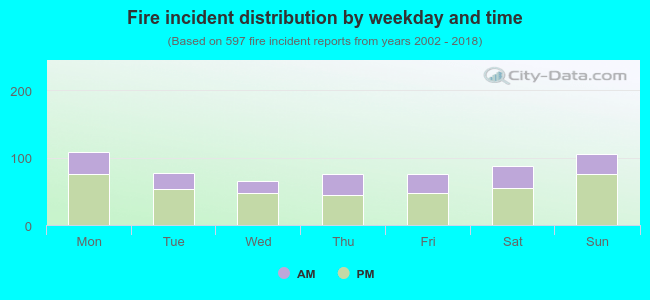 33.0% incidents where reported in the morning and 67.0% in the evening. The most fires (18.3%) took place on Monday, and the least (10.9%) on Wednesday.
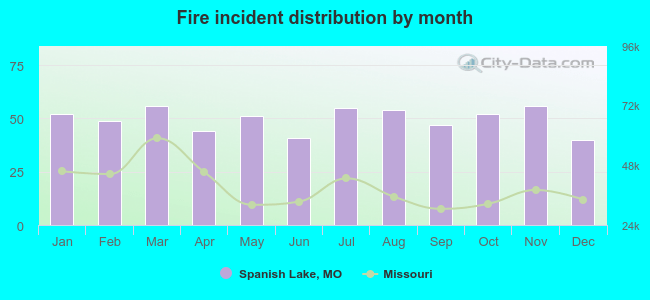 According to the 597 fire incidents from years 2002 - 2018 most fires (9.4%) took place during March, and the least (6.7%) in December.
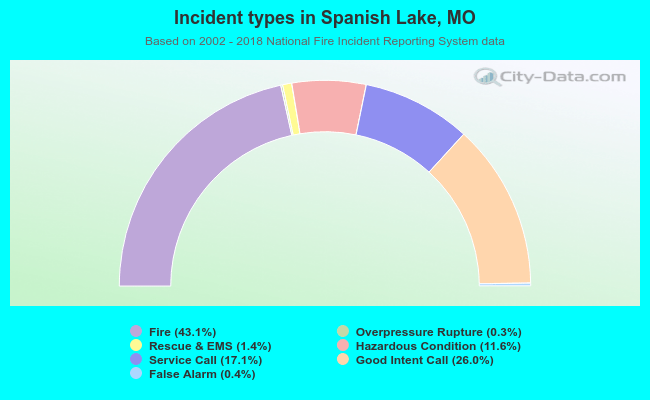 Out of all 1,385 cases reported during the years 2002 - 2018, the most belonged to the categories: Fire (43.1%), Good Intent Call (26.0%), and Service Call (17.1%).
 When looking into fire subcategories, the most reports belonged to: Structure Fires (63.7%), and Other (27.3%).