Bridgeton: Fire Incidents, Missouri (MO)
Where are fire incidents reported in Bridgeton, MO
Something went wrong! Please refresh the page.
| Fire incidents reported | |
|---|---|
| Sreet name | Count |
| ST. CHARLES ROCK RD | 206 |
| ST CHARLES ROCK RD | 182 |
| I-70 | 88 |
| NATURAL BRIDGE RD | 66 |
| LINDBERGH BLVD | 62 |
| LONE EAGLE DR | 52 |
| MISSOURI BOTTOM RD | 50 |
| PENNRIDGE DR | 44 |
| DEPAUL DR | 40 |
| ST CHARLES ROCK | 40 |
| BRITTANY CIR | 36 |
| FEE FEE RD | 34 |
| HWY 70 | 30 |
| RIDERTRAIL | 26 |
| I 270 NB | 24 |
| LINDBERGH BLVD N NB | 22 |
| MCKELVEY RD | 22 |
| BEAVERTON DR | 20 |
| CORPORATE WOODS DR | 20 |
| I-270 | 20 |
| MARGATEHALL DR | 20 |
| GARDENVIEW DR | 18 |
| HIGHWAY 370 WEST BOUND | 18 |
| TAUSSIG RD | 18 |
| HIGHWAY 370 EB | 16 |
| LINDBERGH | 16 |
| MONTER | 16 |
| PENNRIDGE | 16 |
| CARROLLTON CT | 14 |
| EARTH CITY EXPY | 14 |
| Other | 82 |
2002 - 2018 National Fire Incident Reporting System (NFIRS) incidents
- Incident types reported to NFIRS in Bridgeton, MO
- 10,98265.9%Rescue & EMS
- 1,5779.5%False Alarm
- 1,3328.0%Fire
- 1,1076.6%Hazardous Condition
- 1,0996.6%Good Intent Call
- 5173.1%Service Call
- 370.2%Overpressure Rupture
- Fire incident types reported to NFIRS in Bridgeton, MO
- 41331.0%Outside Fires
- 40730.6%Structure Fires
- 34025.5%Mobile Property/Vehicle Fires
- 17212.9%Other
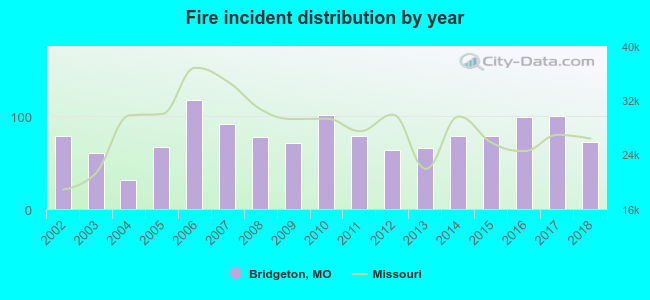 Based on the data from the years 2002 - 2018 the average number of fires per year is 78. The highest number of fires - 117 took place in 2006, and the least - 31 in 2004. The data has a declining trend.
The average number of yearly fire incidents per 10k residents in Bridgeton, MO compared to nearest cities:
(Note: Based on data for the last 3 years, including only cities with population 5,000 and above)
| Bridgeton: | 76.7 |
| Maryland Heights: | 36.6 |
| Hazelwood: | 29.2 |
| Berkeley: | 76.3 |
| Overland: | 19.6 |
| Florissant: | 45.0 |
| Olivette: | 45.9 |
| Creve Coeur: | 24.3 |
| Ferguson: | 75.6 |
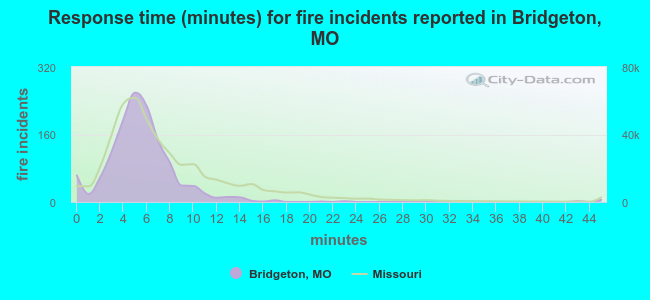 The median response time based on all reported fire incidents is 5 minutes. This is lower than the state median value.
The median response time in Bridgeton, MO compared to nearest cities:
(Note: Based on data for all years, including only cities with at least 500 fire incidents)
| Bridgeton: | 5 minutes |
| Maryland Heights: | 5 minutes |
| Hazelwood: | 6 minutes |
| Berkeley: | 4 minutes |
| Overland: | 5 minutes |
| St. Charles: | 6 minutes |
| Florissant: | 5 minutes |
| Olivette: | 5 minutes |
| Creve Coeur: | 6 minutes |
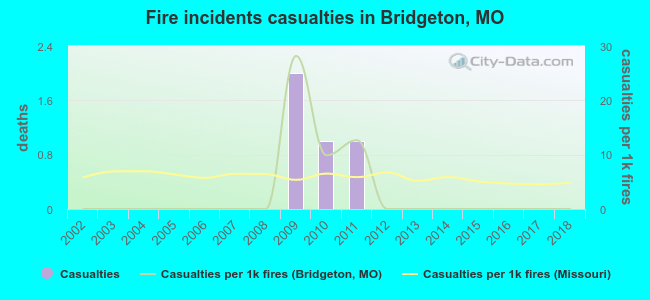 According to the data from the years 2002 - 2018 the average number of fire-related yearly casualties is 0. The highest number of reported injuries - 2 took place in 2009, and the lowest - 0 in 2002. The data has a constant trend.
The average number of injuries per 1,000 fires is 3. This indicator was the highest - 28 in 2009, and the lowest 0 in 2002. The trend for injuries per 1,000 fire incidents is decreasing. Compared to the Missouri value the number of casualties per 1,000 fires is lower.
According to the data from the years 2002 - 2018 the average number of fire-related yearly casualties is 0. The highest number of reported injuries - 2 took place in 2009, and the lowest - 0 in 2002. The data has a constant trend.
The average number of injuries per 1,000 fires is 3. This indicator was the highest - 28 in 2009, and the lowest 0 in 2002. The trend for injuries per 1,000 fire incidents is decreasing. Compared to the Missouri value the number of casualties per 1,000 fires is lower.Casualties per 1,000 incidents in Bridgeton, MO compared to nearest cities:
(Note: Based on data for all years, including only cities with at least 500 fire incidents)
| Bridgeton: | 3.0 |
| Maryland Heights: | 4.0 |
| Hazelwood: | 0.0 |
| Berkeley: | 12.4 |
| Overland: | 3.6 |
| St. Charles: | 8.3 |
| Florissant: | 7.1 |
| Olivette: | 5.4 |
| Creve Coeur: | 6.4 |
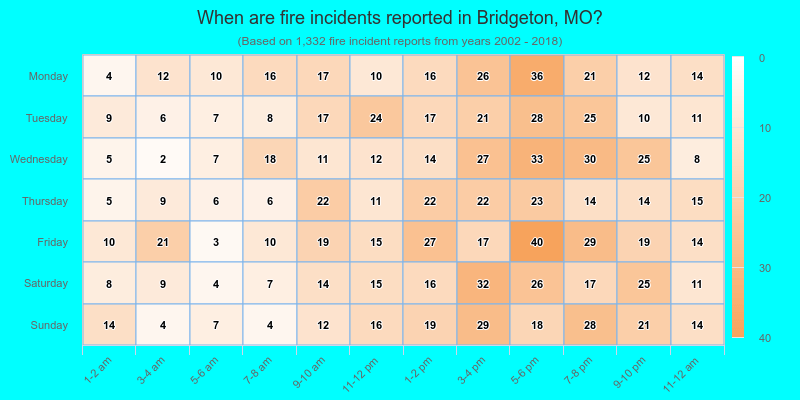
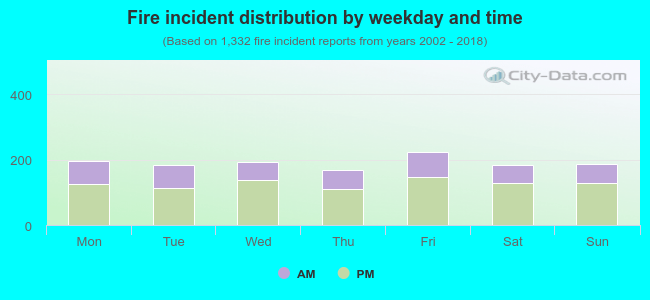 33.5% incidents where reported in the morning and 66.5% in the evening. The most fires (16.8%) took place on Friday, and the least (12.7%) on Thursday.
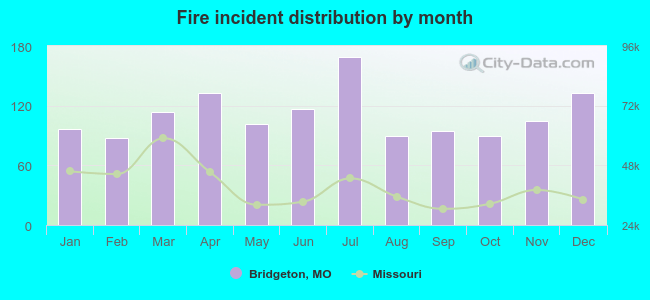 Based on the 1,332 fires from years 2002 - 2018 most fires (12.7%) took place during July, and the least (6.5%) in February.
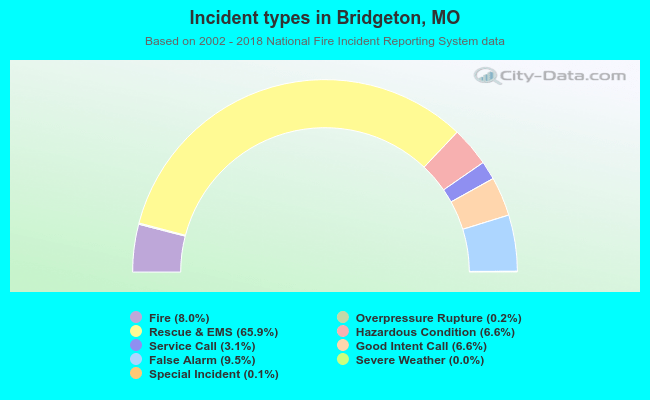 Out of all 16,665 cases reported during the years 2002 - 2018, the most belonged to the categories: Rescue & EMS (65.9%), False Alarm (9.5%), and Fire (8.0%).
 When looking into fire subcategories, the most incidents belonged to: Outside Fires (31.0%), and Structure Fires (30.6%).