Danville: Fire Incidents, Indiana (IN)
Where are fire incidents reported in Danville, IN
Something went wrong! Please refresh the page.
|
| |||||||||||||||||||||||||||||||||||||||||||||||||||||||||||||||||||||||||||||||||||||||||||||||||||||||||||||
| Other | 30 | |||||||||||||||||||||||||||||||||||||||||||||||||||||||||||||||||||||||||||||||||||||||||||||||||||||||||||||
2002 - 2018 National Fire Incident Reporting System (NFIRS) incidents
- Incident types reported to NFIRS in Danville, IN
- 3,76756.0%Rescue & EMS
- 1,08616.1%Fire
- 6539.7%Hazardous Condition
- 6339.4%Good Intent Call
- 3565.3%Service Call
- 2053.0%False Alarm
- 150.2%Severe Weather
- 80.1%Overpressure Rupture
- 70.1%Special Incident
- Fire incident types reported to NFIRS in Danville, IN
- 49245.3%Structure Fires
- 38835.7%Outside Fires
- 11610.7%Mobile Property/Vehicle Fires
- 908.3%Other
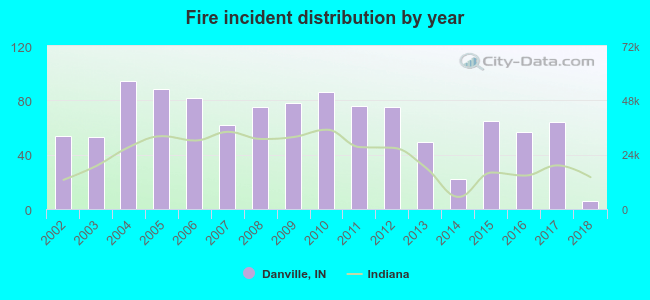 Based on the data from the years 2002 - 2018 the average number of fire incidents per year is 64. The highest number of reported fire incidents - 94 took place in 2004, and the least - 6 in 2018. The data has a decreasing trend.
The average number of yearly fire incidents per 10k residents in Danville, IN compared to nearest cities:
(Note: Based on data for the last 3 years, including only cities with population 5,000 and above)
| Danville: | 44.1 |
| Avon: | 44.2 |
| Plainfield: | 9.8 |
| Brownsburg: | 19.2 |
| Mooresville: | 102.3 |
| Speedway: | 40.2 |
| Whitestown: | 40.6 |
| Zionsville: | 16.1 |
| Greencastle: | 44.4 |
 The median response time based on all reported fire incidents is 8 minutes. This is higher compared to the state median value.
The median response time in Danville, IN compared to nearest cities:
(Note: Based on data for all years, including only cities with at least 500 fire incidents)
| Danville: | 8 minutes |
| Clayton: | 10 minutes |
| Avon: | 7 minutes |
| Plainfield: | 6 minutes |
| Brownsburg: | 6 minutes |
| Mooresville: | 6 minutes |
| Zionsville: | 6 minutes |
| Greencastle: | 9 minutes |
| Indianapolis: | 6 minutes |
 28.1% incidents where reported in the morning and 71.9% in the evening. The most fires (17.0%) took place on Sunday, and the least (12.2%) on Friday.
 Based on the 1,086 fire incidents from years 2002 - 2018 most fires (10.7%) took place during March, and the least (6.4%) in January.
 Out of all 6,730 cases reported during the years 2002 - 2018, the most belonged to the categories: Rescue & EMS (56.0%), Fire (16.1%), and Hazardous Condition (9.7%).
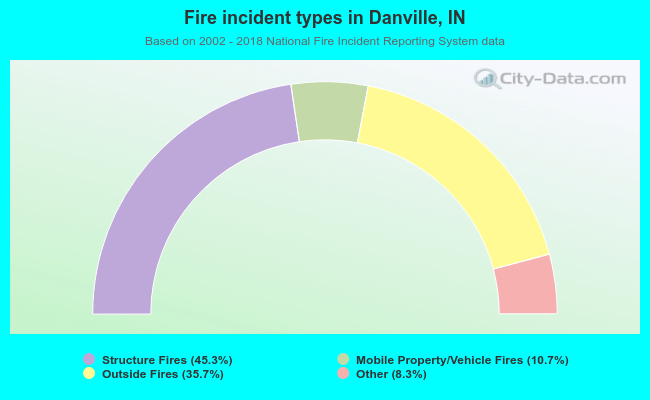 When looking into fire subcategories, the most incidents belonged to: Structure Fires (45.3%), and Outside Fires (35.7%).