Zionsville: Fire Incidents, Indiana (IN)
Where are fire incidents reported in Zionsville, IN
Something went wrong! Please refresh the page.
| Fire incidents reported | |
|---|---|
| Sreet name | Count |
| US 421 | 96 |
| 300 | 60 |
| FORD RD | 56 |
| SR 334 | 48 |
| SR 32 | 46 |
| OAK ST | 44 |
| I-65 | 38 |
| 875 | 36 |
| 975 | 34 |
| 200 | 30 |
| I65 | 30 |
| INDIANAPOLIS RD | 30 |
| HUNT CLUB RD | 28 |
| I865 | 28 |
| ZIONSVILLE RD | 28 |
| 106 TH ST | 24 |
| 100 | 22 |
| 1200 | 22 |
| 96 TH ST | 22 |
| WHITESTOWN RD | 22 |
| 1100 | 20 |
| 700 | 20 |
| 800 | 20 |
| MAIN ST | 20 |
| WILLOW RD | 20 |
| 550 | 18 |
| 950 | 18 |
| MICHIGAN RD | 18 |
| 6 TH ST | 16 |
| MULBERRY ST | 16 |
| Other | 230 |
2002 - 2017 National Fire Incident Reporting System (NFIRS) incidents
- Incident types reported to NFIRS in Zionsville, IN
- 2,38837.7%Rescue & EMS
- 1,16018.3%Fire
- 92214.6%Hazardous Condition
- 73311.6%False Alarm
- 5498.7%Service Call
- 5448.6%Good Intent Call
- 240.4%Severe Weather
- 160.3%Overpressure Rupture
- Fire incident types reported to NFIRS in Zionsville, IN
- 55347.7%Outside Fires
- 42736.8%Structure Fires
- 15513.4%Mobile Property/Vehicle Fires
- 252.2%Other
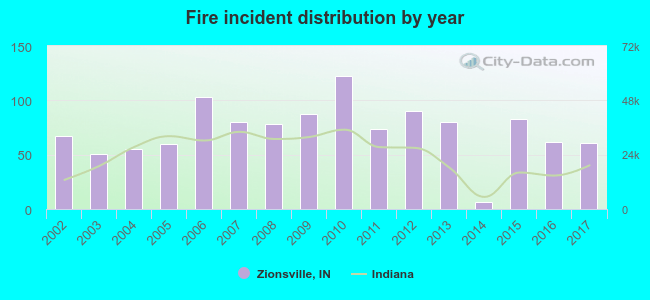 Based on the data from the years 2002 - 2017 the average number of fire incidents per year is 72. The highest number of fire incidents - 122 took place in 2010, and the least - 6 in 2014. The data has a declining trend.
The average number of yearly fire incidents per 10k residents in Zionsville, IN compared to nearest cities:
(Note: Based on data for the last 3 years, including only cities with population 5,000 and above)
| Zionsville: | 16.1 |
| Whitestown: | 40.6 |
| Carmel: | 2.9 |
| Westfield: | 17.8 |
| Brownsburg: | 19.2 |
| Speedway: | 40.2 |
| Lebanon: | 10.9 |
| Indianapolis: | 5.2 |
| Fishers: | 4.8 |
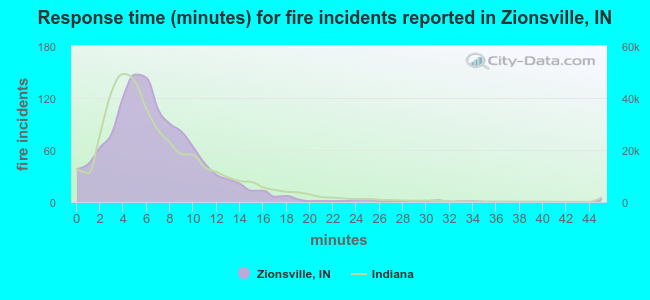 The median response time based on all reported fire incidents is 6 minutes. This is comparable to the state median value.
The median response time in Zionsville, IN compared to nearest cities:
(Note: Based on data for all years, including only cities with at least 500 fire incidents)
| Zionsville: | 6 minutes |
| Carmel: | 6 minutes |
| Westfield: | 7 minutes |
| Brownsburg: | 6 minutes |
| Lebanon: | 5 minutes |
| Sheridan: | 8 minutes |
| Indianapolis: | 6 minutes |
| Fishers: | 6 minutes |
| Avon: | 7 minutes |
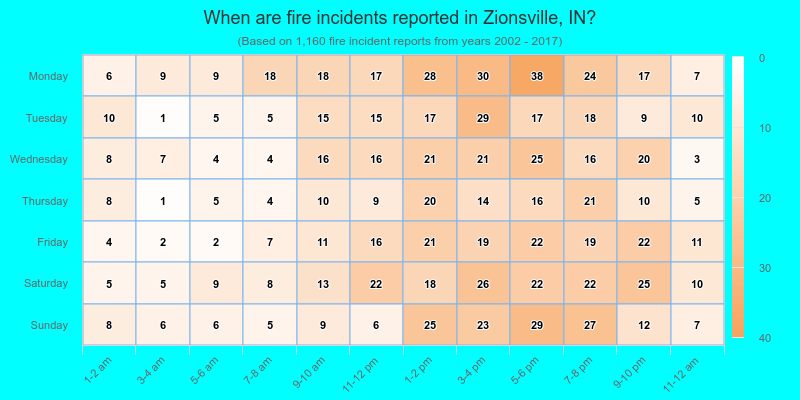
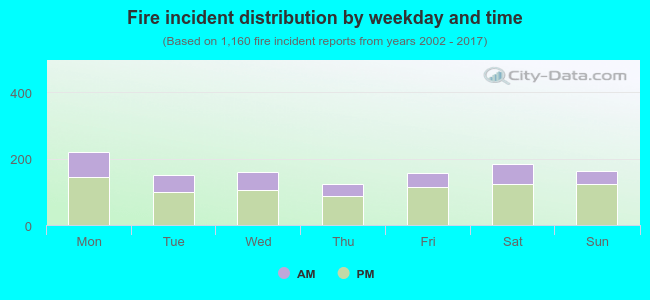 31.4% incidents where reported in the morning and 68.6% in the evening. The most fires (19.1%) took place on Monday, and the least (10.6%) on Thursday.
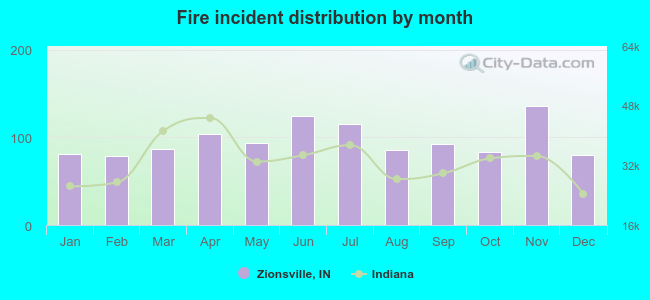 According to the 1,160 fire incident reports from years 2002 - 2017 most fires (11.7%) took place during November, and the least (6.8%) in February.
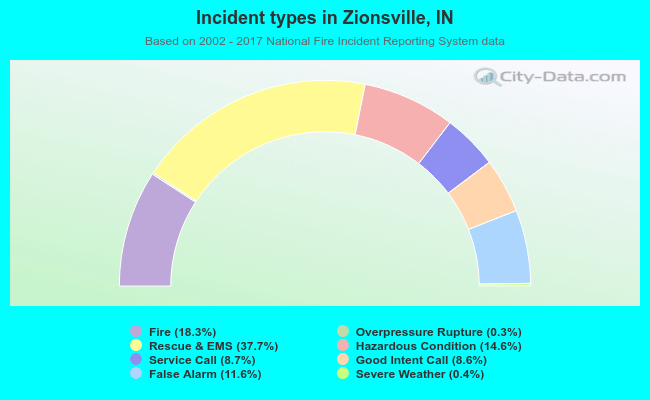 Out of all 6,336 cases reported during the years 2002 - 2017, the most belonged to the categories: Rescue & EMS (37.7%), Fire (18.3%), and Hazardous Condition (14.6%).
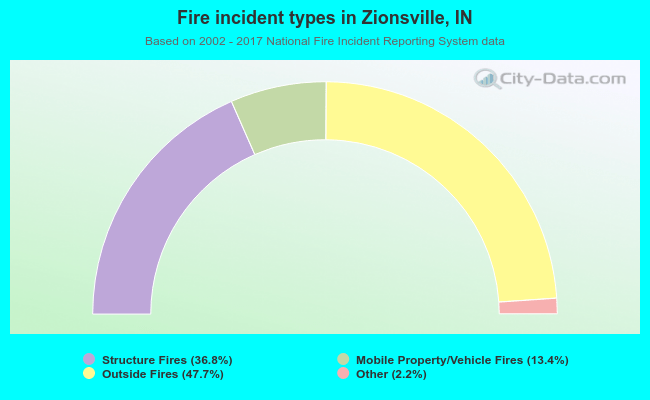 When looking into fire subcategories, the most incidents belonged to: Outside Fires (47.7%), and Structure Fires (36.8%).