Speedway: Fire Incidents, Indiana (IN)
Where are fire incidents reported in Speedway, IN
Something went wrong! Please refresh the page.
|
| |||||||||||||||||||||||||||||||||||||||||||||||||||||||||||||||||||||||||||||||||||||||||||||||||||||||||||||
2005 - 2018 National Fire Incident Reporting System (NFIRS) incidents
- Incident types reported to NFIRS in Speedway, IN
- 3,64268.6%Rescue & EMS
- 4909.2%Fire
- 4097.7%Hazardous Condition
- 3155.9%Good Intent Call
- 2063.9%Special Incident
- 1272.4%False Alarm
- 1132.1%Service Call
- Fire incident types reported to NFIRS in Speedway, IN
- 24349.6%Structure Fires
- 16333.3%Outside Fires
- 6413.1%Mobile Property/Vehicle Fires
- 204.1%Other
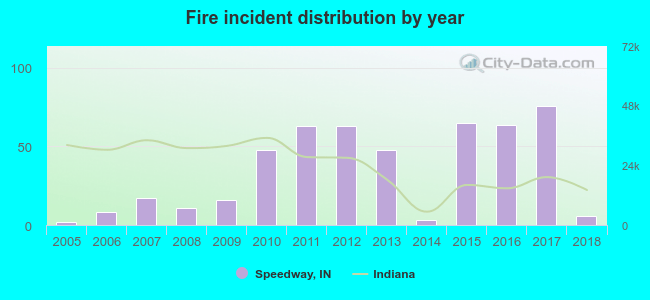 Based on the data from the years 2005 - 2018 the average number of fire incidents per year is 35. The highest number of fires - 76 took place in 2017, and the least - 2 in 2005. The data has a rising trend.
The average number of yearly fire incidents per 10k residents in Speedway, IN compared to nearest cities:
(Note: Based on data for the last 3 years, including only cities with population 5,000 and above)
| Speedway: | 40.2 |
| Indianapolis: | 5.2 |
| Avon: | 44.2 |
| Brownsburg: | 19.2 |
| Plainfield: | 9.8 |
| Beech Grove: | 10.3 |
| Zionsville: | 16.1 |
| Mooresville: | 102.3 |
| Greenwood: | 12.8 |
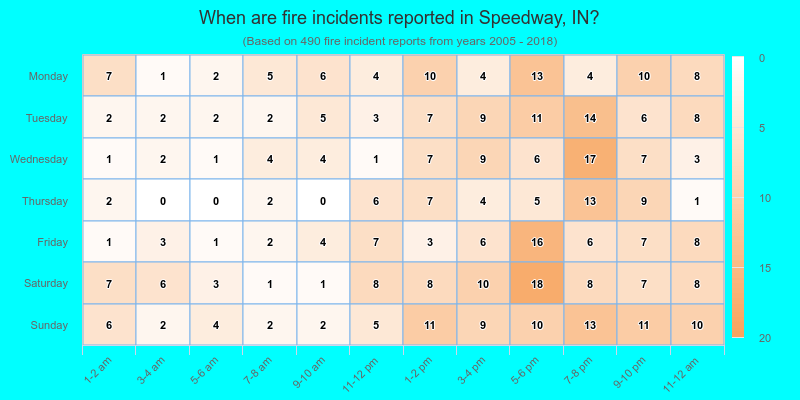
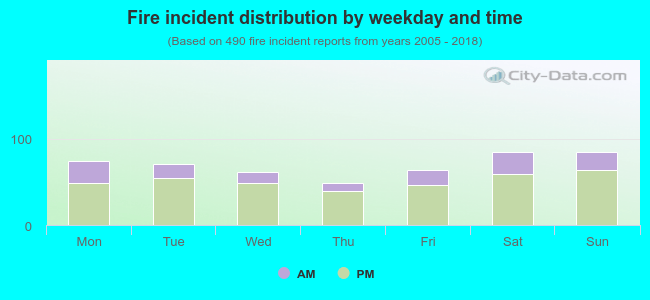 26.3% incidents where reported in the morning and 73.7% in the evening. The most fires (17.3%) took place on Saturday, and the least (10.0%) on Thursday.
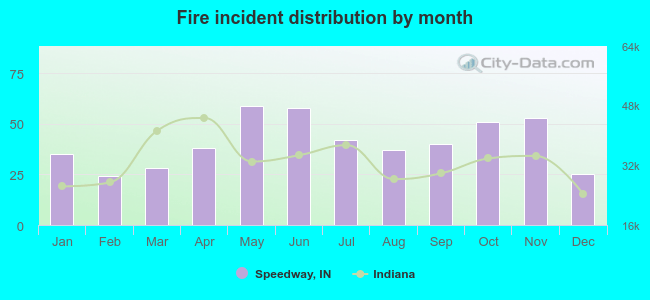 According to the 490 incident reports from years 2005 - 2018 most fires (12.0%) took place during May, and the least (4.9%) in February.
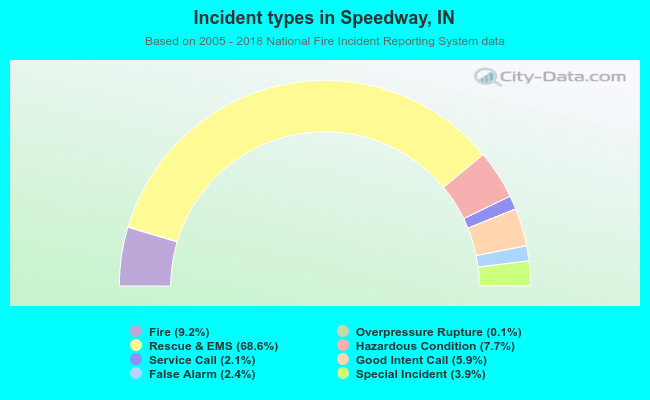 Out of all 5,306 cases reported during the years 2005 - 2018, the most belonged to the categories: Rescue & EMS (68.6%), Fire (9.2%), and Hazardous Condition (7.7%).
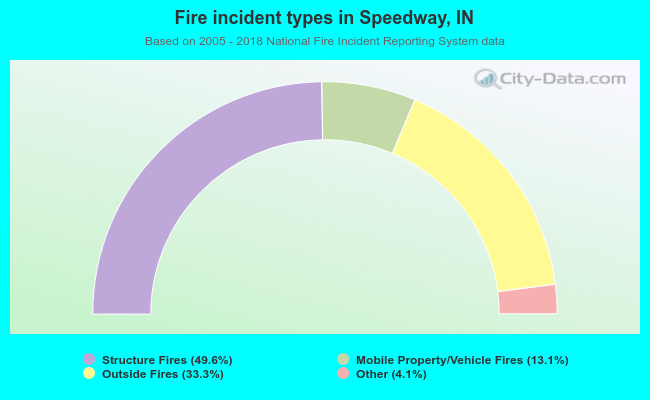 When looking into fire subcategories, the most incidents belonged to: Structure Fires (49.6%), and Outside Fires (33.3%).