Celebration: Fire Incidents, Florida (FL)
Where are fire incidents reported in Celebration, FL
Something went wrong! Please refresh the page.
|
| |||||||||||||||||||||||||||||||||||||||||||||||||||||||||||||||||||||||||||||||||||||||||||||||||||||||||||||
2004 - 2018 National Fire Incident Reporting System (NFIRS) incidents
- Incident types reported to NFIRS in Celebration, FL
- 1,77350.6%Rescue & EMS
- 66719.0%Good Intent Call
- 45413.0%False Alarm
- 36210.3%Service Call
- 1454.1%Fire
- 962.7%Hazardous Condition
- Fire incident types reported to NFIRS in Celebration, FL
- 5940.7%Outside Fires
- 5437.2%Structure Fires
- 2718.6%Mobile Property/Vehicle Fires
- 53.4%Other
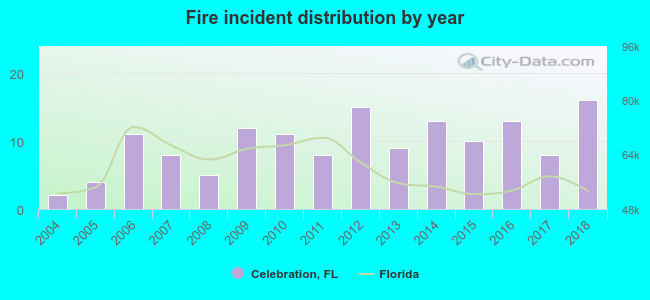 According to the data from the years 2004 - 2018 the average number of fire incidents per year is 10. The highest number of fire incidents - 16 took place in 2018, and the least - 2 in 2004. The data has an increasing trend.
The average number of yearly fire incidents per 10k residents in Celebration, FL compared to nearest cities:
(Note: Based on data for the last 3 years, including only cities with population 5,000 and above)
| Celebration: | 16.6 |
| Kissimmee: | 50.3 |
| Poinciana: | 23.2 |
| Belle Isle: | 4.6 |
| Haines City: | 85.2 |
| Winter Garden: | 38.1 |
| Ocoee: | 36.9 |
| Orlando: | 67.7 |
| Lake Alfred: | 43.8 |

 28.3% incidents where reported in the morning and 71.7% in the evening. The most fires (15.9%) took place on Wednesday, and the least (11.7%) on Friday.
 According to the 145 incident reports from years 2004 - 2018 most fires (12.4%) took place during April, and the least (4.8%) in December.
 Out of all 3,505 cases reported during the years 2004 - 2018, the most belonged to the categories: Rescue & EMS (50.6%), Good Intent Call (19.0%), and False Alarm (13.0%).
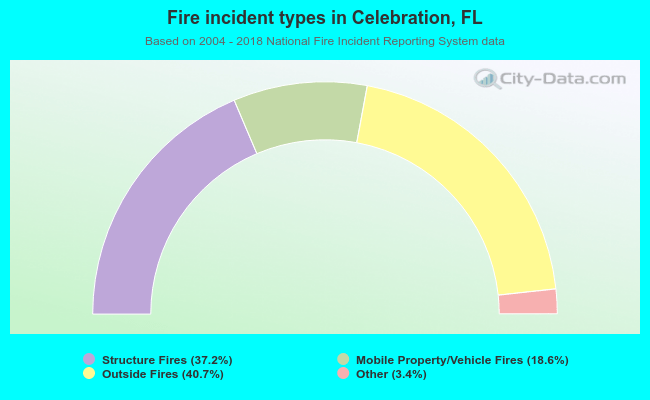 When looking into fire subcategories, the most incidents belonged to: Outside Fires (40.7%), and Structure Fires (37.2%).