Browns Mills: Fire Incidents, New Jersey (NJ)
Where are fire incidents reported in Browns Mills, NJ
Something went wrong! Please refresh the page.
| Fire incidents reported | |
|---|---|
| Sreet name | Count |
| TRENTON RD | 124 |
| LAKESHORE DR | 92 |
| JULIUSTOWN RD | 86 |
| LAKEHURST RD | 84 |
| BROADWAY | 68 |
| PEMBERTON BROWNS MILLS RD | 46 |
| JUNCTION RD | 44 |
| MT MISERY RD | 34 |
| RIDGE RD | 34 |
| CHEROKEE DR | 30 |
| CHIPPEWA | 28 |
| NEW JERSEY RD | 26 |
| WEYMOUTH RD | 22 |
| LAWRENCE DR | 20 |
| LOUISIANA | 20 |
| PEMBERTON-BROWNS MILLS RD | 20 |
| RIDGEVIEW | 20 |
| BAYBERRY ST | 18 |
| CLUBHOUSE RD | 18 |
| VIRGINIA DR | 18 |
| HANOVER BLVD | 16 |
| RANCOCAS LN | 16 |
| RT70 | 16 |
| SEPULGA DR | 16 |
| TENSAW DR | 16 |
| TRAINOR PL | 16 |
| WILDROSE ST | 16 |
| BRYNWOOD DR | 14 |
| FINCH ST | 14 |
| PEPPER RD | 14 |
| Other | 341 |
2003 - 2018 National Fire Incident Reporting System (NFIRS) incidents
- Incident types reported to NFIRS in Browns Mills, NJ
- 1,66424.3%Hazardous Condition
- 1,59323.2%Rescue & EMS
- 1,34719.6%Fire
- 1,34219.6%Good Intent Call
- 5297.7%False Alarm
- 3555.2%Service Call
- 110.2%Special Incident
- 100.1%Severe Weather
- 70.1%Overpressure Rupture
- Fire incident types reported to NFIRS in Browns Mills, NJ
- 65348.5%Structure Fires
- 56441.9%Outside Fires
- 957.1%Mobile Property/Vehicle Fires
- 352.6%Other
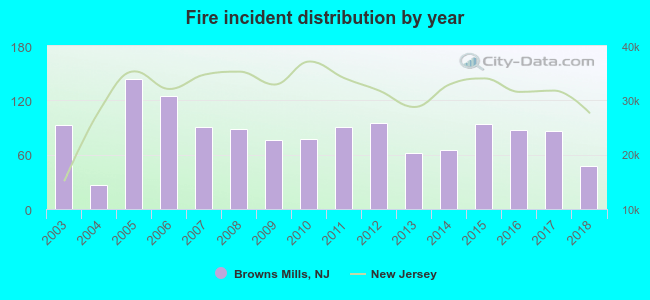 Based on the data from the years 2003 - 2018 the average number of fire incidents per year is 84. The highest number of reported fire incidents - 144 took place in 2005, and the least - 26 in 2004. The data has a decreasing trend.
The average number of yearly fire incidents per 10k residents in Browns Mills, NJ compared to nearest cities:
(Note: Based on data for the last 3 years, including only cities with population 5,000 and above)
| Browns Mills: | 65.3 |
| Yardville: | 1.4 |
| Burlington: | 10.2 |
| Franklin Park: | 26.3 |
| Trenton: | 67.6 |
| Marlton: | 8.6 |
| Beachwood: | 36.7 |
| Hightstown: | 74.8 |
| Lakewood: | 1.7 |
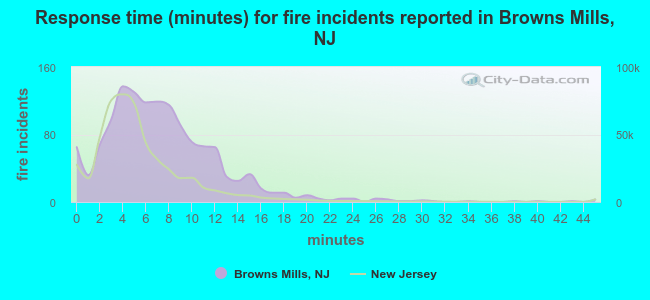 The median response time based on all reported fire incidents is 7 minutes. This is higher compared to the state median value.
The median response time in Browns Mills, NJ compared to nearest cities:
(Note: Based on data for all years, including only cities with at least 500 fire incidents)
| Browns Mills: | 7 minutes |
| Pemberton: | 7 minutes |
| Bordentown: | 7 minutes |
| Florence: | 8 minutes |
| Robbinsville: | 5 minutes |
| Trenton: | 4 minutes |
| Beachwood: | 4 minutes |
| Lakewood: | 4 minutes |
| Toms River: | 6 minutes |
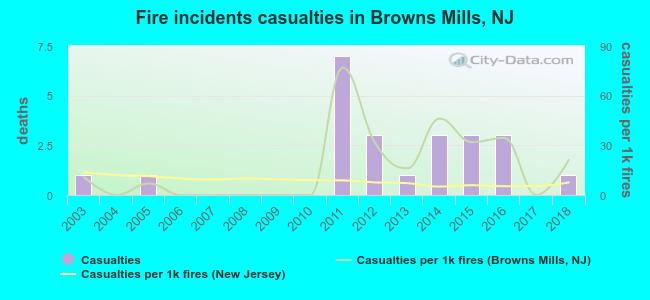 Based on the data from the years 2003 - 2018 the average number of fire-related casualties per year is 1. The highest number of reported injuries - 7 took place in 2011, and the lowest - 0 in 2004. The data has a constant trend.
The average number of casualties per 1,000 fires is 17. This indicator was the highest - 77 in 2011, and the lowest 0 in 2004. The trend for casualties per 1,000 fire incidents is increasing. Compared to the state value the number of injuries per 1,000 incidents is higher.
Based on the data from the years 2003 - 2018 the average number of fire-related casualties per year is 1. The highest number of reported injuries - 7 took place in 2011, and the lowest - 0 in 2004. The data has a constant trend.
The average number of casualties per 1,000 fires is 17. This indicator was the highest - 77 in 2011, and the lowest 0 in 2004. The trend for casualties per 1,000 fire incidents is increasing. Compared to the state value the number of injuries per 1,000 incidents is higher.Casualties per 1,000 incidents in Browns Mills, NJ compared to nearest cities:
(Note: Based on data for all years, including only cities with at least 500 fire incidents)
| Browns Mills: | 17.1 |
| Pemberton: | 3.9 |
| Bordentown: | 0.0 |
| Florence: | 9.5 |
| Robbinsville: | 3.1 |
| Trenton: | 9.2 |
| Beachwood: | 10.2 |
| Lakewood: | 44.4 |
| Toms River: | 10.0 |
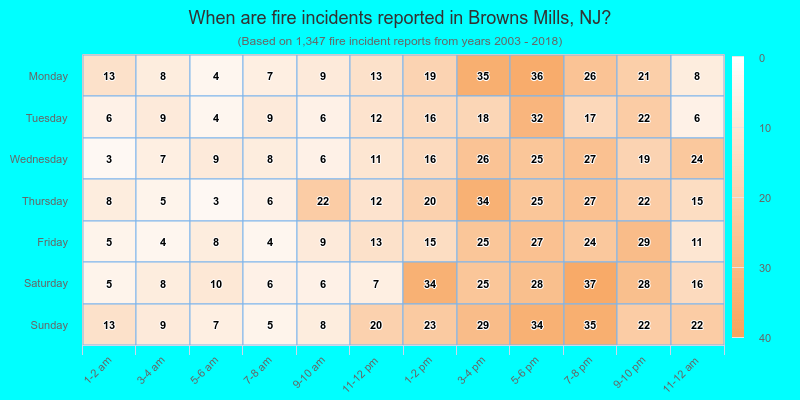
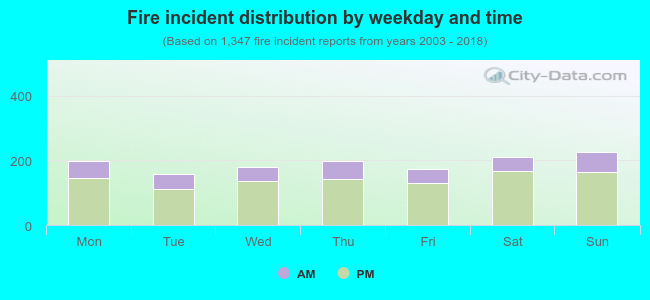 25.8% incidents where reported in the morning and 74.2% in the evening. The most fires (16.9%) took place on Sunday, and the least (11.7%) on Tuesday.
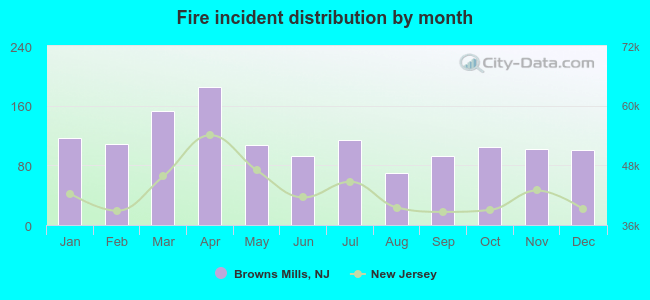 Based on the 1,347 reports from years 2003 - 2018 most fires (13.7%) took place during April, and the least (5.2%) in August.
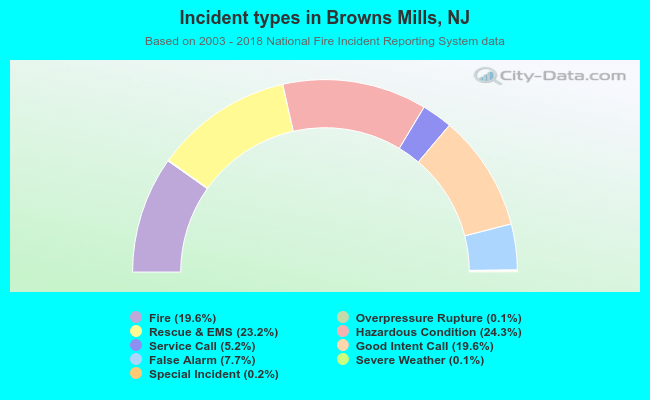 Out of all 6,858 cases reported during the years 2003 - 2018, the most belonged to the categories: Hazardous Condition (24.3%), Rescue & EMS (23.2%), and Fire (19.6%).
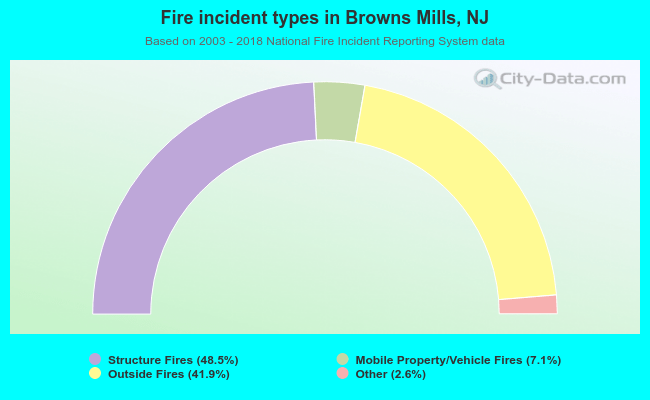 When looking into fire subcategories, the most incidents belonged to: Structure Fires (48.5%), and Outside Fires (41.9%).