Brooksville: Fire Incidents, Florida (FL)
Where are fire incidents reported in Brooksville, FL
Something went wrong! Please refresh the page.
| Fire incidents reported | |
|---|---|
| Sreet name | Count |
| CORTEZ BLVD | 408 |
| BROAD ST | 380 |
| JEFFERSON ST | 106 |
| I75 | 92 |
| COMMERCIAL WAY | 86 |
| PONCE DE LEON BLVD | 82 |
| UNION ST | 70 |
| FORT DADE AVE | 60 |
| MONDON HILL RD | 60 |
| HOWELL AVE | 58 |
| POWELL RD | 50 |
| CALIFORNIA ST | 46 |
| LAKE LINDSEY RD | 46 |
| SPRING LAKE HWY | 46 |
| SUNSHINE GROVE RD | 46 |
| TWIGG ST | 42 |
| CEMENT PLANT RD | 38 |
| WISCON RD | 38 |
| CITRUS WAY | 36 |
| CORTEZ | 34 |
| SUNCOAST PKY | 34 |
| CANDLELIGHT BLVD | 32 |
| ROPER RD | 32 |
| US 41 HWY | 32 |
| COBB RD | 30 |
| AYERS RD | 28 |
| CROOM RD | 28 |
| HEXAM RD | 28 |
| OLD CRYSTAL RIVER RD | 28 |
| BOWMAN RD | 26 |
| Other | 1,720 |
2002 - 2018 National Fire Incident Reporting System (NFIRS) incidents
- Incident types reported to NFIRS in Brooksville, FL
- 28,32063.0%Rescue & EMS
- 4,71110.5%Good Intent Call
- 4,50410.0%Service Call
- 3,8428.6%Fire
- 2,1094.7%Hazardous Condition
- 1,1662.6%False Alarm
- 1850.4%Special Incident
- 900.2%Severe Weather
- Fire incident types reported to NFIRS in Brooksville, FL
- 1,91849.9%Outside Fires
- 1,14129.7%Structure Fires
- 68417.8%Mobile Property/Vehicle Fires
- 992.6%Other
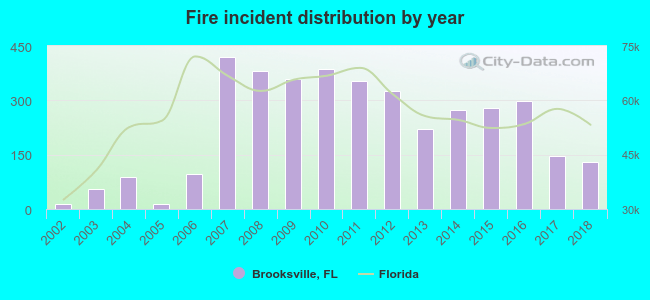 Based on the data from the years 2002 - 2018 the average number of fire incidents per year is 226. The highest number of fire incidents - 421 took place in 2007, and the least - 13 in 2005. The data has a rising trend.
The average number of yearly fire incidents per 10k residents in Brooksville, FL compared to nearest cities:
(Note: Based on data for the last 3 years, including only cities with population 5,000 and above)
| Brooksville: | 246.9 |
| Spring Hill: | 8.1 |
| Shady Hills: | 5.6 |
| Floral City: | 33.2 |
| Dade City: | 135.8 |
| Inverness: | 81.9 |
| Lecanto: | 60.1 |
| Hudson: | 95.7 |
| Bayonet Point: | 9.9 |
 The median response time based on all reported fire incidents is 7 minutes. This is about the same as the Florida median value.
The median response time in Brooksville, FL compared to nearest cities:
(Note: Based on data for all years, including only cities with at least 500 fire incidents)
| Brooksville: | 7 minutes |
| Spring Hill: | 7 minutes |
| Dade City: | 7 minutes |
| Bushnell: | 7 minutes |
| Inverness: | 8 minutes |
| Webster: | 10 minutes |
| Homosassa: | 9 minutes |
| Lecanto: | 10 minutes |
| Hudson: | 8 minutes |
 Based on the data from the years 2002 - 2018 the average number of fire-related yearly deaths is 1. The highest number of reported deaths - 3 took place in 2008, and the lowest - 0 in 2002. The data has a rising trend.
The average number of fatalities per 1,000 fire incidents is 9. This indicator was the highest - 77 in 2005, and the lowest 0 in 2002. The trend for deaths per 1,000 incidents is rising. Compared to the Florida value the number of deaths per 1,000 incidents is much higher.
Based on the data from the years 2002 - 2018 the average number of fire-related yearly deaths is 1. The highest number of reported deaths - 3 took place in 2008, and the lowest - 0 in 2002. The data has a rising trend.
The average number of fatalities per 1,000 fire incidents is 9. This indicator was the highest - 77 in 2005, and the lowest 0 in 2002. The trend for deaths per 1,000 incidents is rising. Compared to the Florida value the number of deaths per 1,000 incidents is much higher.Deaths per 1,000 incidents in Brooksville, FL compared to nearest cities:
(Note: Based on data for all years, including only cities with at least 2,500 fire incidents)
| Brooksville: | 4.2 |
| New Port Richey: | 2.9 |
 According to the data from the years 2002 - 2018 the average number of fire-related casualties per year is 4. The highest number of reported injuries - 12 took place in 2014, and the lowest - 0 in 2002. The data has a growing trend.
The average number of casualties per 1,000 fires is 21. This indicator was the highest - 109 in 2003, and the lowest 0 in 2002. The trend for casualties per 1,000 fire incidents is increasing. Compared to the Florida value the number of casualties per 1,000 fire incidents is higher.
According to the data from the years 2002 - 2018 the average number of fire-related casualties per year is 4. The highest number of reported injuries - 12 took place in 2014, and the lowest - 0 in 2002. The data has a growing trend.
The average number of casualties per 1,000 fires is 21. This indicator was the highest - 109 in 2003, and the lowest 0 in 2002. The trend for casualties per 1,000 fire incidents is increasing. Compared to the Florida value the number of casualties per 1,000 fire incidents is higher.
 26.9% incidents where reported in the morning and 73.1% in the evening. The most fires (16.1%) took place on Saturday, and the least (13.3%) on Monday.
 Based on the 3,842 fire incidents from years 2002 - 2018 most fires (12.5%) took place during March, and the least (5.9%) in September.
 Out of all 44,935 cases reported during the years 2002 - 2018, the most belonged to the categories: Rescue & EMS (63.0%), Good Intent Call (10.5%), and Service Call (10.0%).
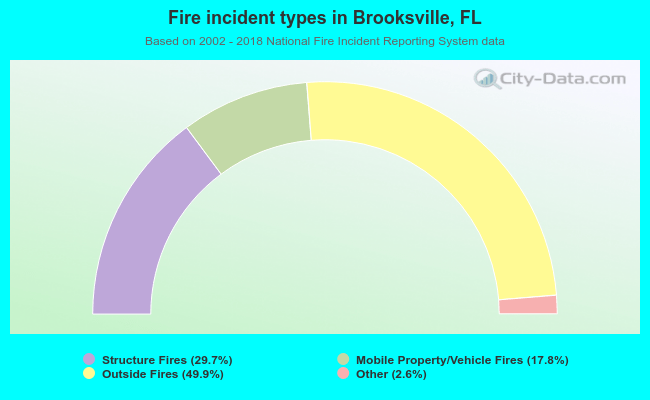 When looking into fire subcategories, the most incidents belonged to: Outside Fires (49.9%), and Structure Fires (29.7%).