Brookings: Fire Incidents, Oregon (OR)
Where are fire incidents reported in Brookings, OR
Something went wrong! Please refresh the page.
|
| |||||||||||||||||||||||||||||||||||||||||||||||||||||||||||||||||||||||||||||||||||||||||||||||||||||||||||||
| Other | 21 | |||||||||||||||||||||||||||||||||||||||||||||||||||||||||||||||||||||||||||||||||||||||||||||||||||||||||||||
2002 - 2018 National Fire Incident Reporting System (NFIRS) incidents
- Incident types reported to NFIRS in Brookings, OR
- 79236.2%Rescue & EMS
- 55125.2%Fire
- 28312.9%Good Intent Call
- 22510.3%Hazardous Condition
- 1948.9%Service Call
- 1195.4%False Alarm
- 170.8%Special Incident
- 70.3%Severe Weather
- Fire incident types reported to NFIRS in Brookings, OR
- 24444.3%Outside Fires
- 21438.8%Structure Fires
- 7012.7%Mobile Property/Vehicle Fires
- 234.2%Other
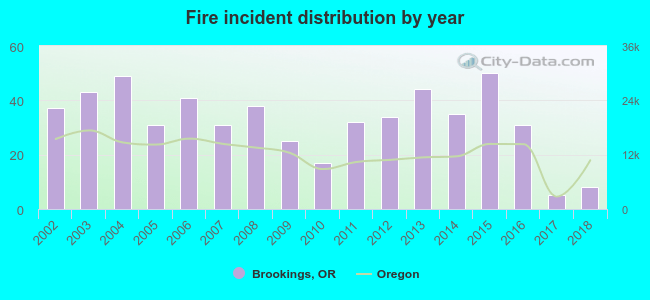 According to the data from the years 2002 - 2018 the average number of fire incidents per year is 32. The highest number of fires - 50 took place in 2015, and the least - 5 in 2017. The data has a dropping trend.
The average number of yearly fire incidents per 10k residents in Brookings, OR compared to nearest cities:
(Note: Based on data for the last 3 years, including only cities with population 5,000 and above)
| Brookings: | 22.9 |
| Grants Pass: | 44.5 |
| Central Point: | 29.9 |
| Medford: | 17.4 |
| Talent: | 27.4 |
| White City: | 25.9 |
| Tenmile: | 2.1 |
| Eagle Point: | 24.4 |
| Ashland: | 26.6 |
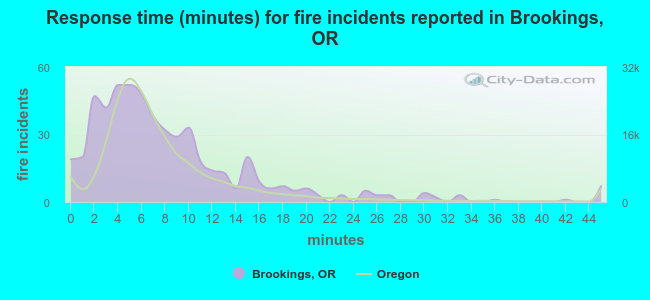 The median response time based on all reported fire incidents is 6 minutes. This is similar to the Oregon median value.
The median response time in Brookings, OR compared to nearest cities:
(Note: Based on data for all years, including only cities with at least 500 fire incidents)
| Brookings: | 6 minutes |
| Crescent City: | 5 minutes |
| Cave Junction: | 8 minutes |
| Grants Pass: | 7 minutes |
| Jacksonville: | 10 minutes |
| Central Point: | 8 minutes |
| Medford: | 5 minutes |
| McKinleyville: | 6 minutes |
| White City: | 6 minutes |
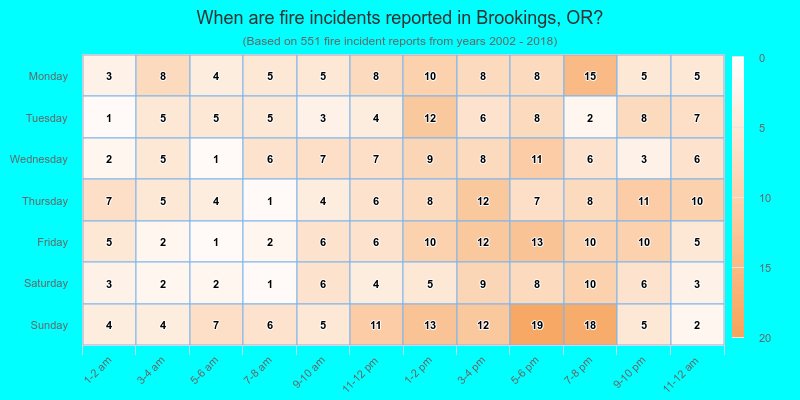
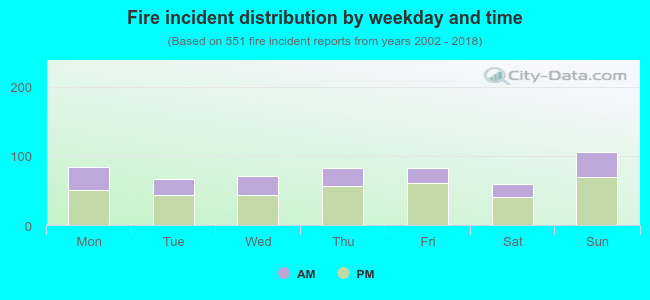 34.1% incidents where reported in the morning and 65.9% in the evening. The most fires (19.2%) took place on Sunday, and the least (10.7%) on Saturday.
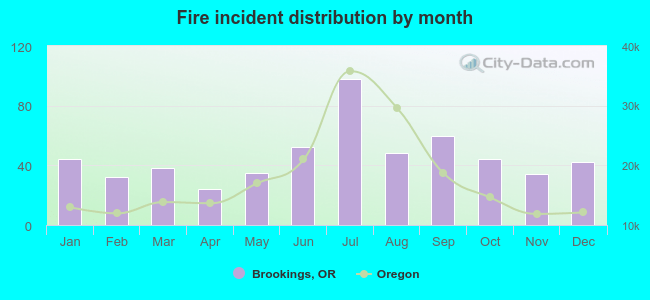 Based on the 551 fires from years 2002 - 2018 most fires (17.8%) took place during July, and the least (4.4%) in April.
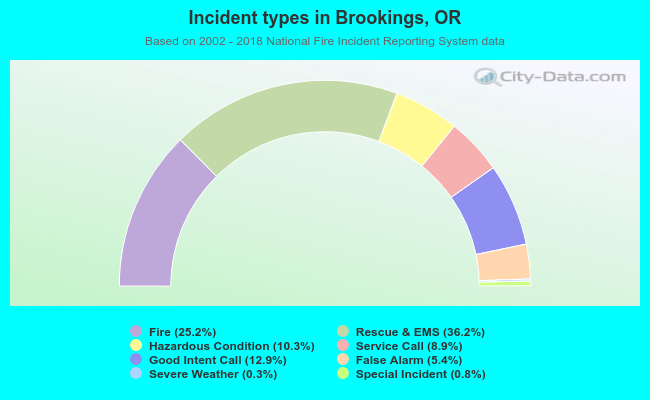 Out of all 2,188 cases reported during the years 2002 - 2018, the most belonged to the categories: Overpressure Rupture (36.2%), Fire (25.2%), and Service Call (12.9%).
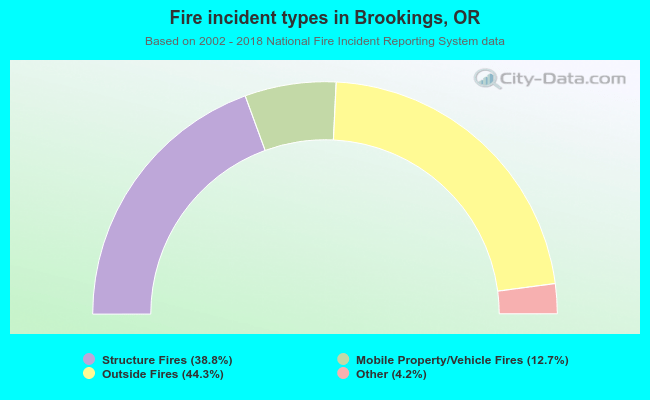 When looking into fire subcategories, the most reports belonged to: Outside Fires (44.3%), and Structure Fires (38.8%).