Tenmile: Fire Incidents, Oregon (OR)
Where are fire incidents reported in Tenmile, OR
Something went wrong! Please refresh the page.
|
| |||||||||||||||||||||||||||||||||||||||||||||||||||||||||||||||||||||||||||||||||||||||||||||||||||||||||||||
2002 - 2018 National Fire Incident Reporting System (NFIRS) incidents
- Incident types reported to NFIRS in Tenmile, OR
- 31056.9%Rescue & EMS
- 11020.2%Fire
- 6912.7%Good Intent Call
- 285.1%Service Call
- 183.3%Hazardous Condition
- 61.1%False Alarm
- 30.6%Special Incident
- 10.2%Severe Weather
- Fire incident types reported to NFIRS in Tenmile, OR
- 5953.6%Outside Fires
- 3935.5%Structure Fires
- 87.3%Mobile Property/Vehicle Fires
- 43.6%Other
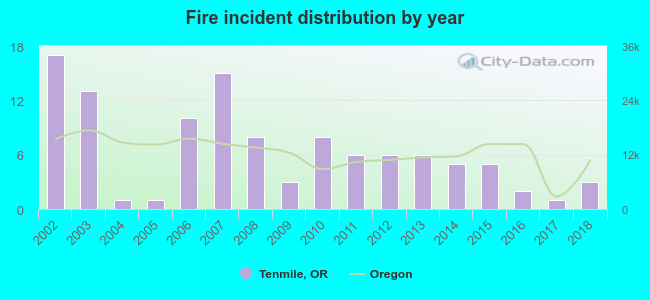 According to the data from the years 2002 - 2018 the average number of fires per year is 6. The highest number of fires - 17 took place in 2002, and the least - 1 in 2004. The data has a declining trend.
The average number of yearly fire incidents per 10k residents in Tenmile, OR compared to nearest cities:
(Note: Based on data for the last 3 years, including only cities with population 5,000 and above)
| Tenmile: | 2.1 |
| Winston: | 29.3 |
| Roseburg: | 41.5 |
| Roseburg North: | 16.9 |
| Sutherlin: | 33.9 |
| Coos Bay: | 20.8 |
| North Bend: | 23.1 |
| Grants Pass: | 44.5 |
| Eagle Point: | 24.4 |
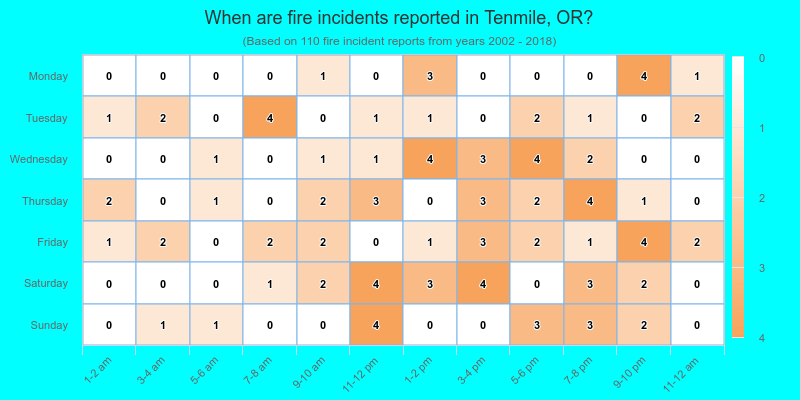
 36.4% incidents where reported in the morning and 63.6% in the evening. The most fires (18.2%) took place on Friday, and the least (8.2%) on Monday.
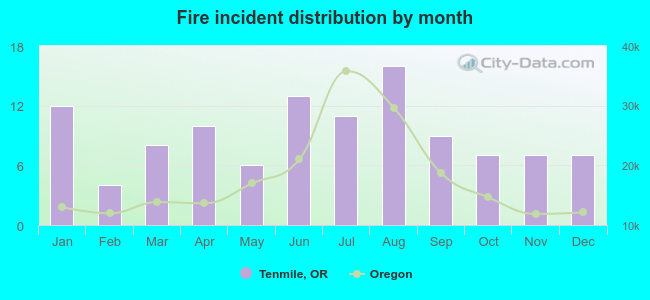 Based on the 110 incident reports from years 2002 - 2018 most fires (14.5%) took place during August, and the least (3.6%) in February.
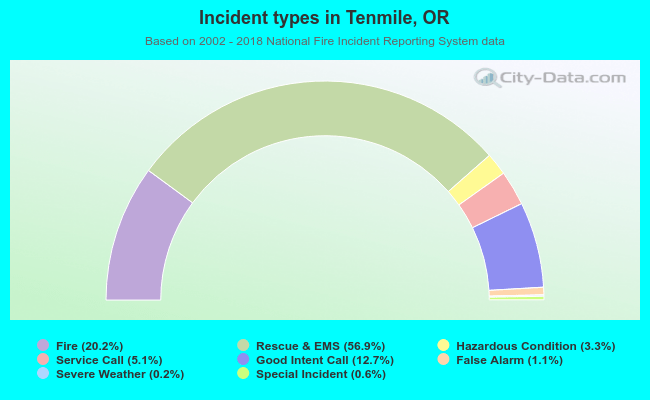 Out of all 545 cases reported during the years 2002 - 2018, the most belonged to the categories: Overpressure Rupture (56.9%), Fire (20.2%), and Service Call (12.7%).
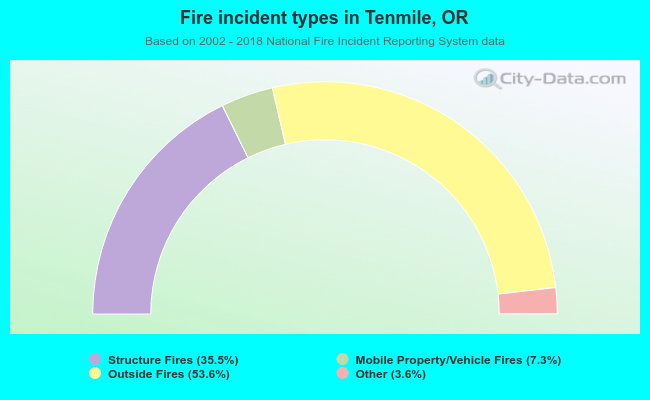 When looking into fire subcategories, the most reports belonged to: Outside Fires (53.6%), and Structure Fires (35.5%).