Medford: Fire Incidents, Oregon (OR)
Where are fire incidents reported in Medford, OR
Something went wrong! Please refresh the page.
| Fire incidents reported | |
|---|---|
| Sreet name | Count |
| PACIFIC HWY | 278 |
| BIDDLE RD | 274 |
| MAIN ST | 264 |
| CRATER LAKE HWY | 204 |
| RIVERSIDE AVE | 200 |
| TABLE ROCK RD | 194 |
| BARNETT RD | 190 |
| MCANDREWS RD | 174 |
| JACKSON ST | 154 |
| CRATER LAKE AVE | 146 |
| SPRING ST | 108 |
| ROSS LN | 104 |
| STEWART AVE | 104 |
| POPLAR DR | 98 |
| PACIFIC HW | 92 |
| STAGE RD | 90 |
| HOLLY ST | 86 |
| CENTRAL AVE | 84 |
| COLUMBUS AVE | 72 |
| CENTER DR | 70 |
| 10TH ST | 66 |
| PHOENIX RD | 66 |
| DELTA WATERS RD | 64 |
| CRATER LAKE HW | 62 |
| KEENE WAY DR | 62 |
| SAGE RD | 60 |
| 11TH ST | 58 |
| MACE RD | 56 |
| OAKDALE AVE | 56 |
| PEACH ST | 56 |
| Other | 1,421 |
2002 - 2018 National Fire Incident Reporting System (NFIRS) incidents
- Incident types reported to NFIRS in Medford, OR
- 15,95153.7%Rescue & EMS
- 5,01316.9%Fire
- 4,26114.4%Good Intent Call
- 1,7405.9%Service Call
- 1,4745.0%Hazardous Condition
- 1,1193.8%False Alarm
- 450.2%Severe Weather
- 430.1%Special Incident
- 330.1%Overpressure Rupture
- Fire incident types reported to NFIRS in Medford, OR
- 2,22644.4%Outside Fires
- 1,78735.6%Structure Fires
- 74314.8%Mobile Property/Vehicle Fires
- 2575.1%Other
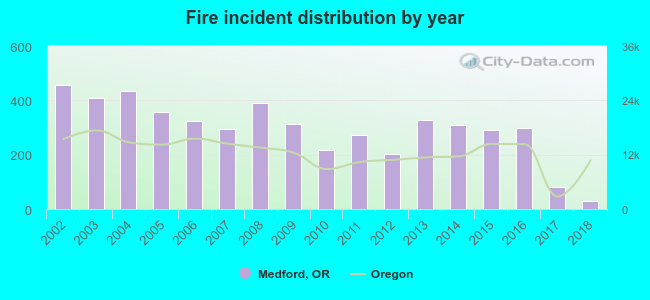 Based on the data from the years 2002 - 2018 the average number of fires per year is 295. The highest number of reported fire incidents - 457 took place in 2002, and the least - 31 in 2018. The data has a declining trend.
The average number of yearly fire incidents per 10k residents in Medford, OR compared to nearest cities:
(Note: Based on data for the last 3 years, including only cities with population 5,000 and above)
| Medford: | 17.4 |
| Central Point: | 29.9 |
| White City: | 25.9 |
| Talent: | 27.4 |
| Eagle Point: | 24.4 |
| Ashland: | 26.6 |
| Grants Pass: | 44.5 |
| Klamath Falls: | 23.4 |
| Tenmile: | 2.1 |
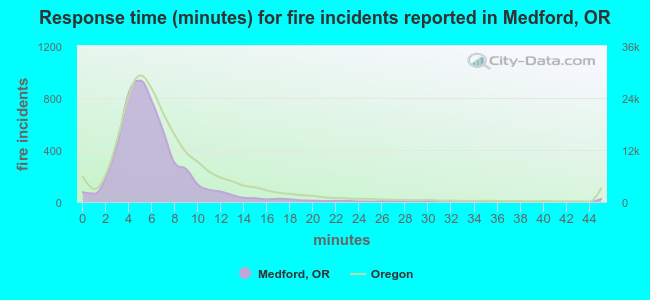 The median response time based on all reported fire incidents is 5 minutes. This is lower than the state median value.
The median response time in Medford, OR compared to nearest cities:
(Note: Based on data for all years, including only cities with at least 500 fire incidents)
| Medford: | 5 minutes |
| Central Point: | 8 minutes |
| Jacksonville: | 10 minutes |
| White City: | 6 minutes |
| Eagle Point: | 9 minutes |
| Ashland: | 6 minutes |
| Grants Pass: | 7 minutes |
| Cave Junction: | 8 minutes |
| Myrtle Creek: | 7 minutes |
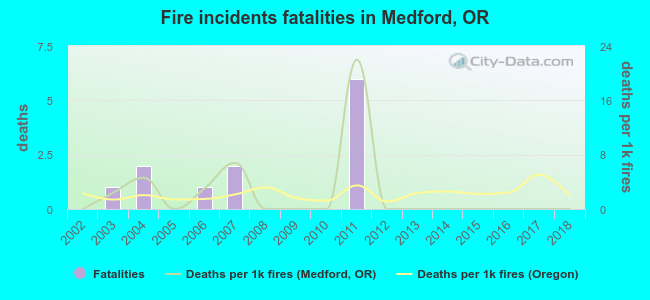 Based on the reports from the years 2002 - 2018 the average number of fire-related fatalities per year is 1. The highest number of reported deaths - 6 took place in 2011, and the lowest - 0 in 2002. The data has a constant trend.
The average number of fatalities per 1,000 fires is 2. This indicator was the highest - 22 in 2011, and the lowest 0 in 2002. The trend for deaths per 1,000 incidents is constant. Compared to the Oregon value the number of deaths per 1,000 incidents is similar.
Based on the reports from the years 2002 - 2018 the average number of fire-related fatalities per year is 1. The highest number of reported deaths - 6 took place in 2011, and the lowest - 0 in 2002. The data has a constant trend.
The average number of fatalities per 1,000 fires is 2. This indicator was the highest - 22 in 2011, and the lowest 0 in 2002. The trend for deaths per 1,000 incidents is constant. Compared to the Oregon value the number of deaths per 1,000 incidents is similar.Deaths per 1,000 incidents in Medford, OR compared to nearest cities:
(Note: Based on data for all years, including only cities with at least 2,500 fire incidents)
| Medford: | 2.4 |
| Grants Pass: | 2.1 |
| Klamath Falls: | 2.7 |
| Roseburg: | 2.1 |
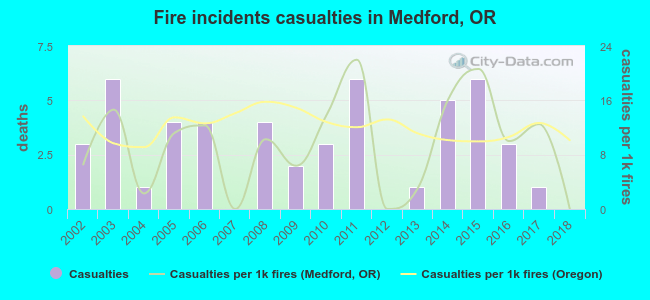 Based on the data from the years 2002 - 2018 the average number of fire-related yearly casualties is 3. The highest number of injuries - 6 took place in 2003, and the lowest - 0 in 2007. The data has a dropping trend.
The average number of injuries per 1,000 fire incidents is 10. This indicator was the highest - 22 in 2011, and the lowest 0 in 2007. The trend for casualties per 1,000 fires is decreasing. Compared to the state value the number of casualties per 1,000 fire incidents is lower.
Based on the data from the years 2002 - 2018 the average number of fire-related yearly casualties is 3. The highest number of injuries - 6 took place in 2003, and the lowest - 0 in 2007. The data has a dropping trend.
The average number of injuries per 1,000 fire incidents is 10. This indicator was the highest - 22 in 2011, and the lowest 0 in 2007. The trend for casualties per 1,000 fires is decreasing. Compared to the state value the number of casualties per 1,000 fire incidents is lower.Casualties per 1,000 incidents in Medford, OR compared to nearest cities:
(Note: Based on data for all years, including only cities with at least 500 fire incidents)
| Medford: | 9.8 |
| Central Point: | 19.6 |
| Jacksonville: | 9.2 |
| White City: | 11.8 |
| Eagle Point: | 10.4 |
| Ashland: | 7.5 |
| Grants Pass: | 14.4 |
| Cave Junction: | 4.9 |
| Myrtle Creek: | 4.1 |
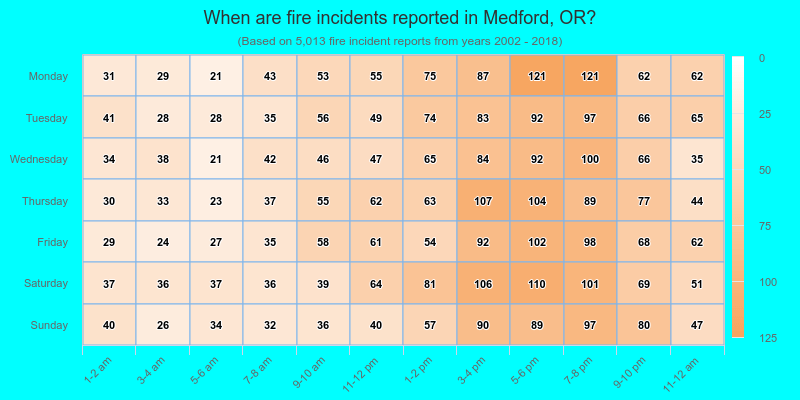
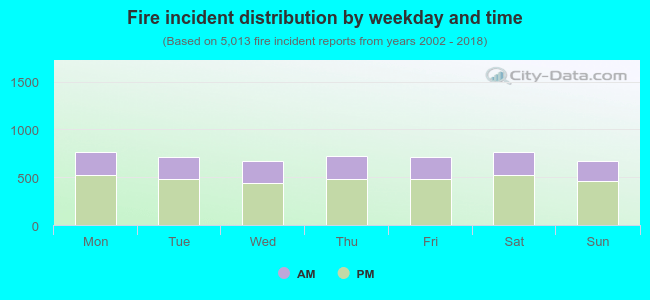 32.5% incidents where reported in the morning and 67.5% in the evening. The most fires (15.3%) took place on Saturday, and the least (13.3%) on Sunday.
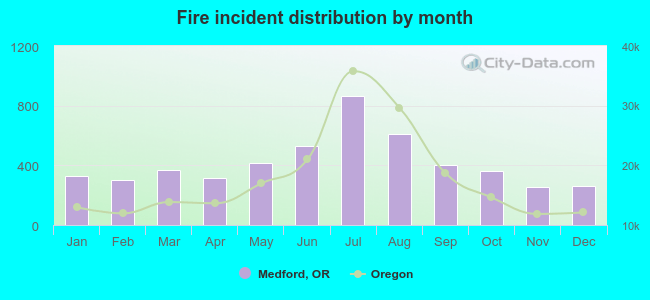 Based on the 5,013 fire incidents from years 2002 - 2018 most fires (17.3%) took place during July, and the least (5.0%) in November.
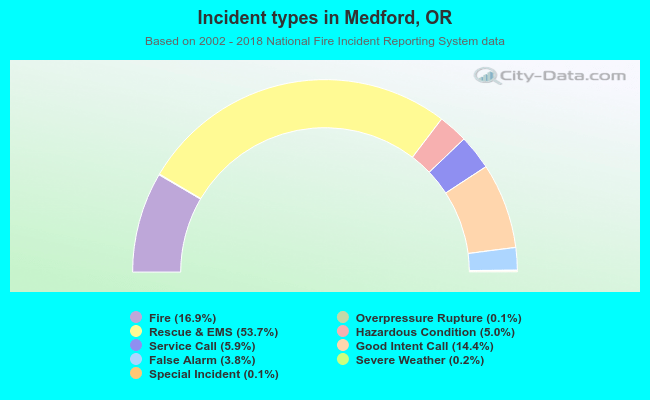 Out of all 29,679 cases reported during the years 2002 - 2018, the most belonged to the categories: Rescue & EMS (53.7%), Fire (16.9%), and Good Intent Call (14.4%).
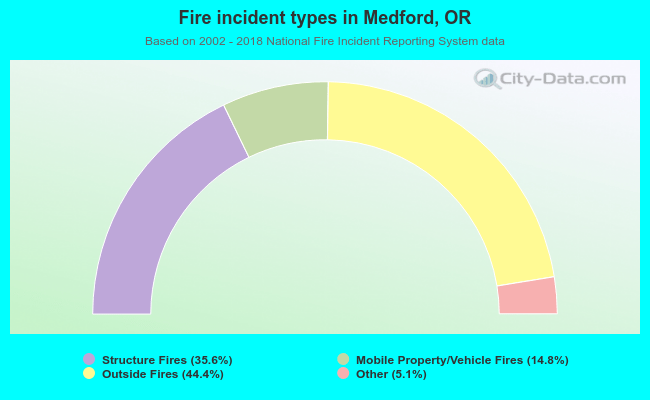 When looking into fire subcategories, the most reports belonged to: Outside Fires (44.4%), and Structure Fires (35.6%).