Ames: Fire Incidents, Iowa (IA)
Where are fire incidents reported in Ames, IA
Something went wrong! Please refresh the page.
| Fire incidents reported | |
|---|---|
| Sreet name | Count |
| LINCOLN WAY | 236 |
| WELCH AVE | 138 |
| DUFF AVE | 126 |
| STANTON AVE | 96 |
| SUNSET DR | 94 |
| MORTENSEN RD | 88 |
| TRIPP ST | 66 |
| HYLAND AVE | 62 |
| GRAND AVE | 60 |
| CAMPUS AVE | 58 |
| FREDERIKSEN COURT | 58 |
| HAYWARD AVE | 58 |
| 4TH ST | 56 |
| KNAPP ST | 56 |
| DAYTON AVE | 46 |
| 13TH ST | 44 |
| 5TH ST | 42 |
| COCONINO RD | 42 |
| DAKOTA AVE | 38 |
| HUNT ST | 38 |
| 6TH ST | 36 |
| ASH AVE | 36 |
| FREEL DR | 32 |
| KELLOGG AVE | 30 |
| PEARSON AVE | 30 |
| 16TH ST | 28 |
| LYNN AVE | 28 |
| DELAWARE AVE | 26 |
| WEST ST | 26 |
| 30 | 24 |
| Other | 209 |
2002 - 2017 National Fire Incident Reporting System (NFIRS) incidents
- Incident types reported to NFIRS in Ames, IA
- 8,76248.8%Rescue & EMS
- 3,06317.0%False Alarm
- 2,00711.2%Fire
- 1,4358.0%Service Call
- 1,4318.0%Good Intent Call
- 1,2066.7%Hazardous Condition
- 470.3%Overpressure Rupture
- 180.1%Special Incident
- Fire incident types reported to NFIRS in Ames, IA
- 95847.7%Outside Fires
- 71235.5%Structure Fires
- 28014.0%Mobile Property/Vehicle Fires
- 572.8%Other
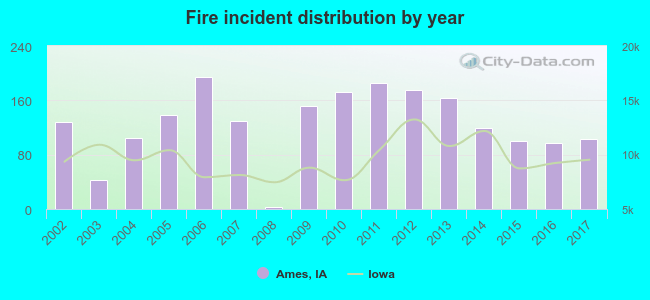 According to the data from the years 2002 - 2017 the average number of fire incidents per year is 125. The highest number of reported fires - 195 took place in 2006, and the least - 3 in 2008. The data has a declining trend.
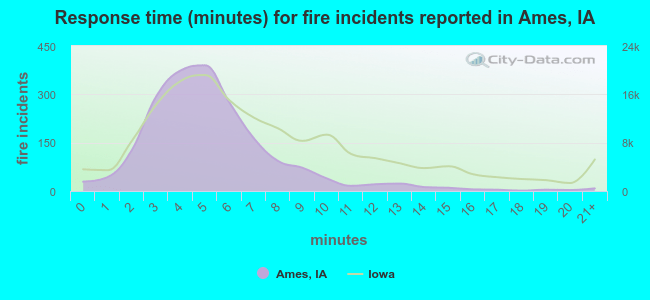 The median response time based on all reported fire incidents is 5 minutes. This is lower compared to the state median value.
The median response time in Ames, IA compared to nearest cities:
(Note: Based on data for all years, including only cities with at least 500 fire incidents)
| Ames: | 5 minutes |
| Nevada: | 5 minutes |
| Boone: | 4 minutes |
| Ankeny: | 7 minutes |
| Johnston: | 9 minutes |
| Altoona: | 7 minutes |
| Urbandale: | 7 minutes |
| Clive: | 6 minutes |
| Des Moines: | 5 minutes |
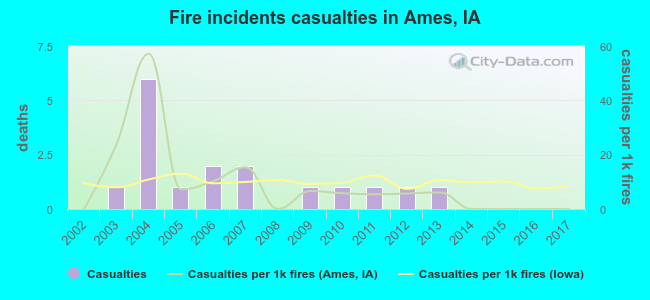 According to the reports from the years 2002 - 2017 the average number of fire-related yearly casualties is 1. The highest number of reported casualties - 6 took place in 2004, and the lowest - 0 in 2002. The data has a constant trend.
The average number of casualties per 1,000 fire incidents is 9. This indicator was the highest - 57 in 2004, and the lowest 0 in 2002. The trend for casualties per 1,000 incidents is constant. Compared to the Iowa value the number of casualties per 1,000 fire incidents is about the same.
According to the reports from the years 2002 - 2017 the average number of fire-related yearly casualties is 1. The highest number of reported casualties - 6 took place in 2004, and the lowest - 0 in 2002. The data has a constant trend.
The average number of casualties per 1,000 fire incidents is 9. This indicator was the highest - 57 in 2004, and the lowest 0 in 2002. The trend for casualties per 1,000 incidents is constant. Compared to the Iowa value the number of casualties per 1,000 fire incidents is about the same.
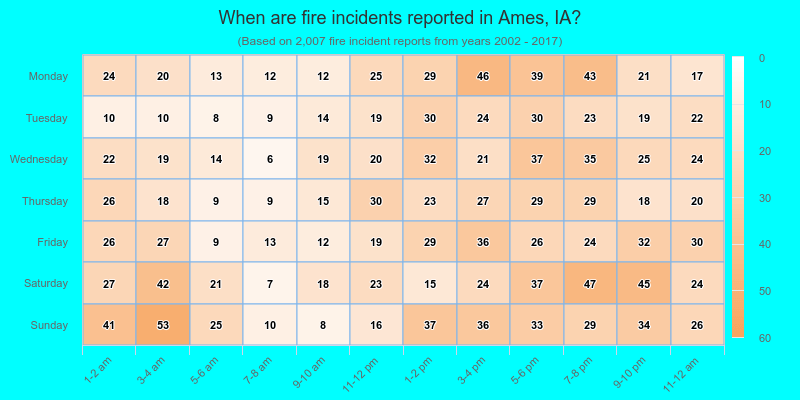
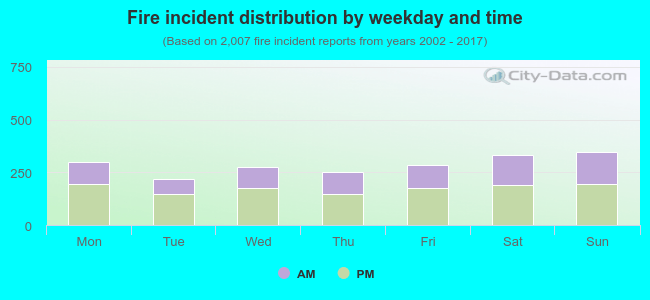 38.9% incidents where reported in the morning and 61.1% in the evening. The most fires (17.3%) took place on Sunday, and the least (10.9%) on Tuesday.
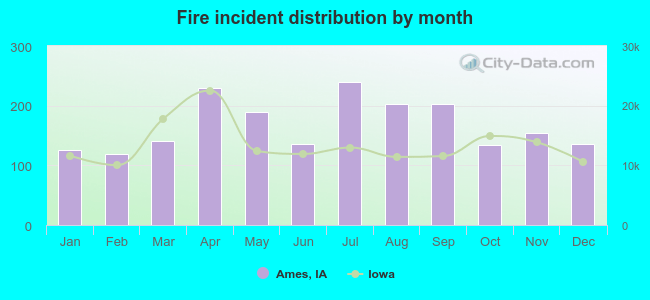 According to the 2,007 fires from years 2002 - 2017 most fires (11.9%) took place during July, and the least (5.9%) in February.
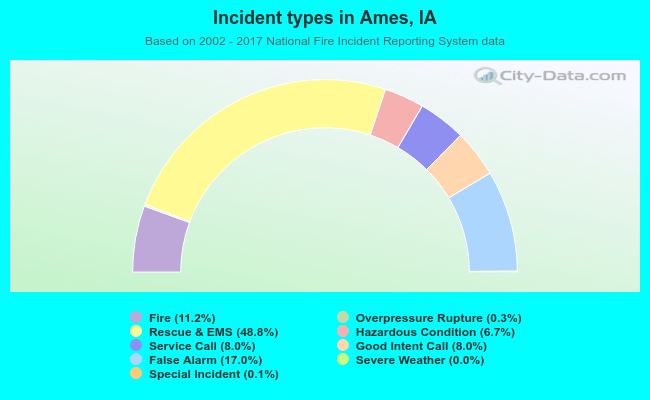 Out of all 17,971 cases reported during the years 2002 - 2017, the most belonged to the categories: Rescue & EMS (48.8%), False Alarm (17.0%), and Fire (11.2%).
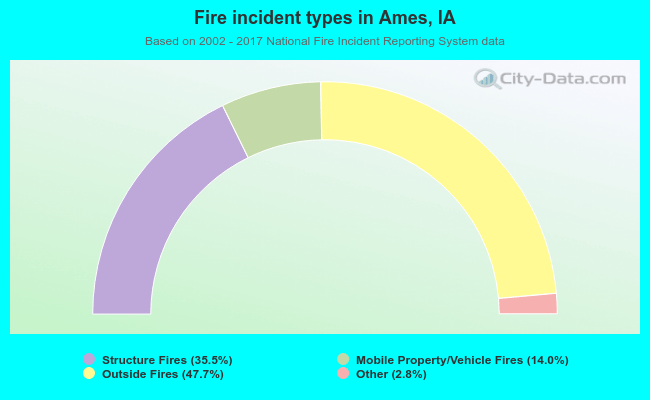 When looking into fire subcategories, the most reports belonged to: Outside Fires (47.7%), and Structure Fires (35.5%).