Orange City, Florida Submit your own pictures of this city and show them to the world
OSM Map
General Map
Google Map
MSN Map
OSM Map
General Map
Google Map
MSN Map
OSM Map
General Map
Google Map
MSN Map
OSM Map
General Map
Google Map
MSN Map
Please wait while loading the map...
Population in 2022: 14,897 (99% urban, 1% rural). Population change since 2000: +125.6%Males: 7,182 Females: 7,715
March 2022 cost of living index in Orange City: 90.2 (less than average, U.S. average is 100) Percentage of residents living in poverty in 2022: 13.6%for White Non-Hispanic residents , 16.7% for Black residents , 28.0% for Hispanic or Latino residents , 30.8% for other race residents , 11.6% for two or more races residents )
Profiles of local businesses
Business Search - 14 Million verified businesses
Data:
Median household income ($)
Median household income (% change since 2000)
Household income diversity
Ratio of average income to average house value (%)
Ratio of average income to average rent
Median household income ($) - White
Median household income ($) - Black or African American
Median household income ($) - Asian
Median household income ($) - Hispanic or Latino
Median household income ($) - American Indian and Alaska Native
Median household income ($) - Multirace
Median household income ($) - Other Race
Median household income for houses/condos with a mortgage ($)
Median household income for apartments without a mortgage ($)
Races - White alone (%)
Races - White alone (% change since 2000)
Races - Black alone (%)
Races - Black alone (% change since 2000)
Races - American Indian alone (%)
Races - American Indian alone (% change since 2000)
Races - Asian alone (%)
Races - Asian alone (% change since 2000)
Races - Hispanic (%)
Races - Hispanic (% change since 2000)
Races - Native Hawaiian and Other Pacific Islander alone (%)
Races - Native Hawaiian and Other Pacific Islander alone (% change since 2000)
Races - Two or more races (%)
Races - Two or more races (% change since 2000)
Races - Other race alone (%)
Races - Other race alone (% change since 2000)
Racial diversity
Unemployment (%)
Unemployment (% change since 2000)
Unemployment (%) - White
Unemployment (%) - Black or African American
Unemployment (%) - Asian
Unemployment (%) - Hispanic or Latino
Unemployment (%) - American Indian and Alaska Native
Unemployment (%) - Multirace
Unemployment (%) - Other Race
Population density (people per square mile)
Population - Males (%)
Population - Females (%)
Population - Males (%) - White
Population - Males (%) - Black or African American
Population - Males (%) - Asian
Population - Males (%) - Hispanic or Latino
Population - Males (%) - American Indian and Alaska Native
Population - Males (%) - Multirace
Population - Males (%) - Other Race
Population - Females (%) - White
Population - Females (%) - Black or African American
Population - Females (%) - Asian
Population - Females (%) - Hispanic or Latino
Population - Females (%) - American Indian and Alaska Native
Population - Females (%) - Multirace
Population - Females (%) - Other Race
Coronavirus confirmed cases (May 16, 2024)
Deaths caused by coronavirus (May 16, 2024)
Coronavirus confirmed cases (per 100k population) (May 16, 2024)
Deaths caused by coronavirus (per 100k population) (May 16, 2024)
Daily increase in number of cases (May 16, 2024)
Weekly increase in number of cases (May 16, 2024)
Cases doubled (in days) (May 16, 2024)
Hospitalized patients (Apr 18, 2022)
Negative test results (Apr 18, 2022)
Total test results (Apr 18, 2022)
COVID Vaccine doses distributed (per 100k population) (Sep 19, 2023)
COVID Vaccine doses administered (per 100k population) (Sep 19, 2023)
COVID Vaccine doses distributed (Sep 19, 2023)
COVID Vaccine doses administered (Sep 19, 2023)
Likely homosexual households (%)
Likely homosexual households (% change since 2000)
Likely homosexual households - Lesbian couples (%)
Likely homosexual households - Lesbian couples (% change since 2000)
Likely homosexual households - Gay men (%)
Likely homosexual households - Gay men (% change since 2000)
Cost of living index
Median gross rent ($)
Median contract rent ($)
Median monthly housing costs ($)
Median house or condo value ($)
Median house or condo value ($ change since 2000)
Mean house or condo value by units in structure - 1, detached ($)
Mean house or condo value by units in structure - 1, attached ($)
Mean house or condo value by units in structure - 2 ($)
Mean house or condo value by units in structure by units in structure - 3 or 4 ($)
Mean house or condo value by units in structure - 5 or more ($)
Mean house or condo value by units in structure - Boat, RV, van, etc. ($)
Mean house or condo value by units in structure - Mobile home ($)
Median house or condo value ($) - White
Median house or condo value ($) - Black or African American
Median house or condo value ($) - Asian
Median house or condo value ($) - Hispanic or Latino
Median house or condo value ($) - American Indian and Alaska Native
Median house or condo value ($) - Multirace
Median house or condo value ($) - Other Race
Median resident age
Resident age diversity
Median resident age - Males
Median resident age - Females
Median resident age - White
Median resident age - Black or African American
Median resident age - Asian
Median resident age - Hispanic or Latino
Median resident age - American Indian and Alaska Native
Median resident age - Multirace
Median resident age - Other Race
Median resident age - Males - White
Median resident age - Males - Black or African American
Median resident age - Males - Asian
Median resident age - Males - Hispanic or Latino
Median resident age - Males - American Indian and Alaska Native
Median resident age - Males - Multirace
Median resident age - Males - Other Race
Median resident age - Females - White
Median resident age - Females - Black or African American
Median resident age - Females - Asian
Median resident age - Females - Hispanic or Latino
Median resident age - Females - American Indian and Alaska Native
Median resident age - Females - Multirace
Median resident age - Females - Other Race
Commute - mean travel time to work (minutes)
Travel time to work - Less than 5 minutes (%)
Travel time to work - Less than 5 minutes (% change since 2000)
Travel time to work - 5 to 9 minutes (%)
Travel time to work - 5 to 9 minutes (% change since 2000)
Travel time to work - 10 to 19 minutes (%)
Travel time to work - 10 to 19 minutes (% change since 2000)
Travel time to work - 20 to 29 minutes (%)
Travel time to work - 20 to 29 minutes (% change since 2000)
Travel time to work - 30 to 39 minutes (%)
Travel time to work - 30 to 39 minutes (% change since 2000)
Travel time to work - 40 to 59 minutes (%)
Travel time to work - 40 to 59 minutes (% change since 2000)
Travel time to work - 60 to 89 minutes (%)
Travel time to work - 60 to 89 minutes (% change since 2000)
Travel time to work - 90 or more minutes (%)
Travel time to work - 90 or more minutes (% change since 2000)
Marital status - Never married (%)
Marital status - Now married (%)
Marital status - Separated (%)
Marital status - Widowed (%)
Marital status - Divorced (%)
Median family income ($)
Median family income (% change since 2000)
Median non-family income ($)
Median non-family income (% change since 2000)
Median per capita income ($)
Median per capita income (% change since 2000)
Median family income ($) - White
Median family income ($) - Black or African American
Median family income ($) - Asian
Median family income ($) - Hispanic or Latino
Median family income ($) - American Indian and Alaska Native
Median family income ($) - Multirace
Median family income ($) - Other Race
Median year house/condo built
Median year apartment built
Year house built - Built 2005 or later (%)
Year house built - Built 2000 to 2004 (%)
Year house built - Built 1990 to 1999 (%)
Year house built - Built 1980 to 1989 (%)
Year house built - Built 1970 to 1979 (%)
Year house built - Built 1960 to 1969 (%)
Year house built - Built 1950 to 1959 (%)
Year house built - Built 1940 to 1949 (%)
Year house built - Built 1939 or earlier (%)
Average household size
Household density (households per square mile)
Average household size - White
Average household size - Black or African American
Average household size - Asian
Average household size - Hispanic or Latino
Average household size - American Indian and Alaska Native
Average household size - Multirace
Average household size - Other Race
Occupied housing units (%)
Vacant housing units (%)
Owner occupied housing units (%)
Renter occupied housing units (%)
Vacancy status - For rent (%)
Vacancy status - For sale only (%)
Vacancy status - Rented or sold, not occupied (%)
Vacancy status - For seasonal, recreational, or occasional use (%)
Vacancy status - For migrant workers (%)
Vacancy status - Other vacant (%)
Residents with income below the poverty level (%)
Residents with income below 50% of the poverty level (%)
Children below poverty level (%)
Poor families by family type - Married-couple family (%)
Poor families by family type - Male, no wife present (%)
Poor families by family type - Female, no husband present (%)
Poverty status for native-born residents (%)
Poverty status for foreign-born residents (%)
Poverty among high school graduates not in families (%)
Poverty among people who did not graduate high school not in families (%)
Residents with income below the poverty level (%) - White
Residents with income below the poverty level (%) - Black or African American
Residents with income below the poverty level (%) - Asian
Residents with income below the poverty level (%) - Hispanic or Latino
Residents with income below the poverty level (%) - American Indian and Alaska Native
Residents with income below the poverty level (%) - Multirace
Residents with income below the poverty level (%) - Other Race
Air pollution - Air Quality Index (AQI)
Air pollution - CO
Air pollution - NO2
Air pollution - SO2
Air pollution - Ozone
Air pollution - PM10
Air pollution - PM25
Air pollution - Pb
Crime - Murders per 100,000 population
Crime - Rapes per 100,000 population
Crime - Robberies per 100,000 population
Crime - Assaults per 100,000 population
Crime - Burglaries per 100,000 population
Crime - Thefts per 100,000 population
Crime - Auto thefts per 100,000 population
Crime - Arson per 100,000 population
Crime - City-data.com crime index
Crime - Violent crime index
Crime - Property crime index
Crime - Murders per 100,000 population (5 year average)
Crime - Rapes per 100,000 population (5 year average)
Crime - Robberies per 100,000 population (5 year average)
Crime - Assaults per 100,000 population (5 year average)
Crime - Burglaries per 100,000 population (5 year average)
Crime - Thefts per 100,000 population (5 year average)
Crime - Auto thefts per 100,000 population (5 year average)
Crime - Arson per 100,000 population (5 year average)
Crime - City-data.com crime index (5 year average)
Crime - Violent crime index (5 year average)
Crime - Property crime index (5 year average)
1996 Presidential Elections Results (%) - Democratic Party (Clinton)
1996 Presidential Elections Results (%) - Republican Party (Dole)
1996 Presidential Elections Results (%) - Other
2000 Presidential Elections Results (%) - Democratic Party (Gore)
2000 Presidential Elections Results (%) - Republican Party (Bush)
2000 Presidential Elections Results (%) - Other
2004 Presidential Elections Results (%) - Democratic Party (Kerry)
2004 Presidential Elections Results (%) - Republican Party (Bush)
2004 Presidential Elections Results (%) - Other
2008 Presidential Elections Results (%) - Democratic Party (Obama)
2008 Presidential Elections Results (%) - Republican Party (McCain)
2008 Presidential Elections Results (%) - Other
2012 Presidential Elections Results (%) - Democratic Party (Obama)
2012 Presidential Elections Results (%) - Republican Party (Romney)
2012 Presidential Elections Results (%) - Other
2016 Presidential Elections Results (%) - Democratic Party (Clinton)
2016 Presidential Elections Results (%) - Republican Party (Trump)
2016 Presidential Elections Results (%) - Other
2020 Presidential Elections Results (%) - Democratic Party (Biden)
2020 Presidential Elections Results (%) - Republican Party (Trump)
2020 Presidential Elections Results (%) - Other
Ancestries Reported - Arab (%)
Ancestries Reported - Czech (%)
Ancestries Reported - Danish (%)
Ancestries Reported - Dutch (%)
Ancestries Reported - English (%)
Ancestries Reported - French (%)
Ancestries Reported - French Canadian (%)
Ancestries Reported - German (%)
Ancestries Reported - Greek (%)
Ancestries Reported - Hungarian (%)
Ancestries Reported - Irish (%)
Ancestries Reported - Italian (%)
Ancestries Reported - Lithuanian (%)
Ancestries Reported - Norwegian (%)
Ancestries Reported - Polish (%)
Ancestries Reported - Portuguese (%)
Ancestries Reported - Russian (%)
Ancestries Reported - Scotch-Irish (%)
Ancestries Reported - Scottish (%)
Ancestries Reported - Slovak (%)
Ancestries Reported - Subsaharan African (%)
Ancestries Reported - Swedish (%)
Ancestries Reported - Swiss (%)
Ancestries Reported - Ukrainian (%)
Ancestries Reported - United States (%)
Ancestries Reported - Welsh (%)
Ancestries Reported - West Indian (%)
Ancestries Reported - Other (%)
Educational Attainment - No schooling completed (%)
Educational Attainment - Less than high school (%)
Educational Attainment - High school or equivalent (%)
Educational Attainment - Less than 1 year of college (%)
Educational Attainment - 1 or more years of college (%)
Educational Attainment - Associate degree (%)
Educational Attainment - Bachelor's degree (%)
Educational Attainment - Master's degree (%)
Educational Attainment - Professional school degree (%)
Educational Attainment - Doctorate degree (%)
School Enrollment - Nursery, preschool (%)
School Enrollment - Kindergarten (%)
School Enrollment - Grade 1 to 4 (%)
School Enrollment - Grade 5 to 8 (%)
School Enrollment - Grade 9 to 12 (%)
School Enrollment - College undergrad (%)
School Enrollment - Graduate or professional (%)
School Enrollment - Not enrolled in school (%)
School enrollment - Public schools (%)
School enrollment - Private schools (%)
School enrollment - Not enrolled (%)
Median number of rooms in houses and condos
Median number of rooms in apartments
Housing units lacking complete plumbing facilities (%)
Housing units lacking complete kitchen facilities (%)
Density of houses
Urban houses (%)
Rural houses (%)
Households with people 60 years and over (%)
Households with people 65 years and over (%)
Households with people 75 years and over (%)
Households with one or more nonrelatives (%)
Households with no nonrelatives (%)
Population in households (%)
Family households (%)
Nonfamily households (%)
Population in families (%)
Family households with own children (%)
Median number of bedrooms in owner occupied houses
Mean number of bedrooms in owner occupied houses
Median number of bedrooms in renter occupied houses
Mean number of bedrooms in renter occupied houses
Median number of vehichles in owner occupied houses
Mean number of vehichles in owner occupied houses
Median number of vehichles in renter occupied houses
Mean number of vehichles in renter occupied houses
Mortgage status - with mortgage (%)
Mortgage status - with second mortgage (%)
Mortgage status - with home equity loan (%)
Mortgage status - with both second mortgage and home equity loan (%)
Mortgage status - without a mortgage (%)
Average family size
Average family size - White
Average family size - Black or African American
Average family size - Asian
Average family size - Hispanic or Latino
Average family size - American Indian and Alaska Native
Average family size - Multirace
Average family size - Other Race
Geographical mobility - Same house 1 year ago (%)
Geographical mobility - Moved within same county (%)
Geographical mobility - Moved from different county within same state (%)
Geographical mobility - Moved from different state (%)
Geographical mobility - Moved from abroad (%)
Place of birth - Born in state of residence (%)
Place of birth - Born in other state (%)
Place of birth - Native, outside of US (%)
Place of birth - Foreign born (%)
Housing units in structures - 1, detached (%)
Housing units in structures - 1, attached (%)
Housing units in structures - 2 (%)
Housing units in structures - 3 or 4 (%)
Housing units in structures - 5 to 9 (%)
Housing units in structures - 10 to 19 (%)
Housing units in structures - 20 to 49 (%)
Housing units in structures - 50 or more (%)
Housing units in structures - Mobile home (%)
Housing units in structures - Boat, RV, van, etc. (%)
House/condo owner moved in on average (years ago)
Renter moved in on average (years ago)
Year householder moved into unit - Moved in 1999 to March 2000 (%)
Year householder moved into unit - Moved in 1995 to 1998 (%)
Year householder moved into unit - Moved in 1990 to 1994 (%)
Year householder moved into unit - Moved in 1980 to 1989 (%)
Year householder moved into unit - Moved in 1970 to 1979 (%)
Year householder moved into unit - Moved in 1969 or earlier (%)
Means of transportation to work - Drove car alone (%)
Means of transportation to work - Carpooled (%)
Means of transportation to work - Public transportation (%)
Means of transportation to work - Bus or trolley bus (%)
Means of transportation to work - Streetcar or trolley car (%)
Means of transportation to work - Subway or elevated (%)
Means of transportation to work - Railroad (%)
Means of transportation to work - Ferryboat (%)
Means of transportation to work - Taxicab (%)
Means of transportation to work - Motorcycle (%)
Means of transportation to work - Bicycle (%)
Means of transportation to work - Walked (%)
Means of transportation to work - Other means (%)
Working at home (%)
Industry diversity
Most Common Industries - Agriculture, forestry, fishing and hunting, and mining (%)
Most Common Industries - Agriculture, forestry, fishing and hunting (%)
Most Common Industries - Mining, quarrying, and oil and gas extraction (%)
Most Common Industries - Construction (%)
Most Common Industries - Manufacturing (%)
Most Common Industries - Wholesale trade (%)
Most Common Industries - Retail trade (%)
Most Common Industries - Transportation and warehousing, and utilities (%)
Most Common Industries - Transportation and warehousing (%)
Most Common Industries - Utilities (%)
Most Common Industries - Information (%)
Most Common Industries - Finance and insurance, and real estate and rental and leasing (%)
Most Common Industries - Finance and insurance (%)
Most Common Industries - Real estate and rental and leasing (%)
Most Common Industries - Professional, scientific, and management, and administrative and waste management services (%)
Most Common Industries - Professional, scientific, and technical services (%)
Most Common Industries - Management of companies and enterprises (%)
Most Common Industries - Administrative and support and waste management services (%)
Most Common Industries - Educational services, and health care and social assistance (%)
Most Common Industries - Educational services (%)
Most Common Industries - Health care and social assistance (%)
Most Common Industries - Arts, entertainment, and recreation, and accommodation and food services (%)
Most Common Industries - Arts, entertainment, and recreation (%)
Most Common Industries - Accommodation and food services (%)
Most Common Industries - Other services, except public administration (%)
Most Common Industries - Public administration (%)
Occupation diversity
Most Common Occupations - Management, business, science, and arts occupations (%)
Most Common Occupations - Management, business, and financial occupations (%)
Most Common Occupations - Management occupations (%)
Most Common Occupations - Business and financial operations occupations (%)
Most Common Occupations - Computer, engineering, and science occupations (%)
Most Common Occupations - Computer and mathematical occupations (%)
Most Common Occupations - Architecture and engineering occupations (%)
Most Common Occupations - Life, physical, and social science occupations (%)
Most Common Occupations - Education, legal, community service, arts, and media occupations (%)
Most Common Occupations - Community and social service occupations (%)
Most Common Occupations - Legal occupations (%)
Most Common Occupations - Education, training, and library occupations (%)
Most Common Occupations - Arts, design, entertainment, sports, and media occupations (%)
Most Common Occupations - Healthcare practitioners and technical occupations (%)
Most Common Occupations - Health diagnosing and treating practitioners and other technical occupations (%)
Most Common Occupations - Health technologists and technicians (%)
Most Common Occupations - Service occupations (%)
Most Common Occupations - Healthcare support occupations (%)
Most Common Occupations - Protective service occupations (%)
Most Common Occupations - Fire fighting and prevention, and other protective service workers including supervisors (%)
Most Common Occupations - Law enforcement workers including supervisors (%)
Most Common Occupations - Food preparation and serving related occupations (%)
Most Common Occupations - Building and grounds cleaning and maintenance occupations (%)
Most Common Occupations - Personal care and service occupations (%)
Most Common Occupations - Sales and office occupations (%)
Most Common Occupations - Sales and related occupations (%)
Most Common Occupations - Office and administrative support occupations (%)
Most Common Occupations - Natural resources, construction, and maintenance occupations (%)
Most Common Occupations - Farming, fishing, and forestry occupations (%)
Most Common Occupations - Construction and extraction occupations (%)
Most Common Occupations - Installation, maintenance, and repair occupations (%)
Most Common Occupations - Production, transportation, and material moving occupations (%)
Most Common Occupations - Production occupations (%)
Most Common Occupations - Transportation occupations (%)
Most Common Occupations - Material moving occupations (%)
People in Group quarters - Institutionalized population (%)
People in Group quarters - Correctional institutions (%)
People in Group quarters - Federal prisons and detention centers (%)
People in Group quarters - Halfway houses (%)
People in Group quarters - Local jails and other confinement facilities (including police lockups) (%)
People in Group quarters - Military disciplinary barracks (%)
People in Group quarters - State prisons (%)
People in Group quarters - Other types of correctional institutions (%)
People in Group quarters - Nursing homes (%)
People in Group quarters - Hospitals/wards, hospices, and schools for the handicapped (%)
People in Group quarters - Hospitals/wards and hospices for chronically ill (%)
People in Group quarters - Hospices or homes for chronically ill (%)
People in Group quarters - Military hospitals or wards for chronically ill (%)
People in Group quarters - Other hospitals or wards for chronically ill (%)
People in Group quarters - Hospitals or wards for drug/alcohol abuse (%)
People in Group quarters - Mental (Psychiatric) hospitals or wards (%)
People in Group quarters - Schools, hospitals, or wards for the mentally retarded (%)
People in Group quarters - Schools, hospitals, or wards for the physically handicapped (%)
People in Group quarters - Institutions for the deaf (%)
People in Group quarters - Institutions for the blind (%)
People in Group quarters - Orthopedic wards and institutions for the physically handicapped (%)
People in Group quarters - Wards in general hospitals for patients who have no usual home elsewhere (%)
People in Group quarters - Wards in military hospitals for patients who have no usual home elsewhere (%)
People in Group quarters - Juvenile institutions (%)
People in Group quarters - Long-term care (%)
People in Group quarters - Homes for abused, dependent, and neglected children (%)
People in Group quarters - Residential treatment centers for emotionally disturbed children (%)
People in Group quarters - Training schools for juvenile delinquents (%)
People in Group quarters - Short-term care, detention or diagnostic centers for delinquent children (%)
People in Group quarters - Type of juvenile institution unknown (%)
People in Group quarters - Noninstitutionalized population (%)
People in Group quarters - College dormitories (includes college quarters off campus) (%)
People in Group quarters - Military quarters (%)
People in Group quarters - On base (%)
People in Group quarters - Barracks, unaccompanied personnel housing (UPH), (Enlisted/Officer), ;and similar group living quarters for military personnel (%)
People in Group quarters - Transient quarters for temporary residents (%)
People in Group quarters - Military ships (%)
People in Group quarters - Group homes (%)
People in Group quarters - Homes or halfway houses for drug/alcohol abuse (%)
People in Group quarters - Homes for the mentally ill (%)
People in Group quarters - Homes for the mentally retarded (%)
People in Group quarters - Homes for the physically handicapped (%)
People in Group quarters - Other group homes (%)
People in Group quarters - Religious group quarters (%)
People in Group quarters - Dormitories (%)
People in Group quarters - Agriculture workers' dormitories on farms (%)
People in Group quarters - Job Corps and vocational training facilities (%)
People in Group quarters - Other workers' dormitories (%)
People in Group quarters - Crews of maritime vessels (%)
People in Group quarters - Other nonhousehold living situations (%)
People in Group quarters - Other noninstitutional group quarters (%)
Residents speaking English at home (%)
Residents speaking English at home - Born in the United States (%)
Residents speaking English at home - Native, born elsewhere (%)
Residents speaking English at home - Foreign born (%)
Residents speaking Spanish at home (%)
Residents speaking Spanish at home - Born in the United States (%)
Residents speaking Spanish at home - Native, born elsewhere (%)
Residents speaking Spanish at home - Foreign born (%)
Residents speaking other language at home (%)
Residents speaking other language at home - Born in the United States (%)
Residents speaking other language at home - Native, born elsewhere (%)
Residents speaking other language at home - Foreign born (%)
Class of Workers - Employee of private company (%)
Class of Workers - Self-employed in own incorporated business (%)
Class of Workers - Private not-for-profit wage and salary workers (%)
Class of Workers - Local government workers (%)
Class of Workers - State government workers (%)
Class of Workers - Federal government workers (%)
Class of Workers - Self-employed workers in own not incorporated business and Unpaid family workers (%)
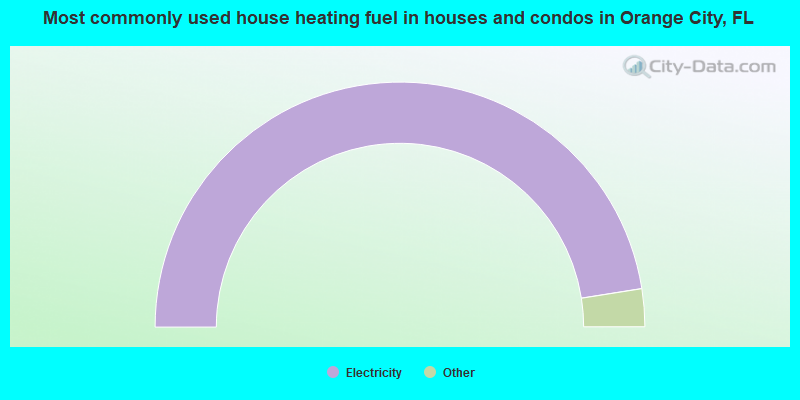
House heating fuel used in houses and condos - Utility gas (%)
House heating fuel used in houses and condos - Bottled, tank, or LP gas (%)
House heating fuel used in houses and condos - Electricity (%)
House heating fuel used in houses and condos - Fuel oil, kerosene, etc. (%)
House heating fuel used in houses and condos - Coal or coke (%)
House heating fuel used in houses and condos - Wood (%)
House heating fuel used in houses and condos - Solar energy (%)
House heating fuel used in houses and condos - Other fuel (%)
House heating fuel used in houses and condos - No fuel used (%)
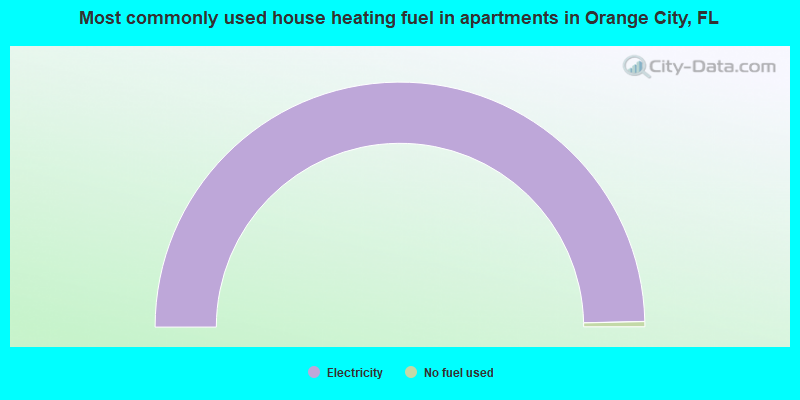
House heating fuel used in apartments - Utility gas (%)
House heating fuel used in apartments - Bottled, tank, or LP gas (%)
House heating fuel used in apartments - Electricity (%)
House heating fuel used in apartments - Fuel oil, kerosene, etc. (%)
House heating fuel used in apartments - Coal or coke (%)
House heating fuel used in apartments - Wood (%)
House heating fuel used in apartments - Solar energy (%)
House heating fuel used in apartments - Other fuel (%)
House heating fuel used in apartments - No fuel used (%)
Armed forces status - In Armed Forces (%)
Armed forces status - Civilian (%)
Armed forces status - Civilian - Veteran (%)
Armed forces status - Civilian - Nonveteran (%)
Fatal accidents locations in years 2005-2021
Fatal accidents locations in 2005
Fatal accidents locations in 2006
Fatal accidents locations in 2007
Fatal accidents locations in 2008
Fatal accidents locations in 2009
Fatal accidents locations in 2010
Fatal accidents locations in 2011
Fatal accidents locations in 2012
Fatal accidents locations in 2013
Fatal accidents locations in 2014
Fatal accidents locations in 2015
Fatal accidents locations in 2016
Fatal accidents locations in 2017
Fatal accidents locations in 2018
Fatal accidents locations in 2019
Fatal accidents locations in 2020
Fatal accidents locations in 2021
Alcohol use - People drinking some alcohol every month (%)
Alcohol use - People not drinking at all (%)
Alcohol use - Average days/month drinking alcohol
Alcohol use - Average drinks/week
Alcohol use - Average days/year people drink much
Audiometry - Average condition of hearing (%)
Audiometry - People that can hear a whisper from across a quiet room (%)
Audiometry - People that can hear normal voice from across a quiet room (%)
Audiometry - Ears ringing, roaring, buzzing (%)
Audiometry - Had a job exposure to loud noise (%)
Audiometry - Had off-work exposure to loud noise (%)
Blood Pressure & Cholesterol - Has high blood pressure (%)
Blood Pressure & Cholesterol - Checking blood pressure at home (%)
Blood Pressure & Cholesterol - Frequently checking blood cholesterol (%)
Blood Pressure & Cholesterol - Has high cholesterol level (%)
Consumer Behavior - Money monthly spent on food at supermarket/grocery store
Consumer Behavior - Money monthly spent on food at other stores
Consumer Behavior - Money monthly spent on eating out
Consumer Behavior - Money monthly spent on carryout/delivered foods
Consumer Behavior - Income spent on food at supermarket/grocery store (%)
Consumer Behavior - Income spent on food at other stores (%)
Consumer Behavior - Income spent on eating out (%)
Consumer Behavior - Income spent on carryout/delivered foods (%)
Current Health Status - General health condition (%)
Current Health Status - Blood donors (%)
Current Health Status - Has blood ever tested for HIV virus (%)
Current Health Status - Left-handed people (%)
Dermatology - People using sunscreen (%)
Diabetes - Diabetics (%)
Diabetes - Had a blood test for high blood sugar (%)
Diabetes - People taking insulin (%)
Diet Behavior & Nutrition - Diet health (%)
Diet Behavior & Nutrition - Milk product consumption (# of products/month)
Diet Behavior & Nutrition - Meals not home prepared (#/week)
Diet Behavior & Nutrition - Meals from fast food or pizza place (#/week)
Diet Behavior & Nutrition - Ready-to-eat foods (#/month)
Diet Behavior & Nutrition - Frozen meals/pizza (#/month)
Drug Use - People that ever used marijuana or hashish (%)
Drug Use - Ever used hard drugs (%)
Drug Use - Ever used any form of cocaine (%)
Drug Use - Ever used heroin (%)
Drug Use - Ever used methamphetamine (%)
Health Insurance - People covered by health insurance (%)
Kidney Conditions-Urology - Avg. # of times urinating at night
Medical Conditions - People with asthma (%)
Medical Conditions - People with anemia (%)
Medical Conditions - People with psoriasis (%)
Medical Conditions - People with overweight (%)
Medical Conditions - Elderly people having difficulties in thinking or remembering (%)
Medical Conditions - People who ever received blood transfusion (%)
Medical Conditions - People having trouble seeing even with glass/contacts (%)
Medical Conditions - People with arthritis (%)
Medical Conditions - People with gout (%)
Medical Conditions - People with congestive heart failure (%)
Medical Conditions - People with coronary heart disease (%)
Medical Conditions - People with angina pectoris (%)
Medical Conditions - People who ever had heart attack (%)
Medical Conditions - People who ever had stroke (%)
Medical Conditions - People with emphysema (%)
Medical Conditions - People with thyroid problem (%)
Medical Conditions - People with chronic bronchitis (%)
Medical Conditions - People with any liver condition (%)
Medical Conditions - People who ever had cancer or malignancy (%)
Mental Health - People who have little interest in doing things (%)
Mental Health - People feeling down, depressed, or hopeless (%)
Mental Health - People who have trouble sleeping or sleeping too much (%)
Mental Health - People feeling tired or having little energy (%)
Mental Health - People with poor appetite or overeating (%)
Mental Health - People feeling bad about themself (%)
Mental Health - People who have trouble concentrating on things (%)
Mental Health - People moving or speaking slowly or too fast (%)
Mental Health - People having thoughts they would be better off dead (%)
Oral Health - Average years since last visit a dentist
Oral Health - People embarrassed because of mouth (%)
Oral Health - People with gum disease (%)
Oral Health - General health of teeth and gums (%)
Oral Health - Average days a week using dental floss/device
Oral Health - Average days a week using mouthwash for dental problem
Oral Health - Average number of teeth
Pesticide Use - Households using pesticides to control insects (%)
Pesticide Use - Households using pesticides to kill weeds (%)
Physical Activity - People doing vigorous-intensity work activities (%)
Physical Activity - People doing moderate-intensity work activities (%)
Physical Activity - People walking or bicycling (%)
Physical Activity - People doing vigorous-intensity recreational activities (%)
Physical Activity - People doing moderate-intensity recreational activities (%)
Physical Activity - Average hours a day doing sedentary activities
Physical Activity - Average hours a day watching TV or videos
Physical Activity - Average hours a day using computer
Physical Functioning - People having limitations keeping them from working (%)
Physical Functioning - People limited in amount of work they can do (%)
Physical Functioning - People that need special equipment to walk (%)
Physical Functioning - People experiencing confusion/memory problems (%)
Physical Functioning - People requiring special healthcare equipment (%)
Prescription Medications - Average number of prescription medicines taking
Preventive Aspirin Use - Adults 40+ taking low-dose aspirin (%)
Reproductive Health - Vaginal deliveries (%)
Reproductive Health - Cesarean deliveries (%)
Reproductive Health - Deliveries resulted in a live birth (%)
Reproductive Health - Pregnancies resulted in a delivery (%)
Reproductive Health - Women breastfeeding newborns (%)
Reproductive Health - Women that had a hysterectomy (%)
Reproductive Health - Women that had both ovaries removed (%)
Reproductive Health - Women that have ever taken birth control pills (%)
Reproductive Health - Women taking birth control pills (%)
Reproductive Health - Women that have ever used Depo-Provera or injectables (%)
Reproductive Health - Women that have ever used female hormones (%)
Sexual Behavior - People 18+ that ever had sex (vaginal, anal, or oral) (%)
Sexual Behavior - Males 18+ that ever had vaginal sex with a woman (%)
Sexual Behavior - Males 18+ that ever performed oral sex on a woman (%)
Sexual Behavior - Males 18+ that ever had anal sex with a woman (%)
Sexual Behavior - Males 18+ that ever had any sex with a man (%)
Sexual Behavior - Females 18+ that ever had vaginal sex with a man (%)
Sexual Behavior - Females 18+ that ever performed oral sex on a man (%)
Sexual Behavior - Females 18+ that ever had anal sex with a man (%)
Sexual Behavior - Females 18+ that ever had any kind of sex with a woman (%)
Sexual Behavior - Average age people first had sex
Sexual Behavior - Average number of female sex partners in lifetime (males 18+)
Sexual Behavior - Average number of female vaginal sex partners in lifetime (males 18+)
Sexual Behavior - Average age people first performed oral sex on a woman (18+)
Sexual Behavior - Average number of woman performed oral sex on in lifetime (18+)
Sexual Behavior - Average number of male sex partners in lifetime (males 18+)
Sexual Behavior - Average number of male anal sex partners in lifetime (males 18+)
Sexual Behavior - Average age people first performed oral sex on a man (18+)
Sexual Behavior - Average number of male oral sex partners in lifetime (18+)
Sexual Behavior - People using protection when performing oral sex (%)
Sexual Behavior - Average number of times people have vaginal or anal sex a year
Sexual Behavior - People having sex without condom (%)
Sexual Behavior - Average number of male sex partners in lifetime (females 18+)
Sexual Behavior - Average number of male vaginal sex partners in lifetime (females 18+)
Sexual Behavior - Average number of female sex partners in lifetime (females 18+)
Sexual Behavior - Circumcised males 18+ (%)
Sleep Disorders - Average hours sleeping at night
Sleep Disorders - People that has trouble sleeping (%)
Smoking-Cigarette Use - People smoking cigarettes (%)
Taste & Smell - People 40+ having problems with smell (%)
Taste & Smell - People 40+ having problems with taste (%)
Taste & Smell - People 40+ that ever had wisdom teeth removed (%)
Taste & Smell - People 40+ that ever had tonsils teeth removed (%)
Taste & Smell - People 40+ that ever had a loss of consciousness because of a head injury (%)
Taste & Smell - People 40+ that ever had a broken nose or other serious injury to face or skull (%)
Taste & Smell - People 40+ that ever had two or more sinus infections (%)
Weight - Average height (inches)
Weight - Average weight (pounds)
Weight - Average BMI
Weight - People that are obese (%)
Weight - People that ever were obese (%)
Weight - People trying to lose weight (%)
Officers per 1,000 residents here:
1.87Florida average:
2.33
Latest news from Orange City, FL collected exclusively by city-data.com from local newspapers, TV, and radio stations
Ancestries: American (9.6%), Irish (8.0%), Italian (3.2%), German (2.8%), Jamaican (2.3%), English (1.7%).
Current Local Time:
Land area: 6.05 square miles.
Population density: 2,462 people per square mile (low).
808 residents are foreign born (4.5% Latin America , 0.8% Europe ).
This city:
5.9%Florida:
21.1%
Median real estate property taxes paid for housing units with mortgages in 2022: $3,267 (1.0%)Median real estate property taxes paid for housing units with no mortgage in 2022: $1,177 (0.8%)
Nearest city with pop. 50,000+: Deltona, FL
Nearest city with pop. 200,000+: Jacksonville, FL
Nearest city with pop. 1,000,000+: Philadelphia, PA
Nearest cities:
Latitude: 28.94 N, Longitude: 81.29 W
Daytime population change due to commuting: +4,538 (+33.0%)Workers who live and work in this city: 1,573 (25.3%)
Orange City tourist attractions:
Single-family new house construction building permits:
2022: 7 buildings , average cost: $335,8002021: 69 buildings , average cost: $317,5002020: 190 buildings , average cost: $273,8002019: 138 buildings , average cost: $250,9002018: 64 buildings , average cost: $20,1002017: 13 buildings , average cost: $288,1002016: 24 buildings , average cost: $265,2002015: 4 buildings , average cost: $283,5002014: 2 buildings , average cost: $346,8002013: 12 buildings , average cost: $274,8002012: 10 buildings , average cost: $320,0002011: 4 buildings , average cost: $250,5002010: 9 buildings , average cost: $240,8002009: 5 buildings , average cost: $251,4002008: 16 buildings , average cost: $299,0002007: 19 buildings , average cost: $263,1002006: 60 buildings , average cost: $257,4002005: 253 buildings , average cost: $176,4002004: 60 buildings , average cost: $106,6002003: 63 buildings , average cost: $113,5002002: 33 buildings , average cost: $98,0002001: 18 buildings , average cost: $85,2002000: 28 buildings , average cost: $107,2001999: 28 buildings , average cost: $111,9001998: 33 buildings , average cost: $92,8001997: 24 buildings , average cost: $100,100Unemployment in December 2023:
Most common occupations in Orange City, FL (%)
Both Males Females
Other sales and related occupations, including supervisors (6.9%)
Building and grounds cleaning and maintenance occupations (5.6%)
Retail sales workers, except cashiers (4.9%)
Other office and administrative support workers, including supervisors (4.5%)
Secretaries and administrative assistants (3.7%)
Other production occupations, including supervisors (3.3%)
Other management occupations, except farmers and farm managers (3.2%)
Building and grounds cleaning and maintenance occupations (6.4%)
Electrical equipment mechanics and other installation, maintenance, and repair workers, including supervisors (5.4%)
Vehicle and mobile equipment mechanics, installers, and repairers (5.4%)
Driver/sales workers and truck drivers (5.3%)
Other production occupations, including supervisors (5.2%)
Retail sales workers, except cashiers (4.6%)
Laborers and material movers, hand (4.3%)
Other sales and related occupations, including supervisors (11.4%)
Secretaries and administrative assistants (7.2%)
Other office and administrative support workers, including supervisors (6.8%)
Retail sales workers, except cashiers (5.1%)
Building and grounds cleaning and maintenance occupations (4.9%)
Other management occupations, except farmers and farm managers (3.6%)
Bookkeeping, accounting, and auditing clerks (3.5%)
Tornado activity:
Orange City-area historical tornado activity is slightly above Florida state average. It is 32% greater than the overall U.S. average.
On 2/22/1998, a category F3 (max. wind speeds 158-206 mph) tornado 13.0 miles away from the Orange City city center killed 13 people and injured 36 people and caused $31 million in damages.
On 2/2/2007, a category F3 tornado 18.0 miles away from the city center killed 13 people and injured 51 people and caused $98 million in damages.
Earthquake activity:
Orange City-area historical earthquake activity is significantly above Florida state average. It is 88% smaller than the overall U.S. average. On 9/10/2006 at 14:56:08, a magnitude 5.9 (5.9 MB, 5.5 MS, 5.8 MW, Class: Moderate, Intensity: VI - VII) earthquake occurred 376.3 miles away from Orange City center On 11/22/1974 at 05:25:55, a magnitude 4.7 (4.7 MB, Class: Light, Intensity: IV - V) earthquake occurred 282.2 miles away from Orange City center On 9/4/2016 at 18:29:29, a magnitude 3.8 (3.8 ML, Class: Light, Intensity: II - III) earthquake occurred 132.2 miles away from Orange City center On 6/23/2016 at 17:20:29, a magnitude 3.8 (3.8 ML) earthquake occurred 132.8 miles away from Orange City center On 9/21/2016 at 16:30:52, a magnitude 3.8 (3.8 ML) earthquake occurred 133.2 miles away from the city center On 6/10/2016 at 17:10:48, a magnitude 3.7 (3.7 MB) earthquake occurred 124.9 miles away from the city center Magnitude types: body-wave magnitude (MB), local magnitude (ML), surface-wave magnitude (MS), moment magnitude (MW) Natural disasters: The number of natural disasters in Volusia County (27) is a lot greater than the US average (15).Major Disasters (Presidential) Declared: 17Emergencies Declared: 5Hurricanes: 13, Tornadoes: 7, Floods: 6, Storms: 5, Tropical Storms: 4, Fires: 3, Winds: 2, Freeze: 1, Heavy Rain: 1, Other: 1 (Note: some incidents may be assigned to more than one category). Hospitals and medical centers in Orange City: FLORIDA HOSPITAL FISH MEMORIAL (Voluntary non-profit - Church, provides emergency services, 1055 SAXON BLVD) JOHN KNOX VILLAGE MEDICAL CENTER-ORANGE CITY (901 VETERAN'S MEMORIAL PARKWAY)
ORANGE CITY DIALYSIS (242 TREEMONT DR BLDG II)
FLORIDA HOSPITAL VOLUSIA HOME CARE SERVICES (1061 MEDICAL CENTER DRIVE, SUITE 202)
JOHN KNOX VILLAGE OF CENTRAL FLORIDA INC (101 NORTHLAKE DRIVE)
Heliports located in Orange City: Amtrak stations near Orange City: 7 miles: DELAND (2491 OLD NEW YORK AVE.) Services: ticket office, fully wheelchair accessible, enclosed waiting area, public restrooms, public payphones, vending machines, free short-term parking, free long-term parking, taxi stand.
10 miles: SANFORD (AUTO-TRAIN) (SANFORD, 600 PERSIMMON AVE.) Services: ticket office, fully wheelchair accessible, enclosed waiting area, public restrooms, public payphones, snack bar, free short-term parking.
10 miles: SANFORD (800 PERSIMMON AVE.) Services: enclosed waiting area, public restrooms, public payphones, vending machines, free short-term parking, free long-term parking, call for taxi service.
Colleges/universities with over 2000 students nearest to Orange City:
Stetson University (about 7 miles; DeLand, FL ; Full-time enrollment: 2,956)
Seminole State College of Florida (about 14 miles; Sanford, FL ; FT enrollment: 14,124)
Embry-Riddle Aeronautical University-Daytona Beach (about 23 miles; Daytona Beach, FL ; FT enrollment: 4,932)
Embry-Riddle Aeronautical University-Worldwide (about 23 miles; Daytona Beach, FL ; FT enrollment: 9,244)
Daytona State College (about 24 miles; Daytona Beach, FL ; FT enrollment: 11,389)
Full Sail University (about 24 miles; Winter Park, FL ; FT enrollment: 31,435)
University of Central Florida (about 25 miles; Orlando, FL ; FT enrollment: 51,457)
Public high schools in Orange City: UNIVERSITY HIGH SCHOOL Students: 1,116, Location: 1000 W RHODE ISLAND AVE, Grades: 9-12)ELEARNING WEST Location: 1000 W RHODE ISLAND AVE, Grades: 10-12)
Public elementary/middle schools in Orange City:
See full list of schools located in Orange City
Notable locations in Orange City: (A) , Pine Lakes Country Club (B) , Greater Orange City Chamber of Commerce (C) , Florida Hospital Fish Memorial Library (D) , Volusia County Public Library System Orange City Dickinson Memorial Library (E) , Orange City Fire Department (F) , Orange City Police Department (G) , Orange City Fire Department Station 68 (H) . Display/hide their locations on the map
Churches in Orange City include: (A) , United Church of Christ (B) , Saint Judes Episcopal Church (C) , Orange City United Methodist Church (D) , New Life Bible Church (E) , First Baptist Church of Orange City (F) , Faith Community Church of Central Florida (G) , Emmaus Lutheran Church (H) , Debary Orange City Seventh Day Adventist Church (I) . Display/hide their locations on the map
Swamps: (A) . Display/hide its location on the map
Tourist attractions:
Hotels:
Volusia County has a predicted average indoor radon screening level less than 2 pCi/L (pico curies per liter) - Low Potential Drinking water stations with addresses in Orange City that have no violations reported:
VALENTINE PARK (Population served: 50, Primary Water Source Type: Groundwater)
Average household size: This city:
2.1 peopleFlorida:
2.5 people
Percentage of family households: This city:
56.1%Whole state:
65.2%
Percentage of households with unmarried partners: This city:
7.5%Whole state:
7.3%
Likely homosexual households (counted as self-reported same-sex unmarried-partner households)
Lesbian couples: 0.5% of all households Gay men: 0.2% of all households
251 people in nursing facilities/skilled-nursing facilities in 2010people in group homes intended for adults in 2010people in nursing homes in 2000
Banks with most branches in Orange City (2011 data):
Mainstreet Community Bank of Florida: John Knox Village Branch at 101 Northlake Drive, branch established on 2010/10/04; Orange City Office Branch at 850 South Volusia Ave, branch established on 2006/04/03. Info updated 2006/11/03: Bank assets: $205.4 mil, Deposits: $181.3 mil, headquarters in Deland, FL, positive income , Commercial Lending Specialization, 4 total offices
TD Bank, National Association: Orange City Branch at 865 Saxon Boulevard, branch established on 2005/01/10; Volusia Ave Branch at 2240 S Volusia Ave, branch established on 2006/08/18. Info updated 2010/10/04: Bank assets: $188,912.6 mil, Deposits: $153,149.8 mil, headquarters in Wilmington, DE, positive income , 1314 total offices , Holding Company: Toronto-Dominion Bank, The
TrustCo Bank: Orange City Branch at 902 Saxon Blvd, branch established on 2007/02/09. Info updated 2011/07/21: Bank assets: $4,250.1 mil, Deposits: $3,736.0 mil, headquarters in Glenville, NY, positive income , Mortgage Lending Specialization, 135 total offices
Hancock Bank: Orange City Branch at 920 Saxon Blvd., branch established on 2002/02/04. Info updated 2011/06/14: Bank assets: $4,988.4 mil, Deposits: $4,121.5 mil, headquarters in Gulfport, MS, positive income , Commercial Lending Specialization, 81 total offices , Holding Company: Hancock Holding Company
SunTrust Bank: Enterprise Road Branch at 2602 Enterprise Road, branch established on 1990/05/14. Info updated 2010/05/27: Bank assets: $171,291.7 mil, Deposits: $129,833.2 mil, headquarters in Atlanta, GA, positive income , Commercial Lending Specialization, 1716 total offices , Holding Company: Suntrust Banks, Inc.
Wells Fargo Bank, National Association: Orange City Branch at 2502 Enterprise Road, branch established on 1977/08/20. Info updated 2011/04/05: Bank assets: $1,161,490.0 mil, Deposits: $905,653.0 mil, headquarters in Sioux Falls, SD, positive income , 6395 total offices , Holding Company: Wells Fargo & Company
Regions Bank: Orange City Branch at 2626 Enterprise Road, branch established on 2004/03/29. Info updated 2011/02/24: Bank assets: $123,368.2 mil, Deposits: $98,301.3 mil, headquarters in Birmingham, AL, positive income , Commercial Lending Specialization, 1778 total offices , Holding Company: Regions Financial Corporation
First Southern Bank: West Volusia Office Branch at 2494 Enterprise Road, branch established on 2007/02/20. Info updated 2011/01/10: Bank assets: $959.5 mil, Deposits: $791.5 mil, headquarters in Boca Raton, FL, positive income , Commercial Lending Specialization, 15 total offices , Holding Company: First Southern Bancorp, Inc.
Branch Banking and Trust Company: Orange City Branch at 955 Saxon Blvd, branch established on 2004/03/15. Info updated 2010/03/29: Bank assets: $168,867.6 mil, Deposits: $127,549.5 mil, headquarters in Winston Salem, NC, positive income , Commercial Lending Specialization, 1793 total offices , Holding Company: Bb&T Corporation
5 other banks with 5 local branches
For population 15 years and over in Orange City:
Never married: 25.5%Now married: 47.4%Separated: 2.2%Widowed: 8.4%Divorced: 16.5% For population 25 years and over in Orange City:
High school or higher: 90.3%Bachelor's degree or higher: 25.1%Graduate or professional degree: 9.6%Unemployed: 5.4%Mean travel time to work (commute): 23.7 minutes
Education Gini index (Inequality in education) Here:
10.9Florida average:
12.2
Religion statistics for Orange City, FL (based on Volusia County data)
Religion Adherents Congregations Evangelical Protestant 78,423 255 Catholic 50,934 15 Mainline Protestant 29,546 77 Other 7,075 39 Black Protestant 5,253 34 Orthodox 1,206 5 None 322,156 -
Source: Clifford Grammich, Kirk Hadaway, Richard Houseal, Dale E.Jones, Alexei Krindatch, Richie Stanley and Richard H.Taylor. 2012. 2010 U.S.Religion Census: Religious Congregations & Membership Study. Association of Statisticians of American Religious Bodies. Jones, Dale E., et al. 2002. Congregations and Membership in the United States 2000. Nashville, TN: Glenmary Research Center. Graphs represent county-level data
Food Environment Statistics: Number of grocery stores : 90Volusia County :
1.80 / 10,000 pop.Florida :
2.04 / 10,000 pop.
Number of supercenters and club stores : 6Here :
0.12 / 10,000 pop.State :
0.11 / 10,000 pop.
Number of convenience stores (no gas) : 76Here :
1.52 / 10,000 pop.State :
1.28 / 10,000 pop.
Number of convenience stores (with gas) : 180This county :
3.60 / 10,000 pop.Florida :
3.04 / 10,000 pop.
Number of full-service restaurants : 375Volusia County :
7.50 / 10,000 pop.Florida :
7.45 / 10,000 pop.
Adult diabetes rate : Volusia County :
9.1%Florida :
9.2%
Adult obesity rate : Volusia County :
24.5%Florida :
23.7%
Low-income preschool obesity rate : Volusia County :
14.1%Florida :
14.0%
Health and Nutrition:
Average overall health of teeth and gums : Orange City:
50.4%Florida:
49.4%
People feeling badly about themselves : This city:
19.2%Florida:
19.5%
People not drinking alcohol at all : Orange City:
11.4%State:
10.7%
Average hours sleeping at night : Orange City:
7.0Florida:
6.9
Overweight people : This city:
36.4%Florida:
34.7%
General health condition : This city:
57.1%Florida:
57.0%
Average condition of hearing : Orange City:
75.6%Florida:
79.2%
More about Health and Nutrition of Orange City, FL Residents
Local government employment and payroll (March 2022)
Function
Full-time employees
Monthly full-time payroll
Average yearly full-time wage
Part-time employees
Monthly part-time payroll
Firefighters
35 $185,684 $63,663 1 $1,274 Police Protection - Officers
27 $146,614 $65,162 0 $0 Other Government Administration
19 $144,955 $91,551 0 $0 Water Supply
14 $63,193 $54,165 0 $0 Financial Administration
12 $60,284 $60,284 0 $0 Sewerage
6 $20,143 $40,286 0 $0 Streets and Highways
4 $26,256 $78,768 0 $0 Parks and Recreation
4 $16,312 $48,936 0 $0 Other and Unallocable
4 $28,675 $86,025 0 $0 Health
1 $5,559 $66,708 0 $0 Fire - Other
1 $5,973 $71,676 0 $0 Police - Other
1 $4,453 $53,436 0 $0
Totals for Government
128 $708,102 $66,385 1 $1,274
Orange City government finances - Expenditure in 2017 (per resident):
Construction - Regular Highways: $545,000 ($36.58)
Local Fire Protection: $504,000 ($33.83)General - Other: $275,000 ($18.46)Police Protection: $263,000 ($17.65)Parks and Recreation: $88,000 ($5.91)Current Operations - Local Fire Protection: $2,858,000 ($191.85)
Police Protection: $2,382,000 ($159.90)Water Utilities: $1,942,000 ($130.36)Regular Highways: $1,331,000 ($89.35)General - Other: $1,201,000 ($80.62)Central Staff Services: $1,125,000 ($75.52)Sewerage: $949,000 ($63.70)Financial Administration: $614,000 ($41.22)Solid Waste Management: $359,000 ($24.10)Protective Inspection and Regulation - Other: $290,000 ($19.47)Parks and Recreation: $289,000 ($19.40)Natural Resources - Other: $78,000 ($5.24)Other Capital Outlay - Water Utilities: $2,689,000 ($180.51)
Central Staff Services: $19,000 ($1.28)Financial Administration: $7,000 ($0.47)Water Utilities - Interest on Debt: $66,000 ($4.43)
Orange City government finances - Revenue in 2017 (per resident):
Charges - Sewerage: $1,458,000 ($97.87)
Natural Resources - Other: $554,000 ($37.19)Parks and Recreation: $13,000 ($0.87)Other: $3,000 ($0.20)Local Intergovernmental - Other: $73,000 ($4.90)
General Local Government Support: $11,000 ($0.74)Miscellaneous - Special Assessments: $556,000 ($37.32)
General Revenue - Other: $186,000 ($12.49)Donations From Private Sources: $60,000 ($4.03)Fines and Forfeits: $38,000 ($2.55)Interest Earnings: $10,000 ($0.67)Rents: $10,000 ($0.67)Revenue - Water Utilities: $2,983,000 ($200.24)
State Intergovernmental - General Local Government Support: $999,000 ($67.06)
Other: $449,000 ($30.14)Highways: $9,000 ($0.60)Tax - Property: $3,993,000 ($268.04)
Public Utilities Sales: $1,451,000 ($97.40)Occupation and Business License - Other: $1,358,000 ($91.16)Other License: $319,000 ($21.41)Motor Fuels Sales: $210,000 ($14.10)
Orange City government finances - Debt in 2017 (per resident):
Long Term Debt - Beginning Outstanding - Unspecified Public Purpose: $1,950,000 ($130.90)
Outstanding Unspecified Public Purpose: $1,665,000 ($111.77)Retired Unspecified Public Purpose: $285,000 ($19.13)
Orange City government finances - Cash and Securities in 2017 (per resident):
Other Funds - Cash and Securities: $14,368,000 ($964.49)
9.11% of this county's 2021 resident taxpayers lived in other counties in 2020 ($71,399 average adjusted gross income )
Here:
9.11%Florida average:
8.80%
0.04% of residents moved from foreign countries ($209 average AGI )Volusia County:
0.04%Florida average:
0.05%
Top counties from which taxpayers relocated into this county between 2020 and 2021:
6.49% of this county's 2020 resident taxpayers moved to other counties in 2021 ($53,189 average adjusted gross income )
Here:
6.49%Florida average:
7.45%
0.03% of residents moved to foreign countries ($332 average AGI )Volusia County:
0.03%Florida average:
0.04%
Top counties to which taxpayers relocated from this county between 2020 and 2021:
Businesses in Orange City, FL
Name Count Name Count
7-Eleven 1 Kmart 1 AMF Bowling 1 Kohl's 1 AT&T 2 LA Fitness 1 Ace Hardware 1 Lane Furniture 1 Advance Auto Parts 1 Long John Silver's 1 Applebee's 1 Lowe's 1 Arby's 1 MasterBrand Cabinets 2 AutoZone 1 McDonald's 1 Baskin-Robbins 1 Nike 2 Bed Bath & Beyond 1 Office Depot 1 Blockbuster 1 Olive Garden 1 Budget Car Rental 1 Papa John's Pizza 1 Burger King 1 Payless 1 CVS 1 Pizza Hut 1 Chick-Fil-A 1 Popeyes 1 Circle K 2 Publix Super Markets 1 Curves 1 Quality 1 Days Inn 1 Quiznos 1 Dennys 1 RadioShack 1 Domino's Pizza 1 Ruby Tuesday 1 Dunkin Donuts 1 Rue21 1 Famous Footwear 1 SONIC Drive-In 1 FedEx 5 Sprint Nextel 1 Firestone Complete Auto Care 1 Staples 1 Ford 1 Starbucks 1 GNC 1 Steak 'n Shake 1 GameStop 1 T-Mobile 2 Goodwill 1 Taco Bell 1 H&R Block 1 Target 1 Hobby Lobby 1 Tire Kingdom 1 Holiday Inn 1 U-Haul 2 Home Depot 1 UPS 4 Honda 1 Verizon Wireless 2 Jimmy John's 1 Walgreens 1 Justice 1 Walmart 1 KFC 1
Strongest AM radio stations in Orange City:
WYND (1310 AM; 8 kW; DELAND, FL; Owner: BUDDY TUCKER ASSOCIATION, INC.)
WONQ (1030 AM; 45 kW; OVIEDO, FL; Owner: FLORIDA BROADCASTERS)
WDYZ (990 AM; 50 kW; ORLANDO, FL; Owner: ABC, INC.)
WIXC (1060 AM; 50 kW; TITUSVILLE, FL; Owner: GENESIS COMMUNICATIONS I, INC.)
WQTM (740 AM; 50 kW; ORLANDO, FL; Owner: CLEAR CHANNEL BROADCASTING LICENSES, INC.)
WFLF (540 AM; 50 kW; PINE HILLS, FL; Owner: CLEAR CHANNEL BROADCASTING LICENSES, INC.)
WNDA (1490 AM; 1 kW; DELAND, FL; Owner: BLACK CROW RADIO, LLC)
WORL (660 AM; 5 kW; ALTAMONTE SPRINGS, FL; Owner: JAMES CRYSTAL ORLANDO, INC.)
WHOO (1080 AM; daytime; 35 kW; KISSIMMEE, FL; Owner: GENESIS COMMUNICATIONS I, INC.)
WDBO (580 AM; 5 kW; ORLANDO, FL; Owner: COX RADIO, INC.)
WTLN (950 AM; 12 kW; ORLANDO, FL; Owner: TM2, INC.)
WSDO (1400 AM; 1 kW; SANFORD, FL; Owner: J & V COMMUNICATIONS COMPANY)
WLAA (1680 AM; 10 kW; WINTER GARDEN, FL; Owner: RAMA COMMUNICATIONS, INC.)
Strongest FM radio stations in Orange City:
WMGF (107.7 FM; MOUNT DORA, FL; Owner: CLEAR CHANNEL BROADCASTING LICENSES, INC.)
WOCL (105.9 FM; DELAND, FL; Owner: INFINITY RADIO OPERATIONS INC.)
WCFB (94.5 FM; DAYTONA BEACH, FL; Owner: COX RADIO, INC.)
WJHM (101.9 FM; DAYTONA BEACH, FL; Owner: INFINITY RADIO OPERATIONS INC.)
WOMX-FM (105.1 FM; ORLANDO, FL; Owner: INFINITY RADIO OPERATIONS INC.)
WJRR (101.1 FM; COCOA BEACH, FL; Owner: CLEAR CHANNEL BROADCASTING LICENSES, INC.)
WSHE (100.3 FM; ORLANDO, FL; Owner: CLEAR CHANNEL BROADCASTING LICENSES, INC.)
WTKS-FM (104.1 FM; COCOA BEACH, FL; Owner: CLEAR CHANNEL BROADCASTING LICENSES, INC.)
WHTQ (96.5 FM; ORLANDO, FL; Owner: COX RADIO, INC.)
WPOZ (88.3 FM; UNION PARK, FL; Owner: CENTRAL FLORIDA EDUCATIONAL FOUNDATION, INC.)
WWKA (92.3 FM; ORLANDO, FL; Owner: COX RADIO, INC.)
WXXL (106.7 FM; TAVARES, FL; Owner: AMFM RADIO LICENSES, L.L.C.)
W247AK (97.3 FM; DELAND, FL; Owner: CORNERSTONE BROADCASTING CORPORATION)
WKTO (88.7 FM; EDGEWATER, FL; Owner: MIMS COMMUNITY RADIO, INC.)
WMFE-FM (90.7 FM; ORLANDO, FL; Owner: COMMUNITY COMMUNICATIONS, INC.)
WGNE-FM (99.9 FM; PALATKA, FL; Owner: RENDA BROADCASTING CORP. OF NEVADA)
WOGK (93.7 FM; OCALA, FL; Owner: OCALA BROADCASTING, L.L.C.)
WUCF-FM (89.9 FM; ORLANDO, FL; Owner: UNIVERSITY OF CENTRAL FLORIDA)
WPYO (95.3 FM; APOPKA, FL; Owner: CXR HOLDINGS, INC.)
WJLU (89.7 FM; NEW SMYRNA BEACH, FL; Owner: CORNERSTONE BROADCASTING CORPORATION)
TV broadcast stations around Orange City:
WESH (Channel 2; DAYTONA BEACH, FL; Owner: ORLANDO HEARST-ARGYLE TELEVISION, INC.)
WXXU-LP (Channel 12; ALTAMONTE SPRINGS, FL; Owner: RAMA COMMUNICATIONS)
WVEN-TV (Channel 26; DAYTONA BEACH, FL; Owner: ENTRAVISION HOLDINGS, LLC)
WCEU (Channel 15; NEW SMYRNA BEACH, FL; Owner: DAYTONA BEACH COMMUNITY COLLEGE)
WZXZ-CA (Channel 11; ORLANDO, ETC., FL; Owner: THE BOX WORLDWIDE LLC)
WFTV (Channel 9; ORLANDO, FL; Owner: WFTV-TV HOLDINGS, INC.)
WRBW (Channel 65; ORLANDO, FL; Owner: FOX TELEVISION STATIONS, INC.)
WKMG-TV (Channel 6; ORLANDO, FL; Owner: POST-NEWSWEEK STATIONS ORLANDO, INC.)
WACX (Channel 55; LEESBURG, FL; Owner: ASSOCIATED CHRISTIAN TELEVISION SYSTEM, INC.)
WKCF (Channel 18; CLERMONT, FL; Owner: EMMIS TELEVISION LICENSE CORPORATION)
WLCB-TV (Channel 45; LEESBURG, FL; Owner: GOOD LIFE BROADCASTING, INC.)
WOFL (Channel 35; ORLANDO, FL; Owner: FOX TELEVISION STATIONS, INC.)
WMFE-TV (Channel 24; ORLANDO, FL; Owner: COMMUNITY COMMUNICATIONS, INC.)
WRDQ (Channel 27; ORLANDO, FL; Owner: WFTV-TV HOLDINGS, INC.)
WTGL-TV (Channel 52; COCOA, FL; Owner: GOOD LIFE BROADCASTING, INC.)
WBCC (Channel 68; COCOA, FL; Owner: BREVARD COMMUNITY COLLEGE)
WPXB-LP (Channel 57; DAYTONA BEACH, FL; Owner: PAXSON COMMUNICATIONS LPTV, INC.)
WOKB-LP (Channel 7; ORLANDO, FL; Owner: RAMA COMMUNICATIONS)
W21AU (Channel 21; ORLANDO, FL; Owner: CENTRAL BROADCAST COMPANY)
W47AL (Channel 47; ORLANDO, FL; Owner: CONCILIO MISSION CRISTIANA FUENTE)
WPXG-LP (Channel 31; ORLANDO, FL; Owner: TIGER EYE BROADCASTING CORPORATION)
WRCF-LP (Channel 29; ORLANDO, FL; Owner: CHARLES S. NAMEY)
WDYB-LP (Channel 53; DAYTONA BEACH, FL; Owner: TIGER EYE BROADCASTING CORPORATION)
WVCI-LP (Channel 16; ORLANDO, FL; Owner: ENTRAVISION HOLDINGS, LLC)
National Bridge Inventory (NBI) Statistics 12 Number of bridges115ft / 34.9m Total length $340,000 Total costs420,047 Total average daily traffic44,600 Total average daily truck traffic
New bridges - historical statistics
3 1960-1969 6 1990-1999 2 2000-2009 1 2010-2019
See full National Bridge Inventory statistics for Orange City, FL
Home Mortgage Disclosure Act Aggregated Statistics For Year 2009(Based on 1 partial tract) A) FHA, FSA/RHS & VA B) Conventional C) Refinancings D) Home Improvement Loans E) Loans on Dwellings For 5+ Families F) Non-occupant Loans on G) Loans On Manufactured Number Average Value Number Average Value Number Average Value Number Average Value Number Average Value Number Average Value Number Average Value
LOANS ORIGINATED 20 $145,304 10 $100,593 27 $125,330 2 $28,865 1 $1,817,300 5 $100,592 1 $17,100 APPLICATIONS APPROVED, NOT ACCEPTED 3 $134,160 1 $134,690 3 $121,867 1 $5,880 0 $0 0 $0 2 $24,320 APPLICATIONS DENIED 5 $137,474 3 $161,777 23 $139,342 2 $4,810 0 $0 1 $53,450 2 $26,190 APPLICATIONS WITHDRAWN 2 $234,380 2 $84,720 11 $158,795 0 $0 0 $0 1 $131,490 0 $0 FILES CLOSED FOR INCOMPLETENESS 1 $81,780 0 $0 3 $236,427 0 $0 0 $0 0 $0 0 $0
Aggregated Statistics For Year 2008(Based on 1 partial tract) A) FHA, FSA/RHS & VA B) Conventional C) Refinancings D) Home Improvement Loans E) Loans on Dwellings For 5+ Families F) Non-occupant Loans on G) Loans On Manufactured Number Average Value Number Average Value Number Average Value Number Average Value Number Average Value Number Average Value Number Average Value
LOANS ORIGINATED 12 $158,658 16 $128,481 34 $141,391 3 $33,317 0 $0 4 $127,612 4 $29,398 APPLICATIONS APPROVED, NOT ACCEPTED 1 $88,190 1 $115,450 7 $168,520 1 $16,040 0 $0 0 $0 1 $45,970 APPLICATIONS DENIED 4 $122,268 5 $111,818 29 $149,900 6 $55,498 1 $125,610 2 $100,485 3 $29,753 APPLICATIONS WITHDRAWN 2 $87,125 0 $0 12 $158,925 1 $51,310 0 $0 1 $120,800 0 $0 FILES CLOSED FOR INCOMPLETENESS 0 $0 1 $94,610 4 $146,452 0 $0 0 $0 1 $229,300 0 $0
Aggregated Statistics For Year 2007(Based on 1 partial tract) A) FHA, FSA/RHS & VA B) Conventional C) Refinancings D) Home Improvement Loans E) Loans on Dwellings For 5+ Families F) Non-occupant Loans on G) Loans On Manufactured Number Average Value Number Average Value Number Average Value Number Average Value Number Average Value Number Average Value Number Average Value
LOANS ORIGINATED 5 $149,232 63 $159,417 66 $147,805 15 $68,131 1 $4,481,250 12 $151,709 11 $36,152 APPLICATIONS APPROVED, NOT ACCEPTED 0 $0 10 $140,520 16 $120,329 5 $66,920 0 $0 1 $250,150 3 $30,823 APPLICATIONS DENIED 0 $0 19 $128,674 55 $155,452 10 $144,315 0 $0 5 $159,068 7 $39,324 APPLICATIONS WITHDRAWN 1 $159,820 5 $215,296 27 $184,422 4 $107,168 0 $0 2 $132,825 0 $0 FILES CLOSED FOR INCOMPLETENESS 0 $0 5 $173,178 9 $149,184 0 $0 0 $0 1 $86,590 0 $0
Aggregated Statistics For Year 2006(Based on 1 partial tract) A) FHA, FSA/RHS & VA B) Conventional C) Refinancings D) Home Improvement Loans F) Non-occupant Loans on G) Loans On Manufactured Number Average Value Number Average Value Number Average Value Number Average Value Number Average Value Number Average Value
LOANS ORIGINATED 3 $213,800 134 $135,512 102 $145,263 24 $83,404 41 $125,868 10 $33,780 APPLICATIONS APPROVED, NOT ACCEPTED 0 $0 23 $121,866 18 $138,524 2 $44,095 6 $103,515 5 $41,156 APPLICATIONS DENIED 1 $138,440 40 $120,343 48 $158,290 10 $52,488 13 $138,353 7 $65,973 APPLICATIONS WITHDRAWN 1 $95,680 25 $192,634 41 $151,641 2 $110,105 3 $80,353 0 $0 FILES CLOSED FOR INCOMPLETENESS 1 $138,970 3 $169,437 5 $185,150 0 $0 1 $232,510 0 $0
Aggregated Statistics For Year 2005(Based on 1 partial tract) A) FHA, FSA/RHS & VA B) Conventional C) Refinancings D) Home Improvement Loans E) Loans on Dwellings For 5+ Families F) Non-occupant Loans on G) Loans On Manufactured Number Average Value Number Average Value Number Average Value Number Average Value Number Average Value Number Average Value Number Average Value
LOANS ORIGINATED 11 $134,354 131 $121,931 105 $114,480 12 $51,980 1 $126,140 46 $121,483 14 $36,689 APPLICATIONS APPROVED, NOT ACCEPTED 2 $113,580 16 $120,162 17 $127,997 4 $19,778 0 $0 4 $159,415 4 $41,290 APPLICATIONS DENIED 1 $175,850 30 $113,706 40 $121,278 7 $55,741 0 $0 11 $103,207 5 $73,440 APPLICATIONS WITHDRAWN 3 $164,627 16 $146,921 37 $112,866 3 $93,893 0 $0 1 $59,860 1 $84,450 FILES CLOSED FOR INCOMPLETENESS 0 $0 4 $152,065 11 $118,854 1 $26,720 0 $0 1 $230,900 1 $66,280
Aggregated Statistics For Year 2004(Based on 1 partial tract) A) FHA, FSA/RHS & VA B) Conventional C) Refinancings D) Home Improvement Loans E) Loans on Dwellings For 5+ Families F) Non-occupant Loans on G) Loans On Manufactured Number Average Value Number Average Value Number Average Value Number Average Value Number Average Value Number Average Value Number Average Value
LOANS ORIGINATED 6 $112,868 70 $94,629 60 $97,644 13 $31,741 1 $962,100 14 $70,363 3 $27,793 APPLICATIONS APPROVED, NOT ACCEPTED 1 $53,450 11 $97,134 18 $95,111 3 $64,673 0 $0 1 $60,930 3 $34,030 APPLICATIONS DENIED 2 $90,330 17 $76,968 46 $101,323 5 $50,456 0 $0 4 $56,522 5 $52,916 APPLICATIONS WITHDRAWN 1 $58,260 9 $86,351 34 $109,164 3 $47,927 0 $0 4 $81,778 0 $0 FILES CLOSED FOR INCOMPLETENESS 1 $70,550 2 $122,400 6 $108,860 0 $0 0 $0 1 $52,380 0 $0
Aggregated Statistics For Year 2003(Based on 1 partial tract) A) FHA, FSA/RHS & VA B) Conventional C) Refinancings D) Home Improvement Loans E) Loans on Dwellings For 5+ Families F) Non-occupant Loans on Number Average Value Number Average Value Number Average Value Number Average Value Number Average Value Number Average Value
LOANS ORIGINATED 8 $110,174 63 $99,875 125 $87,162 7 $21,456 1 $242,660 12 $83,961 APPLICATIONS APPROVED, NOT ACCEPTED 1 $35,280 6 $76,433 18 $77,384 3 $23,873 0 $0 2 $40,620 APPLICATIONS DENIED 2 $124,805 12 $61,735 43 $77,266 4 $37,548 1 $584,210 4 $51,980 APPLICATIONS WITHDRAWN 1 $36,350 5 $100,272 34 $93,695 0 $0 0 $0 2 $62,270 FILES CLOSED FOR INCOMPLETENESS 1 $142,710 5 $132,022 5 $108,504 0 $0 0 $0 1 $53,450
Aggregated Statistics For Year 2002(Based on 1 partial tract) A) FHA, FSA/RHS & VA B) Conventional C) Refinancings D) Home Improvement Loans E) Loans on Dwellings For 5+ Families F) Non-occupant Loans on Number Average Value Number Average Value Number Average Value Number Average Value Number Average Value Number Average Value
LOANS ORIGINATED 9 $85,817 52 $84,379 82 $75,599 4 $29,530 1 $64,140 11 $66,424 APPLICATIONS APPROVED, NOT ACCEPTED 0 $0 7 $81,779 12 $65,209 1 $7,480 0 $0 1 $11,760 APPLICATIONS DENIED 1 $65,210 12 $75,187 30 $74,224 9 $25,121 0 $0 5 $76,540 APPLICATIONS WITHDRAWN 1 $54,520 3 $78,570 27 $73,088 0 $0 0 $0 1 $10,690 FILES CLOSED FOR INCOMPLETENESS 1 $47,570 0 $0 3 $77,147 0 $0 0 $0 0 $0
Aggregated Statistics For Year 2001(Based on 1 partial tract) A) FHA, FSA/RHS & VA B) Conventional C) Refinancings D) Home Improvement Loans E) Loans on Dwellings For 5+ Families F) Non-occupant Loans on Number Average Value Number Average Value Number Average Value Number Average Value Number Average Value Number Average Value
LOANS ORIGINATED 14 $86,284 60 $68,478 66 $72,271 9 $17,460 1 $1,924,200 12 $69,262 APPLICATIONS APPROVED, NOT ACCEPTED 1 $47,570 6 $48,907 9 $48,461 3 $15,857 0 $0 1 $39,020 APPLICATIONS DENIED 1 $27,260 14 $45,661 36 $61,081 8 $17,705 0 $0 3 $39,373 APPLICATIONS WITHDRAWN 1 $29,930 4 $94,072 29 $76,507 2 $14,165 0 $0 1 $36,350 FILES CLOSED FOR INCOMPLETENESS 0 $0 3 $65,210 5 $68,202 0 $0 0 $0 0 $0
Aggregated Statistics For Year 2000(Based on 1 partial tract) A) FHA, FSA/RHS & VA B) Conventional C) Refinancings D) Home Improvement Loans E) Loans on Dwellings For 5+ Families F) Non-occupant Loans on Number Average Value Number Average Value Number Average Value Number Average Value Number Average Value Number Average Value
LOANS ORIGINATED 10 $67,561 49 $70,314 24 $60,732 8 $22,516 0 $0 7 $83,381 APPLICATIONS APPROVED, NOT ACCEPTED 1 $94,610 8 $60,399 6 $46,858 3 $6,770 0 $0 1 $103,160 APPLICATIONS DENIED 1 $58,260 21 $47,952 29 $50,464 6 $17,282 1 $45,970 2 $71,355 APPLICATIONS WITHDRAWN 1 $35,810 5 $61,360 14 $45,051 1 $13,360 0 $0 1 $8,550 FILES CLOSED FOR INCOMPLETENESS 1 $35,280 2 $47,570 6 $66,902 0 $0 0 $0 0 $0
Aggregated Statistics For Year 1999(Based on 1 partial tract) A) FHA, FSA/RHS & VA B) Conventional C) Refinancings D) Home Improvement Loans F) Non-occupant Loans on Number Average Value Number Average Value Number Average Value Number Average Value Number Average Value
LOANS ORIGINATED 15 $74,837 57 $71,429 45 $56,867 10 $17,648 4 $72,198 APPLICATIONS APPROVED, NOT ACCEPTED 1 $28,340 8 $85,434 11 $52,410 3 $20,323 1 $71,130 APPLICATIONS DENIED 1 $73,270 17 $57,004 29 $58,754 8 $19,520 3 $64,353 APPLICATIONS WITHDRAWN 1 $24,600 5 $76,048 16 $61,435 2 $35,830 1 $16,040 FILES CLOSED FOR INCOMPLETENESS 1 $81,290 1 $83,960 4 $47,462 0 $0 0 $0
Detailed HMDA statistics for the following Tracts:
0908.02
Private Mortgage Insurance Companies Aggregated Statistics For Year 2009(Based on 1 partial tract) A) Conventional B) Refinancings Number Average Value Number Average Value
LOANS ORIGINATED 1 $90,860 1 $156,610 APPLICATIONS APPROVED, NOT ACCEPTED 1 $206,850 0 $0 APPLICATIONS DENIED 0 $0 0 $0 APPLICATIONS WITHDRAWN 0 $0 0 $0 FILES CLOSED FOR INCOMPLETENESS 0 $0 0 $0
Aggregated Statistics For Year 2008(Based on 1 partial tract) A) Conventional B) Refinancings C) Non-occupant Loans on Number Average Value Number Average Value Number Average Value
LOANS ORIGINATED 4 $189,615 3 $145,563 0 $0 APPLICATIONS APPROVED, NOT ACCEPTED 4 $230,235 1 $160,350 1 $244,800 APPLICATIONS DENIED 1 $203,110 1 $70,020 1 $203,110 APPLICATIONS WITHDRAWN 1 $203,110 0 $0 0 $0 FILES CLOSED FOR INCOMPLETENESS 0 $0 0 $0 0 $0
Aggregated Statistics For Year 2007(Based on 1 partial tract) A) Conventional B) Refinancings Number Average Value Number Average Value
LOANS ORIGINATED 18 $208,188 8 $200,371 APPLICATIONS APPROVED, NOT ACCEPTED 6 $241,148 2 $236,250 APPLICATIONS DENIED 1 $192,420 0 $0 APPLICATIONS WITHDRAWN 1 $109,570 1 $228,230 FILES CLOSED FOR INCOMPLETENESS 1 $72,160 0 $0
Aggregated Statistics For Year 2006(Based on 1 partial tract) A) Conventional B) Refinancings C) Non-occupant Loans on Number Average Value Number Average Value Number Average Value
LOANS ORIGINATED 25 $191,501 4 $198,300 3 $204,537 APPLICATIONS APPROVED, NOT ACCEPTED 4 $169,035 3 $163,737 1 $164,090 APPLICATIONS DENIED 0 $0 0 $0 0 $0 APPLICATIONS WITHDRAWN 1 $85,520 0 $0 1 $85,520 FILES CLOSED FOR INCOMPLETENESS 0 $0 0 $0 0 $0
Aggregated Statistics For Year 2005(Based on 1 partial tract) A) Conventional B) Refinancings C) Non-occupant Loans on Number Average Value Number Average Value Number Average Value
LOANS ORIGINATED 25 $168,688 5 $141,108 3 $184,580 APPLICATIONS APPROVED, NOT ACCEPTED 5 $162,594 0 $0 2 $130,420 APPLICATIONS DENIED 0 $0 0 $0 0 $0 APPLICATIONS WITHDRAWN 2 $188,680 1 $41,160 1 $77,500 FILES CLOSED FOR INCOMPLETENESS 1 $58,260 0 $0 0 $0
Aggregated Statistics For Year 2004(Based on 1 partial tract) A) Conventional B) Refinancings C) Non-occupant Loans on Number Average Value Number Average Value Number Average Value
LOANS ORIGINATED 16 $116,154 2 $81,780 3 $78,037 APPLICATIONS APPROVED, NOT ACCEPTED 3 $121,330 4 $86,722 1 $39,020 APPLICATIONS DENIED 0 $0 0 $0 0 $0 APPLICATIONS WITHDRAWN 1 $131,490 0 $0 0 $0 FILES CLOSED FOR INCOMPLETENESS 1 $62,000 0 $0 0 $0
Aggregated Statistics For Year 2003(Based on 1 partial tract) A) Conventional B) Refinancings C) Non-occupant Loans on Number Average Value Number Average Value Number Average Value
LOANS ORIGINATED 18 $103,039 9 $122,876 1 $26,720 APPLICATIONS APPROVED, NOT ACCEPTED 3 $112,423 4 $98,080 1 $119,190 APPLICATIONS DENIED 0 $0 0 $0 0 $0 APPLICATIONS WITHDRAWN 1 $96,740 0 $0 0 $0 FILES CLOSED FOR INCOMPLETENESS 0 $0 1 $51,310 0 $0
Aggregated Statistics For Year 2002(Based on 1 partial tract) A) Conventional B) Refinancings C) Non-occupant Loans on Number Average Value Number Average Value Number Average Value
LOANS ORIGINATED 13 $118,495 7 $133,090 2 $92,200 APPLICATIONS APPROVED, NOT ACCEPTED 2 $149,125 2 $95,140 0 $0 APPLICATIONS DENIED 0 $0 0 $0 0 $0 APPLICATIONS WITHDRAWN 1 $160,880 2 $114,385 1 $98,880 FILES CLOSED FOR INCOMPLETENESS 0 $0 0 $0 0 $0
Aggregated Statistics For Year 2001(Based on 1 partial tract) A) Conventional B) Refinancings C) Non-occupant Loans on Number Average Value Number Average Value Number Average Value
LOANS ORIGINATED 14 $78,686 5 $84,238 2 $66,010 APPLICATIONS APPROVED, NOT ACCEPTED 1 $112,780 1 $112,240 0 $0 APPLICATIONS DENIED 0 $0 1 $40,090 0 $0 APPLICATIONS WITHDRAWN 0 $0 0 $0 0 $0 FILES CLOSED FOR INCOMPLETENESS 0 $0 0 $0 0 $0
Aggregated Statistics For Year 2000(Based on 1 partial tract) A) Conventional B) Refinancings C) Non-occupant Loans on Number Average Value Number Average Value Number Average Value
LOANS ORIGINATED 15 $111,497 2 $72,160 3 $117,233 APPLICATIONS APPROVED, NOT ACCEPTED 1 $49,170 0 $0 0 $0 APPLICATIONS DENIED 2 $96,475 0 $0 0 $0 APPLICATIONS WITHDRAWN 2 $43,830 0 $0 1 $15,500 FILES CLOSED FOR INCOMPLETENESS 0 $0 0 $0 0 $0
Aggregated Statistics For Year 1999(Based on 1 partial tract) A) Conventional B) Refinancings C) Non-occupant Loans on Number Average Value Number Average Value Number Average Value
LOANS ORIGINATED 17 $92,552 4 $111,772 2 $66,850 APPLICATIONS APPROVED, NOT ACCEPTED 2 $107,225 1 $31,020 1 $25,140 APPLICATIONS DENIED 0 $0 1 $120,860 0 $0 APPLICATIONS WITHDRAWN 0 $0 0 $0 0 $0 FILES CLOSED FOR INCOMPLETENESS 0 $0 0 $0 0 $0
Detailed PMIC statistics for the following Tracts:
0908.02
Fire-safe hotels and motels in Orange City, Florida:
Comfort Inn, 445 S Volusia Ave, Orange City, Florida 32763 Phone: (386) 775-7444, Fax: (386) 775-9887
Holiday Inn Express Hotel & Suites, 1330 Saxon Blvd, Orange City, Florida 32763 Phone: (386) 917-0004, Fax: (386) 917-0005
All 2 fire-safe hotels and motels in Orange City, Florida
Most common first names in Orange City, FL among deceased individuals Name Count Lived (average)
William 218 76.3 years John 214 76.4 years Mary 149 80.3 years Robert 146 75.0 years James 142 73.5 years George 139 75.8 years Charles 129 76.1 years Joseph 109 74.4 years Helen 105 81.4 years Dorothy 98 81.1 years
Most common last names in Orange City, FL among deceased individuals Last name Count Lived (average)
Smith 69 78.1 years Johnson 53 79.5 years Miller 44 78.1 years Williams 32 76.7 years Wilson 31 75.4 years Brown 30 76.6 years Davis 30 79.4 years Anderson 27 76.7 years Martin 26 81.2 years Thomas 25 73.5 years
Orange City compared to Florida state average:
Unemployed percentage below state average. Median age above state average. Foreign-born population percentage below state average. Length of stay since moving in significantly above state average. Orange City on our top lists :
#1 on the list of "Top 100 high-educated but low-earning cities"
#32 on the list of "Top 101 cities with the highest number of thefts per 100,000 residents, excludes tourist destinations and others with a lot of outsiders visiting based on city industries data (population 5,000+)"
#70 on the list of "Top 101 cities with largest percentage of females in occupations: food preparation and serving related occupations (population 5,000+)"
#76 on the list of "Top 101 cities with the highest city-data.com crime index, excludes tourist destinations and others with a lot of outsiders visiting based on city industries data (population 5,000+)"
#80 on the list of "Top 101 cities with the most people taking a motorcycle to work (population 5,000+)"
#82 on the list of "Top 101 cities with the largest city-data.com crime index per police officer (population 5,000+)"
#91 on the list of "Top 100 least-safe cities (highest city-data.com crime index) (pop. 5,000+)"
#40 on the list of "Top 101 counties with the lowest number of births per 1000 residents 2007-2013"
#40 on the list of "Top 101 counties with the highest ground withdrawal of fresh water for public supply"
#50 on the list of "Top 101 counties with the highest number of deaths per 1000 residents 2007-2013 (pop. 50,000+)"
#69 on the list of "Top 101 counties with the lowest Particulate Matter (PM2.5 ) Annual air pollution readings in 2012 (µg/m3 )"
#75 on the list of "Top 101 counties with the lowest Ozone (1-hour) air pollution readings in 2012 (ppm)"
Top Patent Applicants
David A. Foster (4)
Brian Gulliver (3)
George Davis (1)
Steven George Batson (1)
Mike F. Quigley (1)
Steven Talbert (1)
Rebecca Jane Hatfield (1)
Michael Rose (1)
Total of 13 patent applications in 2008-2024.

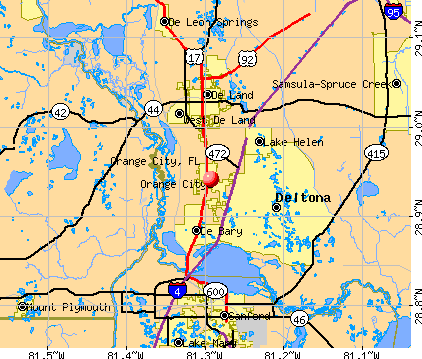


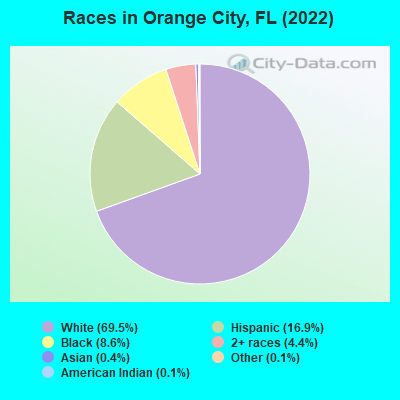
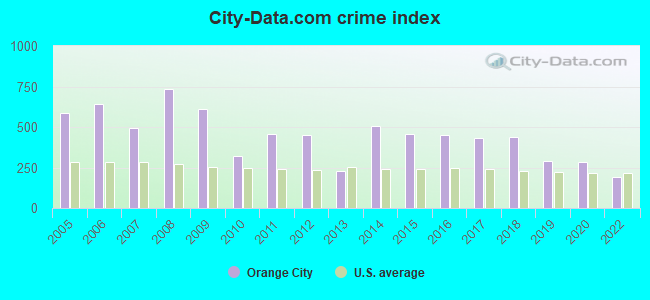
 Recent articles from our blog. Our writers, many of them Ph.D. graduates or candidates, create easy-to-read articles on a wide variety of topics.

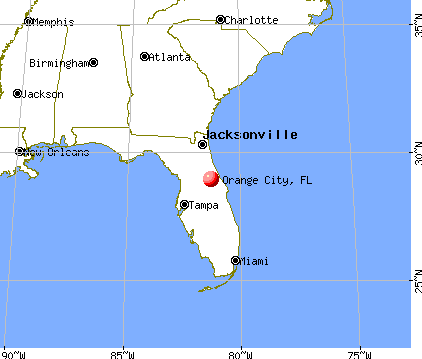
 (5.2 miles
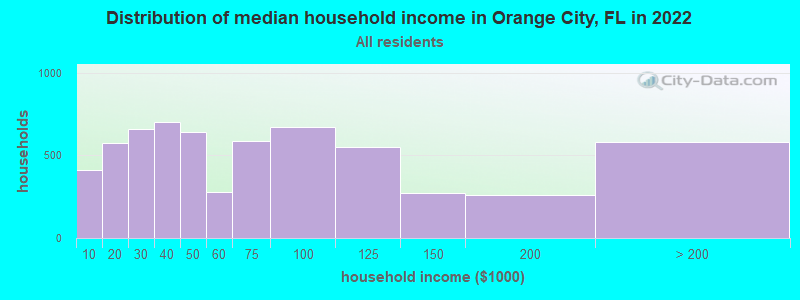
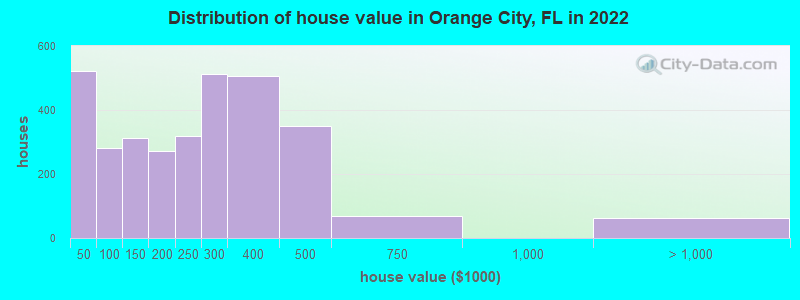
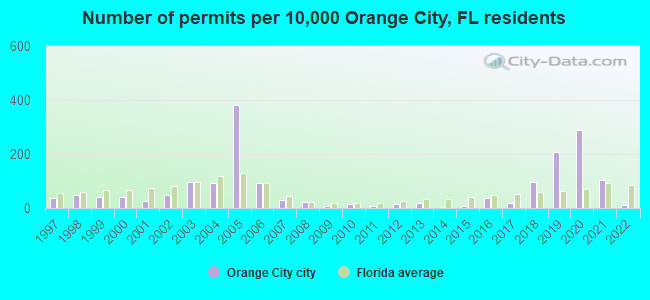
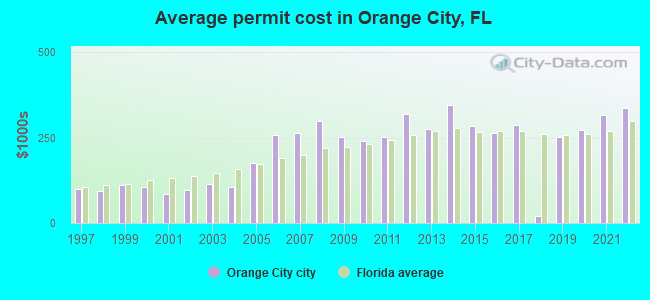
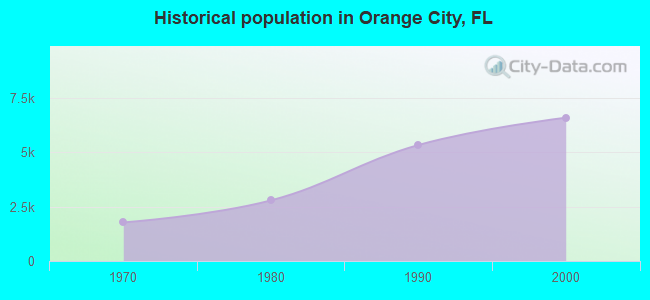
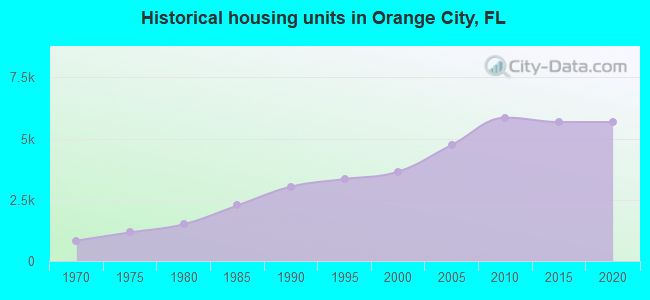
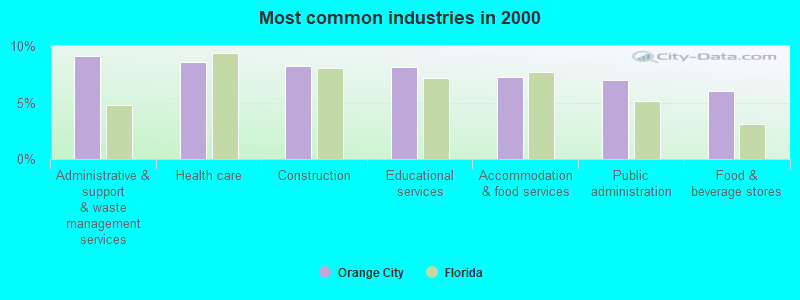
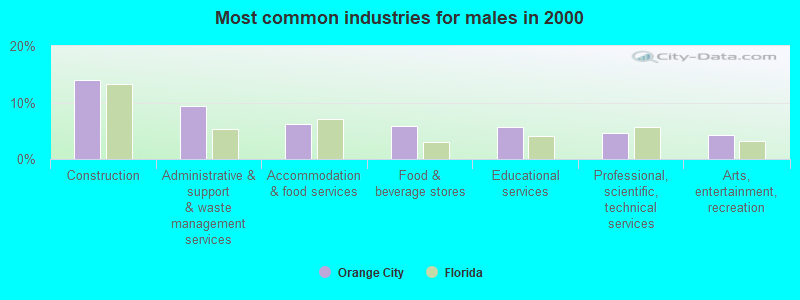
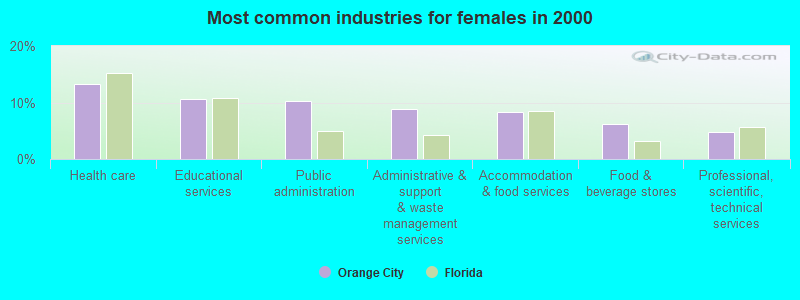
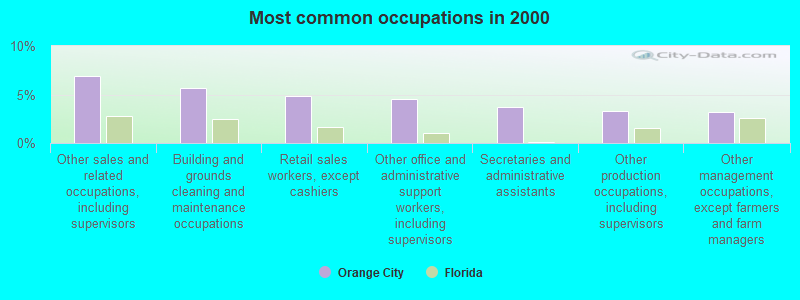
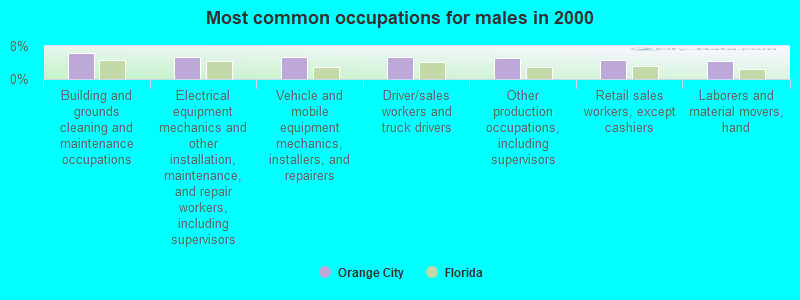
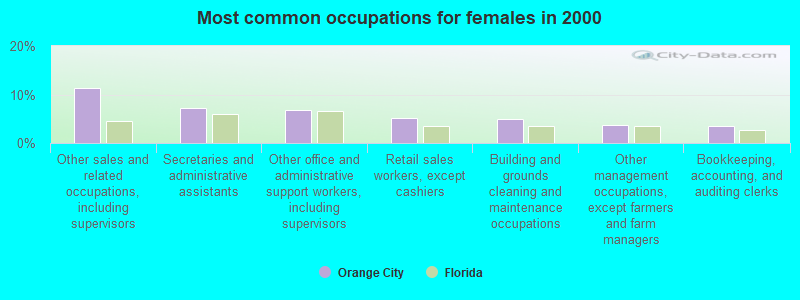
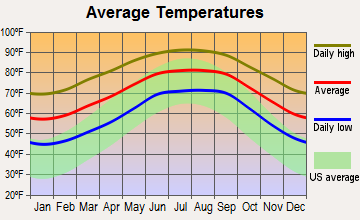
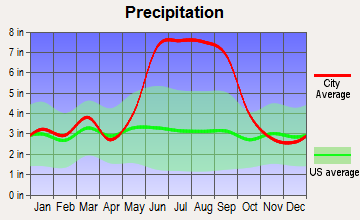
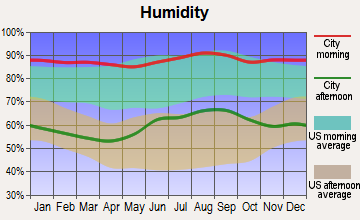
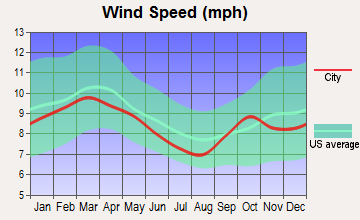
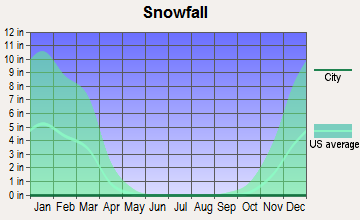
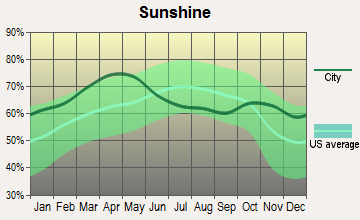
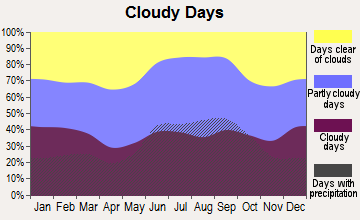
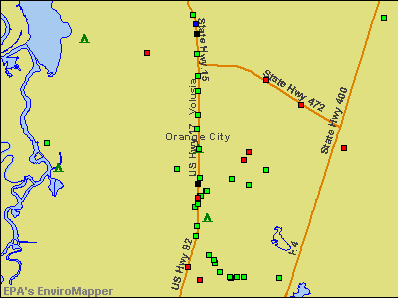

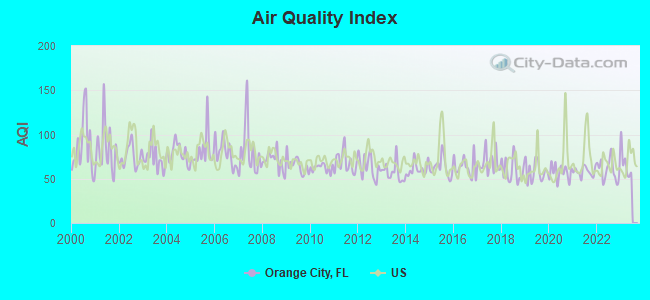
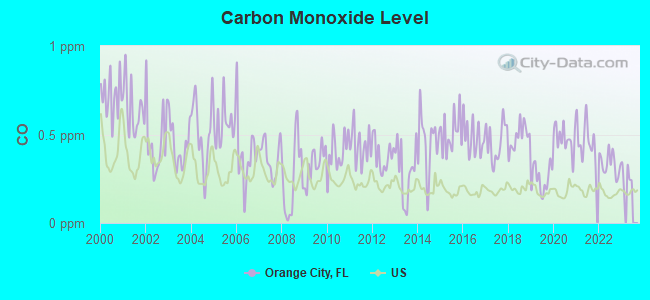
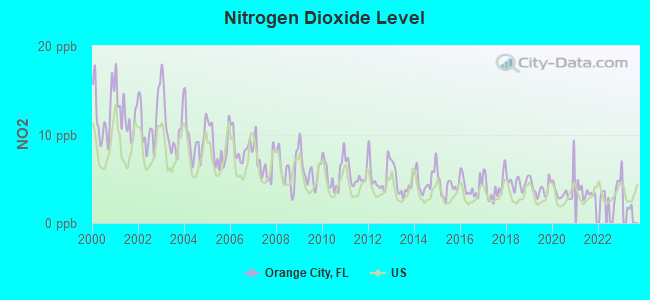
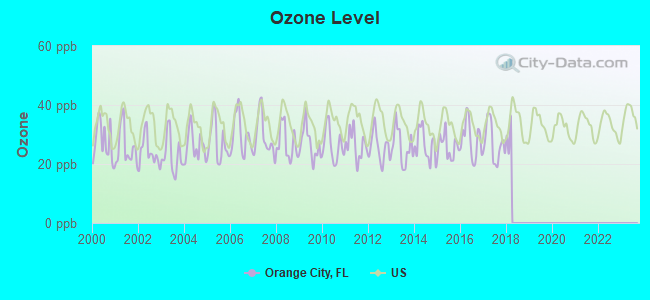
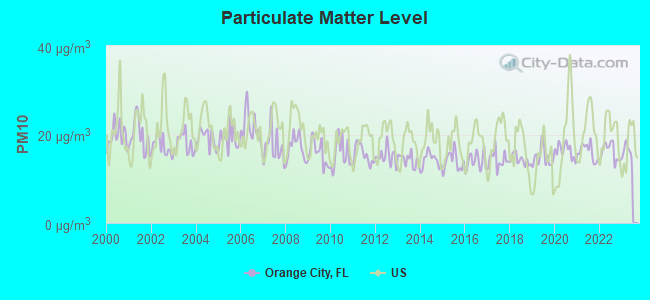
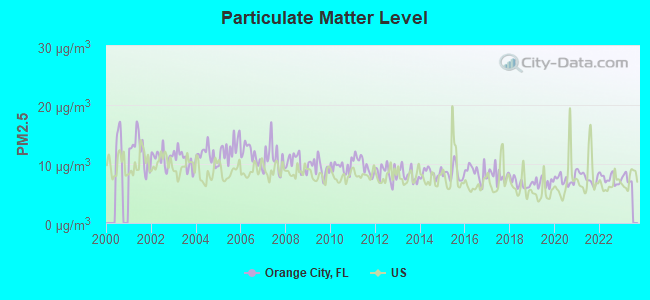

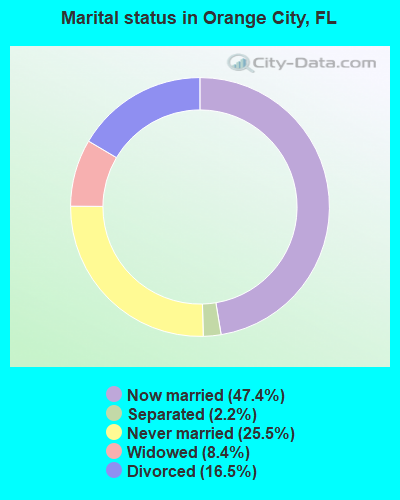
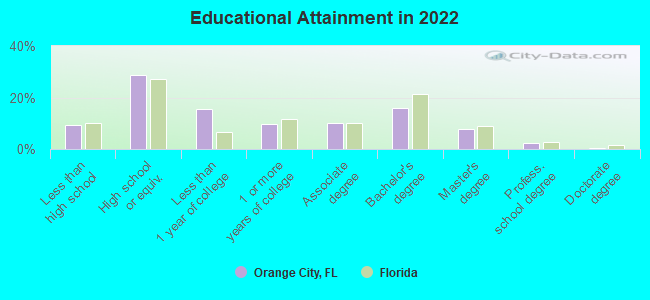
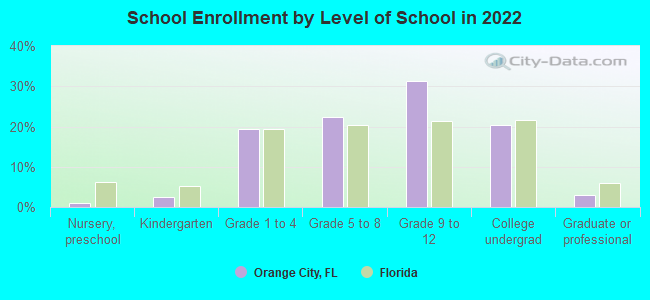
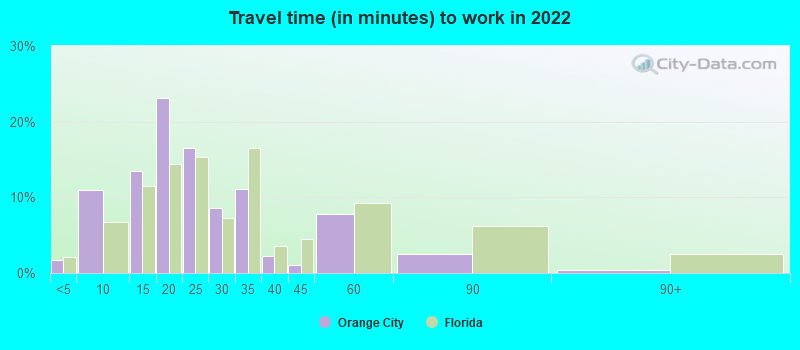
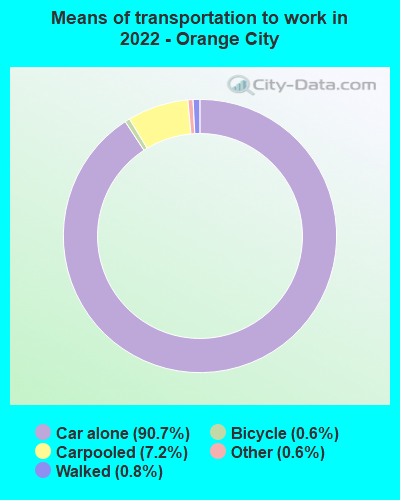
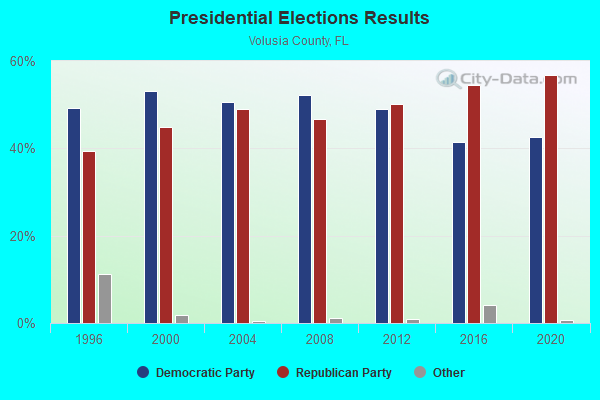
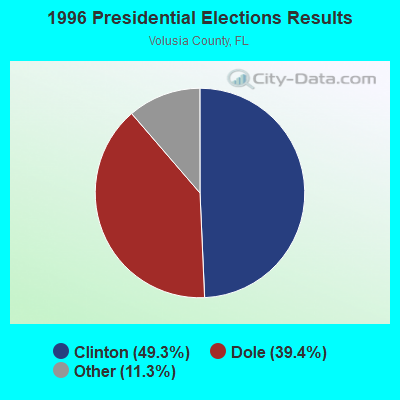
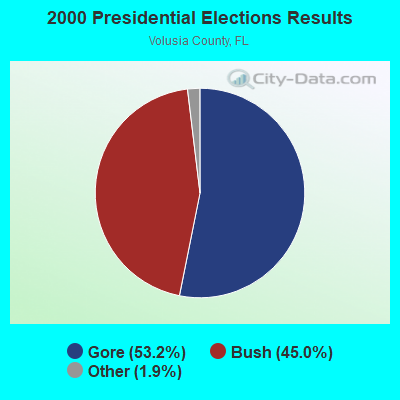
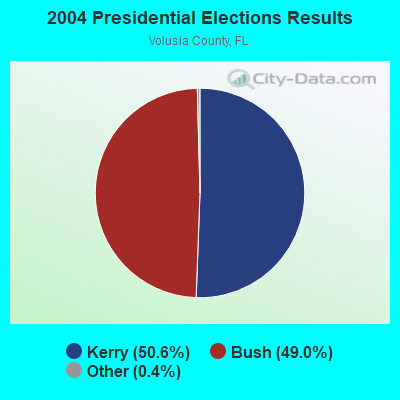
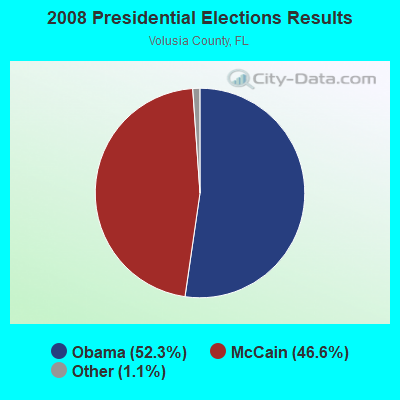
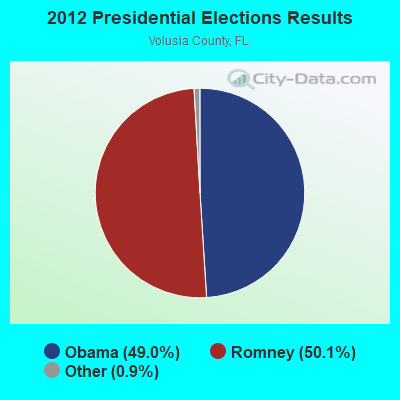
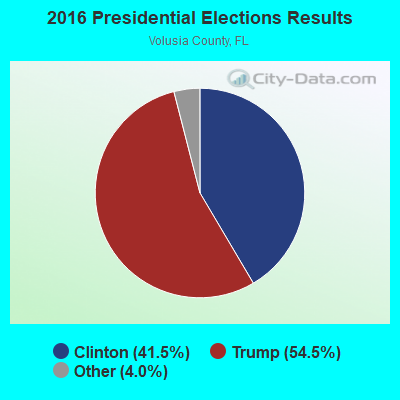
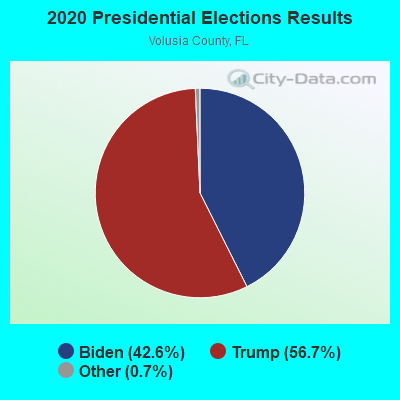
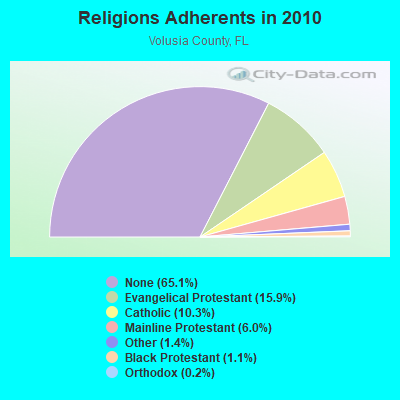
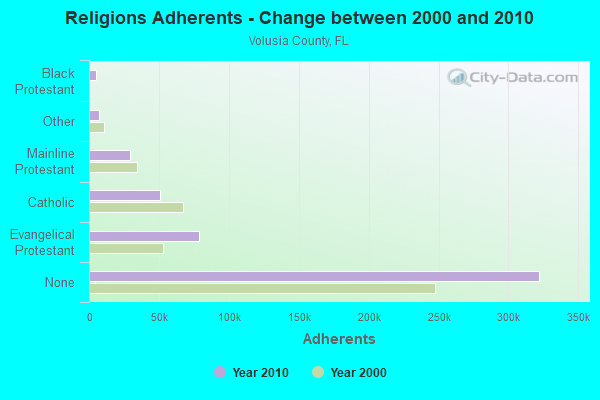
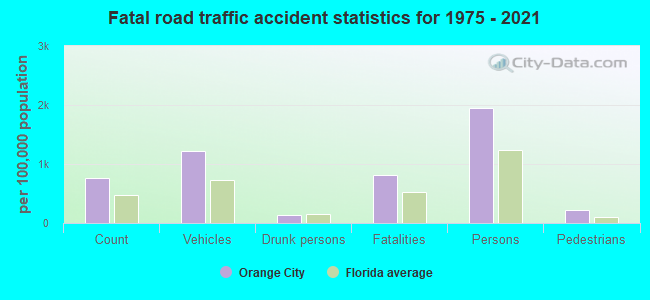
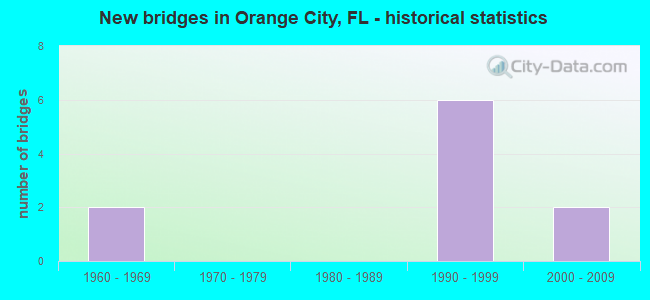
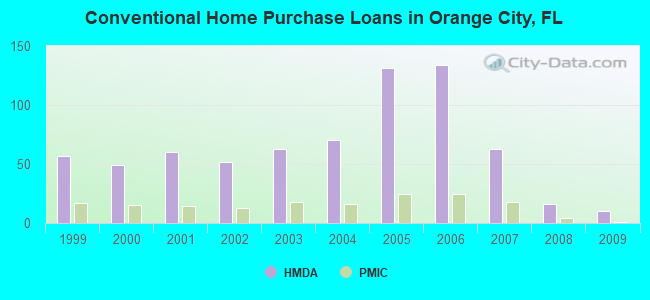
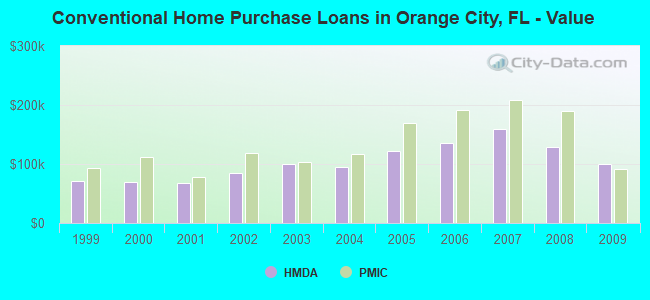
 Based on the data from the years 2002 - 2018 the average number of fires per year is 126. The highest number of fires - 170 took place in 2009, and the least - 50 in 2005. The data has a dropping trend.
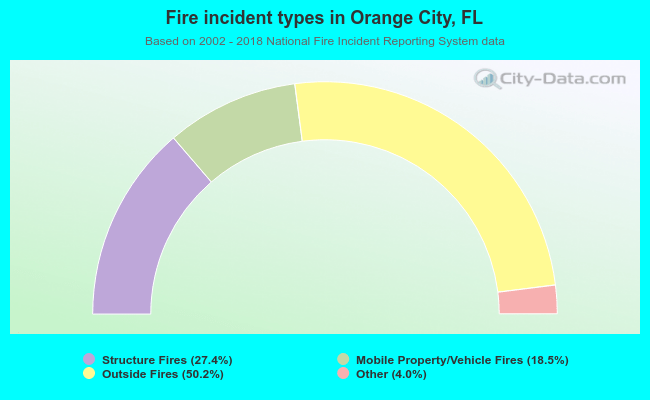 When looking into fire subcategories, the most reports belonged to: Outside Fires (50.2%), and Structure Fires (27.4%).