Estimated zip code population in 2022: 25,553
Zip code population in 2010: 21,263
Zip code population in 2000: 15,173
Houses and condos: 11,846
Renter-occupied apartments: 4,143
% of renters here:
38%State:
33%
March 2022 cost of living index in zip code 32763: 88.9
(less than average, U.S. average is 100)
Land area: 16.8
sq. mi.
Water area: 0.1
sq. mi.
Population density: 1,521 people per square mile (low).
OSM Map
General Map
Google Map
MSN Map
OSM Map
General Map
Google Map
MSN Map
OSM Map
General Map
Google Map
MSN Map
OSM Map
General Map
Google Map
MSN Map
Please wait while loading the map...
Real estate property taxes paid for housing units in 2022:
This zip code:
0.7% ($1,771)Florida:
0.7% ($2,529)
Median real estate property taxes paid for housing units with mortgages in 2022: $2,224 (0.8%)
Median real estate property taxes paid for housing units with no mortgage in 2022: $1,275 (0.7%)
Profiles of local businesses
Business Search - 14 Million verified businesses
Males: 12,761 Females: 12,791
For population 25 years and over in 32763:
High school or higher: 90.2%Bachelor's degree or higher: 22.7%Graduate or professional degree: 7.6%Unemployed: 3.5%Mean travel time to work (commute): 30.2 minutes
For population 15 years and over in 32763:
Never married: 26.4%Now married: 48.6%Separated: 1.7%Widowed: 6.4%Divorced: 17.0%
Zip code 32763 compared to state average:
Black race population percentage below state average. Foreign-born population percentage significantly below state average. Length of stay since moving in significantly above state average. 18,100 70.8% White 4,402 17.2% Hispanic or Latino 1,835 7.2% Black 887 3.5% Two or more races 295 1.2% Asian 18 0.07% Some other race 13 0.05% American Indian
Data:
Median household income ($)
Median household income (% change since 2000)
Household income diversity
Ratio of average income to average house value (%)
Ratio of average income to average rent
Median household income ($) - White
Median household income ($) - Black or African American
Median household income ($) - Asian
Median household income ($) - Hispanic or Latino
Median household income ($) - American Indian and Alaska Native
Median household income ($) - Multirace
Median household income ($) - Other Race
Median household income for houses/condos with a mortgage ($)
Median household income for apartments without a mortgage ($)
Races - White alone (%)
Races - White alone (% change since 2000)
Races - Black alone (%)
Races - Black alone (% change since 2000)
Races - American Indian alone (%)
Races - American Indian alone (% change since 2000)
Races - Asian alone (%)
Races - Asian alone (% change since 2000)
Races - Hispanic (%)
Races - Hispanic (% change since 2000)
Races - Native Hawaiian and Other Pacific Islander alone (%)
Races - Native Hawaiian and Other Pacific Islander alone (% change since 2000)
Races - Two or more races (%)
Races - Two or more races (% change since 2000)
Races - Other race alone (%)
Races - Other race alone (% change since 2000)
Racial diversity
Unemployment (%)
Unemployment (% change since 2000)
Unemployment (%) - White
Unemployment (%) - Black or African American
Unemployment (%) - Asian
Unemployment (%) - Hispanic or Latino
Unemployment (%) - American Indian and Alaska Native
Unemployment (%) - Multirace
Unemployment (%) - Other Race
Population density (people per square mile)
Population - Males (%)
Population - Females (%)
Population - Males (%) - White
Population - Males (%) - Black or African American
Population - Males (%) - Asian
Population - Males (%) - Hispanic or Latino
Population - Males (%) - American Indian and Alaska Native
Population - Males (%) - Multirace
Population - Males (%) - Other Race
Population - Females (%) - White
Population - Females (%) - Black or African American
Population - Females (%) - Asian
Population - Females (%) - Hispanic or Latino
Population - Females (%) - American Indian and Alaska Native
Population - Females (%) - Multirace
Population - Females (%) - Other Race
Coronavirus confirmed cases (May 31, 2024)
Deaths caused by coronavirus (May 31, 2024)
Coronavirus confirmed cases (per 100k population) (May 31, 2024)
Deaths caused by coronavirus (per 100k population) (May 31, 2024)
Daily increase in number of cases (May 31, 2024)
Weekly increase in number of cases (May 31, 2024)
Cases doubled (in days) (May 31, 2024)
Hospitalized patients (Apr 18, 2022)
Negative test results (Apr 18, 2022)
Total test results (Apr 18, 2022)
COVID Vaccine doses distributed (per 100k population) (Sep 19, 2023)
COVID Vaccine doses administered (per 100k population) (Sep 19, 2023)
COVID Vaccine doses distributed (Sep 19, 2023)
COVID Vaccine doses administered (Sep 19, 2023)
Likely homosexual households (%)
Likely homosexual households (% change since 2000)
Likely homosexual households - Lesbian couples (%)
Likely homosexual households - Lesbian couples (% change since 2000)
Likely homosexual households - Gay men (%)
Likely homosexual households - Gay men (% change since 2000)
Cost of living index
Median gross rent ($)
Median contract rent ($)
Median monthly housing costs ($)
Median house or condo value ($)
Median house or condo value ($ change since 2000)
Mean house or condo value by units in structure - 1, detached ($)
Mean house or condo value by units in structure - 1, attached ($)
Mean house or condo value by units in structure - 2 ($)
Mean house or condo value by units in structure by units in structure - 3 or 4 ($)
Mean house or condo value by units in structure - 5 or more ($)
Mean house or condo value by units in structure - Boat, RV, van, etc. ($)
Mean house or condo value by units in structure - Mobile home ($)
Median house or condo value ($) - White
Median house or condo value ($) - Black or African American
Median house or condo value ($) - Asian
Median house or condo value ($) - Hispanic or Latino
Median house or condo value ($) - American Indian and Alaska Native
Median house or condo value ($) - Multirace
Median house or condo value ($) - Other Race
Median resident age
Resident age diversity
Median resident age - Males
Median resident age - Females
Median resident age - White
Median resident age - Black or African American
Median resident age - Asian
Median resident age - Hispanic or Latino
Median resident age - American Indian and Alaska Native
Median resident age - Multirace
Median resident age - Other Race
Median resident age - Males - White
Median resident age - Males - Black or African American
Median resident age - Males - Asian
Median resident age - Males - Hispanic or Latino
Median resident age - Males - American Indian and Alaska Native
Median resident age - Males - Multirace
Median resident age - Males - Other Race
Median resident age - Females - White
Median resident age - Females - Black or African American
Median resident age - Females - Asian
Median resident age - Females - Hispanic or Latino
Median resident age - Females - American Indian and Alaska Native
Median resident age - Females - Multirace
Median resident age - Females - Other Race
Commute - mean travel time to work (minutes)
Travel time to work - Less than 5 minutes (%)
Travel time to work - Less than 5 minutes (% change since 2000)
Travel time to work - 5 to 9 minutes (%)
Travel time to work - 5 to 9 minutes (% change since 2000)
Travel time to work - 10 to 19 minutes (%)
Travel time to work - 10 to 19 minutes (% change since 2000)
Travel time to work - 20 to 29 minutes (%)
Travel time to work - 20 to 29 minutes (% change since 2000)
Travel time to work - 30 to 39 minutes (%)
Travel time to work - 30 to 39 minutes (% change since 2000)
Travel time to work - 40 to 59 minutes (%)
Travel time to work - 40 to 59 minutes (% change since 2000)
Travel time to work - 60 to 89 minutes (%)
Travel time to work - 60 to 89 minutes (% change since 2000)
Travel time to work - 90 or more minutes (%)
Travel time to work - 90 or more minutes (% change since 2000)
Marital status - Never married (%)
Marital status - Now married (%)
Marital status - Separated (%)
Marital status - Widowed (%)
Marital status - Divorced (%)
Median family income ($)
Median family income (% change since 2000)
Median non-family income ($)
Median non-family income (% change since 2000)
Median per capita income ($)
Median per capita income (% change since 2000)
Median family income ($) - White
Median family income ($) - Black or African American
Median family income ($) - Asian
Median family income ($) - Hispanic or Latino
Median family income ($) - American Indian and Alaska Native
Median family income ($) - Multirace
Median family income ($) - Other Race
Median year house/condo built
Median year apartment built
Year house built - Built 2005 or later (%)
Year house built - Built 2000 to 2004 (%)
Year house built - Built 1990 to 1999 (%)
Year house built - Built 1980 to 1989 (%)
Year house built - Built 1970 to 1979 (%)
Year house built - Built 1960 to 1969 (%)
Year house built - Built 1950 to 1959 (%)
Year house built - Built 1940 to 1949 (%)
Year house built - Built 1939 or earlier (%)
Average household size
Household density (households per square mile)
Average household size - White
Average household size - Black or African American
Average household size - Asian
Average household size - Hispanic or Latino
Average household size - American Indian and Alaska Native
Average household size - Multirace
Average household size - Other Race
Occupied housing units (%)
Vacant housing units (%)
Owner occupied housing units (%)
Renter occupied housing units (%)
Vacancy status - For rent (%)
Vacancy status - For sale only (%)
Vacancy status - Rented or sold, not occupied (%)
Vacancy status - For seasonal, recreational, or occasional use (%)
Vacancy status - For migrant workers (%)
Vacancy status - Other vacant (%)
Residents with income below the poverty level (%)
Residents with income below 50% of the poverty level (%)
Children below poverty level (%)
Poor families by family type - Married-couple family (%)
Poor families by family type - Male, no wife present (%)
Poor families by family type - Female, no husband present (%)
Poverty status for native-born residents (%)
Poverty status for foreign-born residents (%)
Poverty among high school graduates not in families (%)
Poverty among people who did not graduate high school not in families (%)
Residents with income below the poverty level (%) - White
Residents with income below the poverty level (%) - Black or African American
Residents with income below the poverty level (%) - Asian
Residents with income below the poverty level (%) - Hispanic or Latino
Residents with income below the poverty level (%) - American Indian and Alaska Native
Residents with income below the poverty level (%) - Multirace
Residents with income below the poverty level (%) - Other Race
Air pollution - Air Quality Index (AQI)
Air pollution - CO
Air pollution - NO2
Air pollution - SO2
Air pollution - Ozone
Air pollution - PM10
Air pollution - PM25
Air pollution - Pb
Crime - Murders per 100,000 population
Crime - Rapes per 100,000 population
Crime - Robberies per 100,000 population
Crime - Assaults per 100,000 population
Crime - Burglaries per 100,000 population
Crime - Thefts per 100,000 population
Crime - Auto thefts per 100,000 population
Crime - Arson per 100,000 population
Crime - City-data.com crime index
Crime - Violent crime index
Crime - Property crime index
Crime - Murders per 100,000 population (5 year average)
Crime - Rapes per 100,000 population (5 year average)
Crime - Robberies per 100,000 population (5 year average)
Crime - Assaults per 100,000 population (5 year average)
Crime - Burglaries per 100,000 population (5 year average)
Crime - Thefts per 100,000 population (5 year average)
Crime - Auto thefts per 100,000 population (5 year average)
Crime - Arson per 100,000 population (5 year average)
Crime - City-data.com crime index (5 year average)
Crime - Violent crime index (5 year average)
Crime - Property crime index (5 year average)
1996 Presidential Elections Results (%) - Democratic Party (Clinton)
1996 Presidential Elections Results (%) - Republican Party (Dole)
1996 Presidential Elections Results (%) - Other
2000 Presidential Elections Results (%) - Democratic Party (Gore)
2000 Presidential Elections Results (%) - Republican Party (Bush)
2000 Presidential Elections Results (%) - Other
2004 Presidential Elections Results (%) - Democratic Party (Kerry)
2004 Presidential Elections Results (%) - Republican Party (Bush)
2004 Presidential Elections Results (%) - Other
2008 Presidential Elections Results (%) - Democratic Party (Obama)
2008 Presidential Elections Results (%) - Republican Party (McCain)
2008 Presidential Elections Results (%) - Other
2012 Presidential Elections Results (%) - Democratic Party (Obama)
2012 Presidential Elections Results (%) - Republican Party (Romney)
2012 Presidential Elections Results (%) - Other
2016 Presidential Elections Results (%) - Democratic Party (Clinton)
2016 Presidential Elections Results (%) - Republican Party (Trump)
2016 Presidential Elections Results (%) - Other
2020 Presidential Elections Results (%) - Democratic Party (Biden)
2020 Presidential Elections Results (%) - Republican Party (Trump)
2020 Presidential Elections Results (%) - Other
Ancestries Reported - Arab (%)
Ancestries Reported - Czech (%)
Ancestries Reported - Danish (%)
Ancestries Reported - Dutch (%)
Ancestries Reported - English (%)
Ancestries Reported - French (%)
Ancestries Reported - French Canadian (%)
Ancestries Reported - German (%)
Ancestries Reported - Greek (%)
Ancestries Reported - Hungarian (%)
Ancestries Reported - Irish (%)
Ancestries Reported - Italian (%)
Ancestries Reported - Lithuanian (%)
Ancestries Reported - Norwegian (%)
Ancestries Reported - Polish (%)
Ancestries Reported - Portuguese (%)
Ancestries Reported - Russian (%)
Ancestries Reported - Scotch-Irish (%)
Ancestries Reported - Scottish (%)
Ancestries Reported - Slovak (%)
Ancestries Reported - Subsaharan African (%)
Ancestries Reported - Swedish (%)
Ancestries Reported - Swiss (%)
Ancestries Reported - Ukrainian (%)
Ancestries Reported - United States (%)
Ancestries Reported - Welsh (%)
Ancestries Reported - West Indian (%)
Ancestries Reported - Other (%)
Educational Attainment - No schooling completed (%)
Educational Attainment - Less than high school (%)
Educational Attainment - High school or equivalent (%)
Educational Attainment - Less than 1 year of college (%)
Educational Attainment - 1 or more years of college (%)
Educational Attainment - Associate degree (%)
Educational Attainment - Bachelor's degree (%)
Educational Attainment - Master's degree (%)
Educational Attainment - Professional school degree (%)
Educational Attainment - Doctorate degree (%)
School Enrollment - Nursery, preschool (%)
School Enrollment - Kindergarten (%)
School Enrollment - Grade 1 to 4 (%)
School Enrollment - Grade 5 to 8 (%)
School Enrollment - Grade 9 to 12 (%)
School Enrollment - College undergrad (%)
School Enrollment - Graduate or professional (%)
School Enrollment - Not enrolled in school (%)
School enrollment - Public schools (%)
School enrollment - Private schools (%)
School enrollment - Not enrolled (%)
Median number of rooms in houses and condos
Median number of rooms in apartments
Housing units lacking complete plumbing facilities (%)
Housing units lacking complete kitchen facilities (%)
Density of houses
Urban houses (%)
Rural houses (%)
Households with people 60 years and over (%)
Households with people 65 years and over (%)
Households with people 75 years and over (%)
Households with one or more nonrelatives (%)
Households with no nonrelatives (%)
Population in households (%)
Family households (%)
Nonfamily households (%)
Population in families (%)
Family households with own children (%)
Median number of bedrooms in owner occupied houses
Mean number of bedrooms in owner occupied houses
Median number of bedrooms in renter occupied houses
Mean number of bedrooms in renter occupied houses
Median number of vehichles in owner occupied houses
Mean number of vehichles in owner occupied houses
Median number of vehichles in renter occupied houses
Mean number of vehichles in renter occupied houses
Mortgage status - with mortgage (%)
Mortgage status - with second mortgage (%)
Mortgage status - with home equity loan (%)
Mortgage status - with both second mortgage and home equity loan (%)
Mortgage status - without a mortgage (%)
Average family size
Average family size - White
Average family size - Black or African American
Average family size - Asian
Average family size - Hispanic or Latino
Average family size - American Indian and Alaska Native
Average family size - Multirace
Average family size - Other Race
Geographical mobility - Same house 1 year ago (%)
Geographical mobility - Moved within same county (%)
Geographical mobility - Moved from different county within same state (%)
Geographical mobility - Moved from different state (%)
Geographical mobility - Moved from abroad (%)
Place of birth - Born in state of residence (%)
Place of birth - Born in other state (%)
Place of birth - Native, outside of US (%)
Place of birth - Foreign born (%)
Housing units in structures - 1, detached (%)
Housing units in structures - 1, attached (%)
Housing units in structures - 2 (%)
Housing units in structures - 3 or 4 (%)
Housing units in structures - 5 to 9 (%)
Housing units in structures - 10 to 19 (%)
Housing units in structures - 20 to 49 (%)
Housing units in structures - 50 or more (%)
Housing units in structures - Mobile home (%)
Housing units in structures - Boat, RV, van, etc. (%)
House/condo owner moved in on average (years ago)
Renter moved in on average (years ago)
Year householder moved into unit - Moved in 1999 to March 2000 (%)
Year householder moved into unit - Moved in 1995 to 1998 (%)
Year householder moved into unit - Moved in 1990 to 1994 (%)
Year householder moved into unit - Moved in 1980 to 1989 (%)
Year householder moved into unit - Moved in 1970 to 1979 (%)
Year householder moved into unit - Moved in 1969 or earlier (%)
Means of transportation to work - Drove car alone (%)
Means of transportation to work - Carpooled (%)
Means of transportation to work - Public transportation (%)
Means of transportation to work - Bus or trolley bus (%)
Means of transportation to work - Streetcar or trolley car (%)
Means of transportation to work - Subway or elevated (%)
Means of transportation to work - Railroad (%)
Means of transportation to work - Ferryboat (%)
Means of transportation to work - Taxicab (%)
Means of transportation to work - Motorcycle (%)
Means of transportation to work - Bicycle (%)
Means of transportation to work - Walked (%)
Means of transportation to work - Other means (%)
Working at home (%)
Industry diversity
Most Common Industries - Agriculture, forestry, fishing and hunting, and mining (%)
Most Common Industries - Agriculture, forestry, fishing and hunting (%)
Most Common Industries - Mining, quarrying, and oil and gas extraction (%)
Most Common Industries - Construction (%)
Most Common Industries - Manufacturing (%)
Most Common Industries - Wholesale trade (%)
Most Common Industries - Retail trade (%)
Most Common Industries - Transportation and warehousing, and utilities (%)
Most Common Industries - Transportation and warehousing (%)
Most Common Industries - Utilities (%)
Most Common Industries - Information (%)
Most Common Industries - Finance and insurance, and real estate and rental and leasing (%)
Most Common Industries - Finance and insurance (%)
Most Common Industries - Real estate and rental and leasing (%)
Most Common Industries - Professional, scientific, and management, and administrative and waste management services (%)
Most Common Industries - Professional, scientific, and technical services (%)
Most Common Industries - Management of companies and enterprises (%)
Most Common Industries - Administrative and support and waste management services (%)
Most Common Industries - Educational services, and health care and social assistance (%)
Most Common Industries - Educational services (%)
Most Common Industries - Health care and social assistance (%)
Most Common Industries - Arts, entertainment, and recreation, and accommodation and food services (%)
Most Common Industries - Arts, entertainment, and recreation (%)
Most Common Industries - Accommodation and food services (%)
Most Common Industries - Other services, except public administration (%)
Most Common Industries - Public administration (%)
Occupation diversity
Most Common Occupations - Management, business, science, and arts occupations (%)
Most Common Occupations - Management, business, and financial occupations (%)
Most Common Occupations - Management occupations (%)
Most Common Occupations - Business and financial operations occupations (%)
Most Common Occupations - Computer, engineering, and science occupations (%)
Most Common Occupations - Computer and mathematical occupations (%)
Most Common Occupations - Architecture and engineering occupations (%)
Most Common Occupations - Life, physical, and social science occupations (%)
Most Common Occupations - Education, legal, community service, arts, and media occupations (%)
Most Common Occupations - Community and social service occupations (%)
Most Common Occupations - Legal occupations (%)
Most Common Occupations - Education, training, and library occupations (%)
Most Common Occupations - Arts, design, entertainment, sports, and media occupations (%)
Most Common Occupations - Healthcare practitioners and technical occupations (%)
Most Common Occupations - Health diagnosing and treating practitioners and other technical occupations (%)
Most Common Occupations - Health technologists and technicians (%)
Most Common Occupations - Service occupations (%)
Most Common Occupations - Healthcare support occupations (%)
Most Common Occupations - Protective service occupations (%)
Most Common Occupations - Fire fighting and prevention, and other protective service workers including supervisors (%)
Most Common Occupations - Law enforcement workers including supervisors (%)
Most Common Occupations - Food preparation and serving related occupations (%)
Most Common Occupations - Building and grounds cleaning and maintenance occupations (%)
Most Common Occupations - Personal care and service occupations (%)
Most Common Occupations - Sales and office occupations (%)
Most Common Occupations - Sales and related occupations (%)
Most Common Occupations - Office and administrative support occupations (%)
Most Common Occupations - Natural resources, construction, and maintenance occupations (%)
Most Common Occupations - Farming, fishing, and forestry occupations (%)
Most Common Occupations - Construction and extraction occupations (%)
Most Common Occupations - Installation, maintenance, and repair occupations (%)
Most Common Occupations - Production, transportation, and material moving occupations (%)
Most Common Occupations - Production occupations (%)
Most Common Occupations - Transportation occupations (%)
Most Common Occupations - Material moving occupations (%)
People in Group quarters - Institutionalized population (%)
People in Group quarters - Correctional institutions (%)
People in Group quarters - Federal prisons and detention centers (%)
People in Group quarters - Halfway houses (%)
People in Group quarters - Local jails and other confinement facilities (including police lockups) (%)
People in Group quarters - Military disciplinary barracks (%)
People in Group quarters - State prisons (%)
People in Group quarters - Other types of correctional institutions (%)
People in Group quarters - Nursing homes (%)
People in Group quarters - Hospitals/wards, hospices, and schools for the handicapped (%)
People in Group quarters - Hospitals/wards and hospices for chronically ill (%)
People in Group quarters - Hospices or homes for chronically ill (%)
People in Group quarters - Military hospitals or wards for chronically ill (%)
People in Group quarters - Other hospitals or wards for chronically ill (%)
People in Group quarters - Hospitals or wards for drug/alcohol abuse (%)
People in Group quarters - Mental (Psychiatric) hospitals or wards (%)
People in Group quarters - Schools, hospitals, or wards for the mentally retarded (%)
People in Group quarters - Schools, hospitals, or wards for the physically handicapped (%)
People in Group quarters - Institutions for the deaf (%)
People in Group quarters - Institutions for the blind (%)
People in Group quarters - Orthopedic wards and institutions for the physically handicapped (%)
People in Group quarters - Wards in general hospitals for patients who have no usual home elsewhere (%)
People in Group quarters - Wards in military hospitals for patients who have no usual home elsewhere (%)
People in Group quarters - Juvenile institutions (%)
People in Group quarters - Long-term care (%)
People in Group quarters - Homes for abused, dependent, and neglected children (%)
People in Group quarters - Residential treatment centers for emotionally disturbed children (%)
People in Group quarters - Training schools for juvenile delinquents (%)
People in Group quarters - Short-term care, detention or diagnostic centers for delinquent children (%)
People in Group quarters - Type of juvenile institution unknown (%)
People in Group quarters - Noninstitutionalized population (%)
People in Group quarters - College dormitories (includes college quarters off campus) (%)
People in Group quarters - Military quarters (%)
People in Group quarters - On base (%)
People in Group quarters - Barracks, unaccompanied personnel housing (UPH), (Enlisted/Officer), ;and similar group living quarters for military personnel (%)
People in Group quarters - Transient quarters for temporary residents (%)
People in Group quarters - Military ships (%)
People in Group quarters - Group homes (%)
People in Group quarters - Homes or halfway houses for drug/alcohol abuse (%)
People in Group quarters - Homes for the mentally ill (%)
People in Group quarters - Homes for the mentally retarded (%)
People in Group quarters - Homes for the physically handicapped (%)
People in Group quarters - Other group homes (%)
People in Group quarters - Religious group quarters (%)
People in Group quarters - Dormitories (%)
People in Group quarters - Agriculture workers' dormitories on farms (%)
People in Group quarters - Job Corps and vocational training facilities (%)
People in Group quarters - Other workers' dormitories (%)
People in Group quarters - Crews of maritime vessels (%)
People in Group quarters - Other nonhousehold living situations (%)
People in Group quarters - Other noninstitutional group quarters (%)
Residents speaking English at home (%)
Residents speaking English at home - Born in the United States (%)
Residents speaking English at home - Native, born elsewhere (%)
Residents speaking English at home - Foreign born (%)
Residents speaking Spanish at home (%)
Residents speaking Spanish at home - Born in the United States (%)
Residents speaking Spanish at home - Native, born elsewhere (%)
Residents speaking Spanish at home - Foreign born (%)
Residents speaking other language at home (%)
Residents speaking other language at home - Born in the United States (%)
Residents speaking other language at home - Native, born elsewhere (%)
Residents speaking other language at home - Foreign born (%)
Class of Workers - Employee of private company (%)
Class of Workers - Self-employed in own incorporated business (%)
Class of Workers - Private not-for-profit wage and salary workers (%)
Class of Workers - Local government workers (%)
Class of Workers - State government workers (%)
Class of Workers - Federal government workers (%)
Class of Workers - Self-employed workers in own not incorporated business and Unpaid family workers (%)
House heating fuel used in houses and condos - Utility gas (%)
House heating fuel used in houses and condos - Bottled, tank, or LP gas (%)
House heating fuel used in houses and condos - Electricity (%)
House heating fuel used in houses and condos - Fuel oil, kerosene, etc. (%)
House heating fuel used in houses and condos - Coal or coke (%)
House heating fuel used in houses and condos - Wood (%)
House heating fuel used in houses and condos - Solar energy (%)
House heating fuel used in houses and condos - Other fuel (%)
House heating fuel used in houses and condos - No fuel used (%)
House heating fuel used in apartments - Utility gas (%)
House heating fuel used in apartments - Bottled, tank, or LP gas (%)
House heating fuel used in apartments - Electricity (%)
House heating fuel used in apartments - Fuel oil, kerosene, etc. (%)
House heating fuel used in apartments - Coal or coke (%)
House heating fuel used in apartments - Wood (%)
House heating fuel used in apartments - Solar energy (%)
House heating fuel used in apartments - Other fuel (%)
House heating fuel used in apartments - No fuel used (%)
Armed forces status - In Armed Forces (%)
Armed forces status - Civilian (%)
Armed forces status - Civilian - Veteran (%)
Armed forces status - Civilian - Nonveteran (%)
Fatal accidents locations in years 2005-2021
Fatal accidents locations in 2005
Fatal accidents locations in 2006
Fatal accidents locations in 2007
Fatal accidents locations in 2008
Fatal accidents locations in 2009
Fatal accidents locations in 2010
Fatal accidents locations in 2011
Fatal accidents locations in 2012
Fatal accidents locations in 2013
Fatal accidents locations in 2014
Fatal accidents locations in 2015
Fatal accidents locations in 2016
Fatal accidents locations in 2017
Fatal accidents locations in 2018
Fatal accidents locations in 2019
Fatal accidents locations in 2020
Fatal accidents locations in 2021
Alcohol use - People drinking some alcohol every month (%)
Alcohol use - People not drinking at all (%)
Alcohol use - Average days/month drinking alcohol
Alcohol use - Average drinks/week
Alcohol use - Average days/year people drink much
Audiometry - Average condition of hearing (%)
Audiometry - People that can hear a whisper from across a quiet room (%)
Audiometry - People that can hear normal voice from across a quiet room (%)
Audiometry - Ears ringing, roaring, buzzing (%)
Audiometry - Had a job exposure to loud noise (%)
Audiometry - Had off-work exposure to loud noise (%)
Blood Pressure & Cholesterol - Has high blood pressure (%)
Blood Pressure & Cholesterol - Checking blood pressure at home (%)
Blood Pressure & Cholesterol - Frequently checking blood cholesterol (%)
Blood Pressure & Cholesterol - Has high cholesterol level (%)
Consumer Behavior - Money monthly spent on food at supermarket/grocery store
Consumer Behavior - Money monthly spent on food at other stores
Consumer Behavior - Money monthly spent on eating out
Consumer Behavior - Money monthly spent on carryout/delivered foods
Consumer Behavior - Income spent on food at supermarket/grocery store (%)
Consumer Behavior - Income spent on food at other stores (%)
Consumer Behavior - Income spent on eating out (%)
Consumer Behavior - Income spent on carryout/delivered foods (%)
Current Health Status - General health condition (%)
Current Health Status - Blood donors (%)
Current Health Status - Has blood ever tested for HIV virus (%)
Current Health Status - Left-handed people (%)
Dermatology - People using sunscreen (%)
Diabetes - Diabetics (%)
Diabetes - Had a blood test for high blood sugar (%)
Diabetes - People taking insulin (%)
Diet Behavior & Nutrition - Diet health (%)
Diet Behavior & Nutrition - Milk product consumption (# of products/month)
Diet Behavior & Nutrition - Meals not home prepared (#/week)
Diet Behavior & Nutrition - Meals from fast food or pizza place (#/week)
Diet Behavior & Nutrition - Ready-to-eat foods (#/month)
Diet Behavior & Nutrition - Frozen meals/pizza (#/month)
Drug Use - People that ever used marijuana or hashish (%)
Drug Use - Ever used hard drugs (%)
Drug Use - Ever used any form of cocaine (%)
Drug Use - Ever used heroin (%)
Drug Use - Ever used methamphetamine (%)
Health Insurance - People covered by health insurance (%)
Kidney Conditions-Urology - Avg. # of times urinating at night
Medical Conditions - People with asthma (%)
Medical Conditions - People with anemia (%)
Medical Conditions - People with psoriasis (%)
Medical Conditions - People with overweight (%)
Medical Conditions - Elderly people having difficulties in thinking or remembering (%)
Medical Conditions - People who ever received blood transfusion (%)
Medical Conditions - People having trouble seeing even with glass/contacts (%)
Medical Conditions - People with arthritis (%)
Medical Conditions - People with gout (%)
Medical Conditions - People with congestive heart failure (%)
Medical Conditions - People with coronary heart disease (%)
Medical Conditions - People with angina pectoris (%)
Medical Conditions - People who ever had heart attack (%)
Medical Conditions - People who ever had stroke (%)
Medical Conditions - People with emphysema (%)
Medical Conditions - People with thyroid problem (%)
Medical Conditions - People with chronic bronchitis (%)
Medical Conditions - People with any liver condition (%)
Medical Conditions - People who ever had cancer or malignancy (%)
Mental Health - People who have little interest in doing things (%)
Mental Health - People feeling down, depressed, or hopeless (%)
Mental Health - People who have trouble sleeping or sleeping too much (%)
Mental Health - People feeling tired or having little energy (%)
Mental Health - People with poor appetite or overeating (%)
Mental Health - People feeling bad about themself (%)
Mental Health - People who have trouble concentrating on things (%)
Mental Health - People moving or speaking slowly or too fast (%)
Mental Health - People having thoughts they would be better off dead (%)
Oral Health - Average years since last visit a dentist
Oral Health - People embarrassed because of mouth (%)
Oral Health - People with gum disease (%)
Oral Health - General health of teeth and gums (%)
Oral Health - Average days a week using dental floss/device
Oral Health - Average days a week using mouthwash for dental problem
Oral Health - Average number of teeth
Pesticide Use - Households using pesticides to control insects (%)
Pesticide Use - Households using pesticides to kill weeds (%)
Physical Activity - People doing vigorous-intensity work activities (%)
Physical Activity - People doing moderate-intensity work activities (%)
Physical Activity - People walking or bicycling (%)
Physical Activity - People doing vigorous-intensity recreational activities (%)
Physical Activity - People doing moderate-intensity recreational activities (%)
Physical Activity - Average hours a day doing sedentary activities
Physical Activity - Average hours a day watching TV or videos
Physical Activity - Average hours a day using computer
Physical Functioning - People having limitations keeping them from working (%)
Physical Functioning - People limited in amount of work they can do (%)
Physical Functioning - People that need special equipment to walk (%)
Physical Functioning - People experiencing confusion/memory problems (%)
Physical Functioning - People requiring special healthcare equipment (%)
Prescription Medications - Average number of prescription medicines taking
Preventive Aspirin Use - Adults 40+ taking low-dose aspirin (%)
Reproductive Health - Vaginal deliveries (%)
Reproductive Health - Cesarean deliveries (%)
Reproductive Health - Deliveries resulted in a live birth (%)
Reproductive Health - Pregnancies resulted in a delivery (%)
Reproductive Health - Women breastfeeding newborns (%)
Reproductive Health - Women that had a hysterectomy (%)
Reproductive Health - Women that had both ovaries removed (%)
Reproductive Health - Women that have ever taken birth control pills (%)
Reproductive Health - Women taking birth control pills (%)
Reproductive Health - Women that have ever used Depo-Provera or injectables (%)
Reproductive Health - Women that have ever used female hormones (%)
Sexual Behavior - People 18+ that ever had sex (vaginal, anal, or oral) (%)
Sexual Behavior - Males 18+ that ever had vaginal sex with a woman (%)
Sexual Behavior - Males 18+ that ever performed oral sex on a woman (%)
Sexual Behavior - Males 18+ that ever had anal sex with a woman (%)
Sexual Behavior - Males 18+ that ever had any sex with a man (%)
Sexual Behavior - Females 18+ that ever had vaginal sex with a man (%)
Sexual Behavior - Females 18+ that ever performed oral sex on a man (%)
Sexual Behavior - Females 18+ that ever had anal sex with a man (%)
Sexual Behavior - Females 18+ that ever had any kind of sex with a woman (%)
Sexual Behavior - Average age people first had sex
Sexual Behavior - Average number of female sex partners in lifetime (males 18+)
Sexual Behavior - Average number of female vaginal sex partners in lifetime (males 18+)
Sexual Behavior - Average age people first performed oral sex on a woman (18+)
Sexual Behavior - Average number of woman performed oral sex on in lifetime (18+)
Sexual Behavior - Average number of male sex partners in lifetime (males 18+)
Sexual Behavior - Average number of male anal sex partners in lifetime (males 18+)
Sexual Behavior - Average age people first performed oral sex on a man (18+)
Sexual Behavior - Average number of male oral sex partners in lifetime (18+)
Sexual Behavior - People using protection when performing oral sex (%)
Sexual Behavior - Average number of times people have vaginal or anal sex a year
Sexual Behavior - People having sex without condom (%)
Sexual Behavior - Average number of male sex partners in lifetime (females 18+)
Sexual Behavior - Average number of male vaginal sex partners in lifetime (females 18+)
Sexual Behavior - Average number of female sex partners in lifetime (females 18+)
Sexual Behavior - Circumcised males 18+ (%)
Sleep Disorders - Average hours sleeping at night
Sleep Disorders - People that has trouble sleeping (%)
Smoking-Cigarette Use - People smoking cigarettes (%)
Taste & Smell - People 40+ having problems with smell (%)
Taste & Smell - People 40+ having problems with taste (%)
Taste & Smell - People 40+ that ever had wisdom teeth removed (%)
Taste & Smell - People 40+ that ever had tonsils teeth removed (%)
Taste & Smell - People 40+ that ever had a loss of consciousness because of a head injury (%)
Taste & Smell - People 40+ that ever had a broken nose or other serious injury to face or skull (%)
Taste & Smell - People 40+ that ever had two or more sinus infections (%)
Weight - Average height (inches)
Weight - Average weight (pounds)
Weight - Average BMI
Weight - People that are obese (%)
Weight - People that ever were obese (%)
Weight - People trying to lose weight (%)
Urban population: 24,567
Rural population: 985
Estimated median house/condo value in 2022: $251,457
32763:
$251,457Florida:
$354,100
Median resident age: This zip code:
44.6 yearsFlorida median age:
42.7 years
Average household size: This zip code:
2.3 peopleFlorida:
2.5 people
Averages for the 2020 tax year for zip code 32763, filed in 2021:
Average Adjusted Gross Income (AGI) in 2020: $48,865 (Individual Income Tax Returns) Here:
$48,865State:
$82,200
Salary/wage: $41,516 (reported on 79.8% of returns )Here:
$41,516State:
$58,347
(% of AGI for various income ranges: 1159.5% for AGIs below $25k , 3526.9% for AGIs $25k-50k , 6524.4% for AGIs $50k-75k , 9286.1% for AGIs $75k-100k , 15246.8% for AGIs $100k-200k , 46837.5% for AGIs over 200k ) Taxable interest for individuals: $1,638 (reported on 19.2% of returns )This zip code:
$1,638Florida:
$4,272
(% of AGI for various income ranges: 11.0% for AGIs below $25k , 17.2% for AGIs $25k-50k , 30.9% for AGIs $50k-75k , 71.9% for AGIs $75k-100k , 220.2% for AGIs $100k-200k , 1980.0% for AGIs over 200k ) Ordinary dividends: $7,492 (reported on 12.7% of returns )(% of AGI for various income ranges: 17.6% for AGIs below $25k , 25.0% for AGIs $25k-50k , 86.9% for AGIs $50k-75k , 218.0% for AGIs $75k-100k , 568.1% for AGIs $100k-200k , 10932.5% for AGIs over 200k ) Net capital gain/loss in AGI: +$12,172 (reported on 11.3% of returns )Here:
+$12,172State:
+$62,983
(% of AGI for various income ranges: 6.7% for AGIs below $25k , 24.3% for AGIs $25k-50k , 80.4% for AGIs $50k-75k , 180.5% for AGIs $75k-100k , 744.3% for AGIs $100k-200k , 22902.5% for AGIs over 200k ) Profit/loss from business: +$6,090 (reported on 14.8% of returns )Here:
+$6,090State:
+$9,719
(% of AGI for various income ranges: 122.9% for AGIs below $25k , 67.8% for AGIs $25k-50k , 116.7% for AGIs $50k-75k , 166.4% for AGIs $75k-100k , 286.6% for AGIs $100k-200k , 755.0% for AGIs over 200k ) Taxable individual retirement arrangement distribution: $15,139 (reported on 8.3% of returns )32763:
$15,139Florida:
$24,823
(% of AGI for various income ranges: 48.4% for AGIs below $25k , 82.2% for AGIs $25k-50k , 176.3% for AGIs $50k-75k , 411.7% for AGIs $75k-100k , 821.1% for AGIs $100k-200k , 3685.0% for AGIs over 200k ) Total itemized deductions: $32,302 (reported on 4.1% of returns )Here:
$32,302State:
$45,393
(% of AGI for various income ranges: 39.8% for AGIs below $25k , 87.2% for AGIs $25k-50k , 265.1% for AGIs $50k-75k , 378.3% for AGIs $75k-100k , 647.7% for AGIs $100k-200k , 5980.0% for AGIs over 200k ) Charity contributions: $9,234 (reported on 3.2% of returns )(% of AGI for various income ranges: 2.8% for AGIs below $25k , 11.1% for AGIs $25k-50k , 49.6% for AGIs $50k-75k , 77.7% for AGIs $75k-100k , 180.8% for AGIs $100k-200k , 2382.5% for AGIs over 200k ) Taxes paid: $4,011 (reported on 3.9% of returns )(% of AGI for various income ranges: 4.6% for AGIs below $25k , 10.4% for AGIs $25k-50k , 39.0% for AGIs $50k-75k , 43.8% for AGIs $75k-100k , 74.3% for AGIs $100k-200k , 430.0% for AGIs over 200k ) Earned income credit: $2,351 (reported on 21.3% of returns )(% of AGI for various income ranges: 112.4% for AGIs below $25k , 69.0% for AGIs $25k-50k , 0.9% for AGIs $50k-75k ) Percentage of individuals using paid preparers for their 2020 taxes: 93.2%(% for various income ranges: 92.7% for AGIs below $25k , 93.7% for AGIs $25k-50k , 93.5% for AGIs $50k-75k , 93.8% for AGIs $75k-100k , 92.5% for AGIs $100k-200k , 93.3% for AGIs over 200k )
Averages for the 2012 tax year for zip code 32763, filed in 2013:
Average Adjusted Gross Income (AGI) in 2012: $38,392 (Individual Income Tax Returns) Here:
$38,392State:
$60,316
Salary/wage: $34,073 (reported on 79.2% of returns )Here:
$34,073State:
$45,277
(% of AGI for various income ranges: 72.5% for AGIs below $25k , 79.5% for AGIs $25k-50k , 73.0% for AGIs $50k-75k , 68.8% for AGIs $75k-100k , 65.7% for AGIs $100k-200k , 29.5% for AGIs over 200k ) Taxable interest for individuals: $1,550 (reported on 23.9% of returns )This zip code:
$1,550Florida:
$3,587
(% of AGI for various income ranges: 1.2% for AGIs below $25k , 0.7% for AGIs $25k-50k , 0.9% for AGIs $50k-75k , 1.2% for AGIs $75k-100k , 0.9% for AGIs $100k-200k , 1.5% for AGIs over 200k ) Ordinary dividends: $5,436 (reported on 15.1% of returns )(% of AGI for various income ranges: 1.8% for AGIs below $25k , 1.3% for AGIs $25k-50k , 2.2% for AGIs $50k-75k , 2.2% for AGIs $75k-100k , 3.1% for AGIs $100k-200k , 3.9% for AGIs over 200k ) Net capital gain/loss in AGI: +$2,975 (reported on 11.5% of returns )Here:
+$2,975State:
+$33,493
(% of AGI for various income ranges: 0.1% for AGIs $25k-50k , 0.5% for AGIs $50k-75k , 0.7% for AGIs $75k-100k , 2.5% for AGIs $100k-200k , 4.8% for AGIs over 200k ) Profit/loss from business: +$6,508 (reported on 13.1% of returns )Here:
+$6,508State:
+$10,012
(% of AGI for various income ranges: 6.9% for AGIs below $25k , 1.1% for AGIs $25k-50k , 1.2% for AGIs $50k-75k , 1.5% for AGIs $75k-100k , 2.4% for AGIs $100k-200k ) Taxable individual retirement arrangement distribution: $12,344 (reported on 10.6% of returns )32763:
$12,344Florida:
$21,544
(% of AGI for various income ranges: 2.9% for AGIs below $25k , 2.5% for AGIs $25k-50k , 2.7% for AGIs $50k-75k , 3.6% for AGIs $75k-100k , 7.7% for AGIs $100k-200k ) Total itemized deductions: $19,043 (29% of AGI, reported on 19.7% of returns )Here:
$19,043State:
$25,533
Here:
29.1% of AGIState:
18.0% of AGI
(% of AGI for various income ranges: 7.5% for AGIs below $25k , 8.8% for AGIs $25k-50k , 10.6% for AGIs $50k-75k , 11.7% for AGIs $75k-100k , 12.1% for AGIs $100k-200k , 6.8% for AGIs over 200k ) Charity contributions: $3,387 (reported on 14.4% of returns )(% of AGI for various income ranges: 0.4% for AGIs below $25k , 0.8% for AGIs $25k-50k , 1.4% for AGIs $50k-75k , 1.6% for AGIs $75k-100k , 2.4% for AGIs $100k-200k , 1.3% for AGIs over 200k ) Taxes paid: $2,837 (reported on 19.0% of returns )(% of AGI for various income ranges: 0.8% for AGIs below $25k , 1.1% for AGIs $25k-50k , 1.4% for AGIs $50k-75k , 1.6% for AGIs $75k-100k , 2.2% for AGIs $100k-200k , 1.9% for AGIs over 200k ) Earned income credit: $2,333 (reported on 25.6% of returns )(% of AGI for various income ranges: 7.6% for AGIs below $25k , 1.3% for AGIs $25k-50k ) Percentage of individuals using paid preparers for their 2012 taxes: 45.2%(% for various income ranges: 43.1% for AGIs below $25k , 42.6% for AGIs $25k-50k , 49.2% for AGIs $50k-75k , 50.8% for AGIs $75k-100k , 58.1% for AGIs $100k-200k , 80.0% for AGIs over 200k )
Averages for the 2004 tax year for zip code 32763, filed in 2005:
Average Adjusted Gross Income (AGI) in 2004: $33,589 (Individual Income Tax Returns) Here:
$33,589State:
$50,523
Salary/wage: $30,437 (reported on 78.5% of returns )Here:
$30,437State:
$39,563
(% of AGI for various income ranges: 97.3% for AGIs below $10k , 73.5% for AGIs $10k-25k , 76.0% for AGIs $25k-50k , 73.4% for AGIs $50k-75k , 70.8% for AGIs $75k-100k , 52.4% for AGIs over 100k ) Taxable interest for individuals: $2,057 (reported on 36.5% of returns )This zip code:
$2,057Florida:
$3,211
(% of AGI for various income ranges: 5.6% for AGIs below $10k , 2.9% for AGIs $10k-25k , 1.8% for AGIs $25k-50k , 1.8% for AGIs $50k-75k , 1.9% for AGIs $75k-100k , 2.9% for AGIs over 100k ) Taxable dividends: $3,438 (reported on 19.5% of returns )(% of AGI for various income ranges: 4.3% for AGIs below $10k , 1.9% for AGIs $10k-25k , 1.5% for AGIs $25k-50k , 2.0% for AGIs $50k-75k , 1.4% for AGIs $75k-100k , 3.1% for AGIs over 100k ) Net capital gain/loss: +$4,574 (reported on 16.4% of returns )Here:
+$4,574State:
+$27,205
(% of AGI for various income ranges: -0.8% for AGIs below $10k , 0.7% for AGIs $10k-25k , 0.8% for AGIs $25k-50k , 2.0% for AGIs $50k-75k , 3.0% for AGIs $75k-100k , 6.9% for AGIs over 100k ) Profit/loss from business: +$6,652 (reported on 12.0% of returns )Here:
+$6,652State:
+$10,634
(% of AGI for various income ranges: 7.8% for AGIs below $10k , 4.0% for AGIs $10k-25k , 2.3% for AGIs $25k-50k , 1.9% for AGIs $50k-75k , 2.9% for AGIs $75k-100k , 0.2% for AGIs over 100k ) Profit/loss from farming: +$357 (reported on 0.2% of returns )
Here : State :
IRA payment deduction: $2,777 (reported on 2.1% of returns )32763:
$2,777Florida:
$3,082
(% of AGI for various income ranges: 0.2% for AGIs $10k-25k , 0.2% for AGIs $25k-50k , 0.2% for AGIs $50k-75k , 0.2% for AGIs $75k-100k , 0.1% for AGIs over 100k ) Total itemized deductions: $16,164 (31% of AGI, reported on 24.3% of returns )Here:
$16,164State:
$20,370
Here:
30.5% of AGIState:
20.7% of AGI
(% of AGI for various income ranges: 18.0% for AGIs below $10k , 10.7% for AGIs $10k-25k , 11.4% for AGIs $25k-50k , 11.6% for AGIs $50k-75k , 13.0% for AGIs $75k-100k , 11.4% for AGIs over 100k ) Charity contributions deductions: $2,718 (5% of AGI, reported on 18.8% of returns )Here:
4.8% of AGIState:
3.8% of AGI
(% of AGI for various income ranges: 0.8% for AGIs below $10k , 0.9% for AGIs $10k-25k , 1.0% for AGIs $25k-50k , 1.5% for AGIs $50k-75k , 2.0% for AGIs $75k-100k , 3.0% for AGIs over 100k ) Total tax: $4,093 (reported on 72.0% of returns )(% of AGI for various income ranges: 2.9% for AGIs below $10k , 3.7% for AGIs $10k-25k , 6.4% for AGIs $25k-50k , 8.6% for AGIs $50k-75k , 10.5% for AGIs $75k-100k , 18.3% for AGIs over 100k ) Earned income credit: $1,646 (reported on 19.4% of returns )Percentage of individuals using paid preparers for their 2004 taxes: 54.8%(% for various income ranges: 48.6% for AGIs below $10k , 55.4% for AGIs $10k-25k , 53.7% for AGIs $25k-50k , 60.0% for AGIs $50k-75k , 57.1% for AGIs $75k-100k , 71.1% for AGIs over 100k )
Estimated median household income in 2022: This zip code:
$62,701Florida:
$69,303
Nearest zip codes: 32713 ,
32725 ,
32744 ,
32720 ,
32738 ,
32771 .
Orange City Zip Code Map
Percentage of family households: This zip code:
42.5%Florida:
41.2%
Percentage of households with unmarried partners: This zip code:
5.4%Florida:
46.7%
Likely homosexual households (counted as self-reported same-sex unmarried-partner households)
Lesbian couples: 0.1% of all households Gay men: 0.0% of all households
Household received Food Stamps/SNAP in the past 12 months: 1,992Household did not receive Food Stamps/SNAP in the past 12 months: 8,998
Women who had a birth in the past 12 months: 242 (58 now married , 170 unmarried) Women who did not have a birth in the past 12 months: 5,400 (2,388 now married , 3,012 unmarried)
Housing units in zip code 32763 with a mortgage: 4,441 (257
second mortgage , 229
both second mortgage and home equity loan )
Houses without a mortgage: 58
Median monthly owner costs for units with a mortgage: $1,326
Median monthly owner costs for units without a mortgage: $526
Residents with income below the poverty level in 2022:
This zip code:
11.8%Whole state:
12.7%
Residents with income below 50% of the poverty level in 2022:
This zip code:
6.3%Whole state:
6.6%
Median number of rooms in houses and condos: Median number of rooms in apartments: Notable locations in this zip code not listed on our city pages
Click to draw/clear zip code borders Notable locations in zip code 32763: (A) , Providence Plaza (B) , Village Market Place of Orange City (C) , Market Square (D) , Starks Landing (E) , Pine Lakes Country Club (F) , Greater Orange City Chamber of Commerce (G) , Florida Hospital Fish Memorial Library (H) , Volusia County Public Library System Orange City Dickinson Memorial Library (I) , Orange City Fire Department (J) , Volusia County Fire Services Station 31 Spring Lakes (K) , Orange City Police Department (L) , Orange City Fire Department Station 68 (M) . Display/hide their locations on the map
Churches in zip code 32763 include: (A) , United Church of Christ (B) , Saint Judes Episcopal Church (C) , Orange City United Methodist Church (D) , New Life Bible Church (E) , Individual Freedom Ministries Church (F) , First Baptist Church of Orange City (G) , Faith Community Church of Central Florida (H) , Emmaus Lutheran Church (I) . Display/hide their locations on the map
Cemeteries: (1) , Missionary Baptist Church Cemetery (2) , Lincoln Cemetery (3) . Display/hide their locations on the map
Lakes and swamps: (A) , Goose Lake (B) . Display/hide their locations on the map
Park in zip code 32763: (1) . Display/hide its location on the map
Year house built (houses)
144 2020 or later767 2010 to 20193,357 2000 to 20091,725 1990 to 19992,566 1980 to 19891,452 1970 to 1979621 1960 to 1969670 1950 to 195964 1940 to 1949174 1939 or earlier
Zip code 32763 household income distribution in 2022 617 Less than $10,000429 $10,000 to $14,999435 $15,000 to $19,999496 $20,000 to $24,999424 $25,000 to $29,9991,059 $30,000 to $34,999365 $35,000 to $39,999392 $40,000 to $44,999453 $45,000 to $49,999590 $50,000 to $59,999999 $60,000 to $74,9991,663 $75,000 to $99,999917 $100,000 to $124,999740 $125,000 to $149,999596 $150,000 to $199,999815 $200,000 or moreEstimate of home value of owner-occupied houses/condos in 2022 in zip code 32763 115 Less than $10,00077 $10,000 to $14,99972 $15,000 to $19,99986 $20,000 to $24,99944 $25,000 to $29,99935 $30,000 to $34,99944 $35,000 to $39,99982 $40,000 to $49,99954 $50,000 to $59,99943 $60,000 to $69,99978 $70,000 to $79,99927 $80,000 to $89,99953 $90,000 to $99,999183 $100,000 to $124,999234 $125,000 to $149,999492 $150,000 to $174,999631 $175,000 to $199,999934 $200,000 to $249,999794 $250,000 to $299,999844 $300,000 to $399,999487 $400,000 to $499,999104 $500,000 to $749,999163 $1,000,000 to $1,499,999Rent paid by renters in 2022 in zip code 32763 39 $100 to $1499 $150 to $199142 $200 to $24986 $300 to $34916 $350 to $39921 $500 to $54933 $550 to $59939 $600 to $64919 $650 to $6998 $700 to $749163 $750 to $799285 $800 to $899322 $900 to $999584 $1,000 to $1,249605 $1,250 to $1,499671 $1,500 to $1,999190 $2,000 to $2,499237 $2,500 to $2,999147 $3,000 to $3,499149 $3,500 or more330 No cash rent
Median gross rent in 2022: $1,443.
Median price asked for vacant for-sale houses and condos in 2022: $178,395.
Estimated median house (or condo) value in 2022 for: White Non-Hispanic householders: $287,489Black or African American householders: $275,606American Indian or Alaska Native householders: $309,338Asian householders: $303,971Some other race householders: $251,073Two or more races householders: $172,493Hispanic or Latino householders: $285,955Estimated median house or condo value in 2022: $251,457
32763:
$251,457Florida:
$354,100
Lower value quartile - upper value quartile: $187,060 - $331,564
Mean price in 2022: Detached houses: $366,726Here:
$366,726State:
$500,941
Townhouses or other attached units: $278,368Here:
$278,368State:
$370,869
In 2-unit structures: $428,490Here:
$428,490State:
$423,188
In 3-to-4-unit structures: $333,991Here:
$333,991State:
$309,944
In 5-or-more-unit structures: $493,967Here:
$493,967State:
$447,145
Mobile homes: $85,247Here:
$85,247State:
$113,202
Occupied boats, RVs, vans, etc.: $143,869Here:
$143,869State:
$73,933
Housing units in structures:
One, detached: 7,785One, attached: 328Two: 4533 or 4: 3305 to 9: 27510 to 19: 44120 to 49: 39250 or more: 711Mobile homes: 1,032Boats, RVs, vans, etc.: 80Unemployment : 3.5%
Means of transportation to work in zip code 32763 76.6% 9,367 Drove a car alone5.5% 669 Carpooled0.1% 17 Taxi0.3% 38 Motorcycle0.2% 21 Bicycle0.7% 85 Walked1.4% 176 Other means14.3% 1,746 Worked at homeTravel time to work (commute) in zip code 32763 107 Less than 5 minutes984 5 to 9 minutes1,178 10 to 14 minutes1,187 15 to 19 minutes1,546 20 to 24 minutes784 25 to 29 minutes1,409 30 to 34 minutes292 35 to 39 minutes341 40 to 44 minutes1,087 45 to 59 minutes1,187 60 to 89 minutes302 90 or more minutes
Neighborhoods in zip code 32763: Percentage of zip code residents living and working in this county: 67.7%
Household type by relationship:
Households: 25,553
Male householders: 5,602 (1,361 living alone ), Female householders: 5,429 (1,901 living alone )5,053 spouses (5,053 opposite-sex spouses ), 934 unmarried partners , (895 opposite-sex unmarried partners ), 6,442 children (6,079 natural , 109 adopted , 254 stepchildren ), 394 grandchildren , 173 brothers or sisters , 222 parents , 15 foster children , 261 other relatives , 708 non-relatives In group quarters: 422 (-1 institutionalized population )
Size of family households: 3,306 2-persons , 1,829 3-persons , 1,002 4-persons , 451 5-persons , 177 6-persons , 36 7-or-more-persons
Size of nonfamily households: 3,263 1-person , 781 2-persons , 43 3-persons , 123 4-persons , 26 5-persons
2,353 married couples with children. single-parent households (294 men , 1,696 women ).
84.5% of residents of 32763 zip code speak English at home. of residents speak Spanish at home (85% very well, 13% well, 2% not well ).of residents speak other Indo-European language at home (73% very well, 27% well ).of residents speak Asian or Pacific Island language at home (73% very well, 16% well, 11% not well ).of residents speak other language at home (77% very well, 23% well ).
Foreign born population: 1,756 (6.9%)
(65.2%
of them are naturalized citizens )
This zip code:
6.9%Whole state:
21.7%
23% Haiti 9% Chile 8% Barbados 8% Germany 5% Thailand 3% Grenada 3% El Salvador 9% American 7% Irish 5% German 4% English 4% Italian 3% Jamaican 2% Polish
Year of entry for the foreign-born population
859 2010 or later 499 2000 to 2009 500 1990 to 1999 1,408 Before 1990
There are
265 Other Medical Specialists in Zip Code 32763.
Major facilities with environmental interests located in this zip code:
ORANGE CITY WALMART SUPERCTR (2400 VETERANS MEMORIAL PKWY in ORANGE CITY, FL)
National Pollutant Discharge Elimination System NON-MAJOR (Tracking pollutant discharge elimination systems) - permit National Pollutant Discharge Elimination System NON-MAJOR (Tracking pollutant discharge elimination systems) - permit National Pollutant Discharge Elimination System NON-MAJOR (Tracking pollutant discharge elimination systems) - permit National Pollutant Discharge Elimination System NON-MAJOR (Tracking pollutant discharge elimination systems) - permit Alternative names: CASE CONTRACTING COMPANY, HENSEL PHELPS CONSTRUCTION CO, J ROBERT BRAY, ORANGE CITY WAL-MART #563-01, ORANGE CITY WAL-MART SUPERCENT, WAL-MART STORES EAST, INC.
AF MOTORS LLC (2655 N VOLUSIA AVE in ORANGE CITY, FL)
STATE MASTER (FDM) - CHAZ-FLD984181768, HAZARDOUS WASTE REGULATION PROGRAM Small Quantity Generators, between 100 kg and 1000 kg of hazardous waste/month (Resource Conservation and Recovery Act (tracking hazardous waste)) Business SIC classification: MOTOR VEHICLE DEALERS (NEW AND USED)Organizations: ASBURY AUTOMOTIVE JAX LP (CONTACT/OWNER)
Alternative names: DELAND FORD LINCOLN MERCURY
ORANGE CITY ELEMENTARY SCHOOL (555 E UNIVERSITY AVE in ORANGE CITY, FL)
(Geographic Names Information System) (National Center for Education Statistics) - STATE ID-4131 Organizations: VOLUSIA COUNTY SCHOOL DISTRICT (SCHOOL DISTRICT)
7-11/ORANGE CITY (IW) (2590 S. VOLUSIA AVE. @ SAXON in ORANGE CITY, FL)
National Pollutant Discharge Elimination System NON-MAJOR (Tracking pollutant discharge elimination systems) - permit Business SIC classification: GAS AND OTHER SERVICES COMBINEDOrganizations: WILLO SMITH (CONTACT/OWNER)
ORANGE CITY TOWN CENTER (ENTERPRISE RD, OPPOSITE COMMED in ORANGE CITY, FL)
National Pollutant Discharge Elimination System NON-MAJOR (Tracking pollutant discharge elimination systems) - permit Organizations: JOHN WANAMAKER (CONTACT/OWNER)
AMSOUTH BANK - ORANGE CITY / E (2626 ENTERPRISE RD. in ORANGE CITY, FL)
National Pollutant Discharge Elimination System NON-MAJOR (Tracking pollutant discharge elimination systems) - permit Organizations: GREGORY HARRIS (CONTACT/OWNER)
BLUE SPRINGS VILLAS (E. LEAVITT AVENUE & BLUE SPRIN in ORANGE CITY, FL)
National Pollutant Discharge Elimination System NON-MAJOR (Tracking pollutant discharge elimination systems) - permit Organizations: TIM LOUGHRAN (CONTACT/OWNER)
MARINER 28 BUILDING (2828 ENTERPRISE ROAD in ORANGE CITY, FL)
National Pollutant Discharge Elimination System NON-MAJOR (Tracking pollutant discharge elimination systems) - permit Organizations: PATRICK CASEY (CONTACT/OWNER)
MARINER 9 BUILDING (2715 REBECCA LANE in ORANGE CITY, FL)
National Pollutant Discharge Elimination System NON-MAJOR (Tracking pollutant discharge elimination systems) - permit Organizations: PATRICK CASEY (CONTACT/OWNER)
AMERICAN AUTO BODY OF ORANGE CITY (204 SOUTH INDUSTRIAL DRIVE in ORANGE CITY, FL)
(Resource Conservation and Recovery Act (tracking hazardous waste)) Organizations: E MACON HICKMAN PRES OWNER (CONTACT/OWNER)
GRANDEVILLE ON SAXON (741 SAXON BLVD in ORANGE CITY, FL)
National Pollutant Discharge Elimination System NON-MAJOR (Tracking pollutant discharge elimination systems) - permit Organizations: WALT MCCULLY (CONTACT/OWNER)
HOME DEPOT #6323 (2300 VETERANS MEMORIAL PKWY in ORANGE CITY, FL)
(Resource Conservation and Recovery Act (tracking hazardous waste)) Organizations: HOME DEPOT USA (CONTACT/OWNER)
HOSPICE OF VOLUSIA - FLAGER - (1625 VETERANS MEMORIAL PKWY in ORANGE CITY, FL)
National Pollutant Discharge Elimination System NON-MAJOR (Tracking pollutant discharge elimination systems) - permit Organizations: RICHARD TRACEY (CONTACT/OWNER)
Housing units lacking complete kitchen facilities: 2.1%
95.9% Electricity 1.2% Bottled, tank, or LP gas 0.9% No fuel used 0.9% Utility gas 0.6% Solar energy
Population in 1990: 12,946. Population change in the 1990s: +2,227 (+17.2%).
Place of birth for U.S.-born residents:
This state: 8,658Northeast: 7,149Midwest: 3,382South: 2,025West: 945
54% of the 32763 zip code residents lived in the same house 5 years ago.
Out of people who lived in different houses, 54% lived in this county.
Out of people who lived in different counties, 50% lived in Florida.
84% of the 32763 zip code residents lived in the same house 1 year ago.
Out of people who lived in different houses, 55% moved from this county.
Out of people who lived in different houses, 24% moved from different county within same state.
Out of people who lived in different houses, 11% moved from different state.
Out of people who lived in different houses, 3% moved from abroad.
Private vs. public school enrollment:
Students in private schools in grades 1 to 8 (elementary and middle school): 333
Students in private schools in grades 9 to 12 (high school): 8
Students in private undergraduate colleges: 265
Occupation by median earnings in the past 12 months ($)
89,373 Life, physical, and social science occupations 87,709 Architecture and engineering occupations 84,971 Management occupations 84,467 Computer and mathematical occupations 83,652 Legal occupations 56,881 Business and financial operations occupations
Companies with federal contracts located in this zip code:
CHINCHOR ELECTRIC, INC (935 SHADICK DRIVE in ORANGE CITY, FL; small business) in 3 contracts from 2000 to 2002
$235,440 with Air Force for Maintenance, Repair or Alteration of Real Property -- Other Airfield Structures. Signed on 2000-11-21. Completion date: 2001-12-30.
, same as above. Signed on 2001-12-18. Completion date: 2002-03-04.
, same as above. Signed on 2002-02-14. Completion date: 2002-06-03.
Top industries in this zip code by the number of employees in 2005:
Health Care and Social Assistance: Continuing Care Retirement Communities (500-999 employees: 1 establishment, 20-49 employees: 1 establishment)Accommodation and Food Services: Full-Service Restaurants (100-249: 2, 50-99: 2, 20-49: 6, 10-19: 4, 1-4: 8)Health Care and Social Assistance: General Medical and Surgical Hospitals (500-999: 1)Accommodation and Food Services: Limited-Service Restaurants (50-99: 2, 20-49: 8, 10-19: 1, 5-9: 4, 1-4: 3)Administrative and Support and Waste Management and Remediation Services: Solid Waste Collection (250-499: 1, 1-4: 1)Health Care and Social Assistance: Offices of Physicians (except Mental Health Specialists) (50-99: 1, 20-49: 3, 10-19: 5, 5-9: 13, 1-4: 10)Construction: Roofing Contractors (100-249: 1, 20-49: 2)
People in group quarters in 2010:
251 people in nursing facilities/skilled-nursing facilities
6 people in group homes intended for adults
People in group quarters in 2000:
165 people in nursing homes
Fatal accident statistics in 2014:
Fatal accident count: 5Vehicles involved in fatal accidents: 7Fatal accidents caused by drunken drivers: 0Fatalities: 5Persons involved in fatal accidents: 12Pedestrians involved in fatal accidents: 3
Fatal accident statistics in 2013:
Fatal accident count: 3Vehicles involved in fatal accidents: 4Fatal accidents caused by drunken drivers: 0Fatalities: 3Persons involved in fatal accidents: 5Pedestrians involved in fatal accidents: 2
Home Mortgage Disclosure Act Aggregated Statistics For Year 2009(Based on 2 full and 2 partial tracts) A) FHA, FSA/RHS & VA B) Conventional C) Refinancings D) Home Improvement Loans E) Loans on Dwellings For 5+ Families F) Non-occupant Loans on G) Loans On Manufactured Number Average Value Number Average Value Number Average Value Number Average Value Number Average Value Number Average Value Number Average Value
LOANS ORIGINATED 112 $134,649 55 $105,113 154 $126,993 8 $34,136 2 $3,380,280 28 $85,735 9 $46,827 APPLICATIONS APPROVED, NOT ACCEPTED 11 $147,530 7 $107,617 19 $121,469 2 $10,935 0 $0 1 $61,120 7 $31,643 APPLICATIONS DENIED 27 $123,927 15 $148,145 137 $138,213 10 $29,748 0 $0 6 $68,977 8 $36,790 APPLICATIONS WITHDRAWN 11 $181,815 10 $80,256 67 $146,551 0 $0 0 $0 6 $122,453 1 $29,450 FILES CLOSED FOR INCOMPLETENESS 5 $123,406 0 $0 20 $180,962 2 $97,230 0 $0 1 $95,560 0 $0
Aggregated Statistics For Year 2008(Based on 2 full and 2 partial tracts) A) FHA, FSA/RHS & VA B) Conventional C) Refinancings D) Home Improvement Loans E) Loans on Dwellings For 5+ Families F) Non-occupant Loans on G) Loans On Manufactured Number Average Value Number Average Value Number Average Value Number Average Value Number Average Value Number Average Value Number Average Value
LOANS ORIGINATED 92 $141,616 89 $129,300 219 $132,078 18 $46,647 1 $325,030 32 $113,894 17 $40,341 APPLICATIONS APPROVED, NOT ACCEPTED 4 $123,692 8 $160,918 43 $142,240 10 $31,301 0 $0 3 $150,197 6 $36,742 APPLICATIONS DENIED 31 $132,692 33 $112,458 194 $147,419 42 $48,861 2 $233,635 14 $100,034 14 $32,648 APPLICATIONS WITHDRAWN 12 $111,847 4 $117,925 75 $153,674 5 $159,076 0 $0 8 $115,274 0 $0 FILES CLOSED FOR INCOMPLETENESS 1 $45,560 6 $156,350 25 $147,998 1 $64,450 0 $0 6 $211,620 0 $0
Aggregated Statistics For Year 2007(Based on 2 full and 2 partial tracts) A) FHA, FSA/RHS & VA B) Conventional C) Refinancings D) Home Improvement Loans E) Loans on Dwellings For 5+ Families F) Non-occupant Loans on G) Loans On Manufactured Number Average Value Number Average Value Number Average Value Number Average Value Number Average Value Number Average Value Number Average Value
LOANS ORIGINATED 38 $146,357 365 $151,468 426 $145,698 75 $67,877 2 $8,335,375 77 $141,314 45 $42,592 APPLICATIONS APPROVED, NOT ACCEPTED 0 $0 56 $137,122 100 $127,577 19 $67,355 0 $0 8 $206,398 12 $44,408 APPLICATIONS DENIED 6 $139,178 95 $129,242 365 $154,670 72 $125,356 0 $0 29 $147,182 28 $40,124 APPLICATIONS WITHDRAWN 5 $148,130 33 $178,158 171 $167,754 21 $109,380 0 $0 9 $158,943 0 $0 FILES CLOSED FOR INCOMPLETENESS 0 $0 27 $157,496 48 $164,261 0 $0 0 $0 5 $137,652 0 $0
Aggregated Statistics For Year 2006(Based on 2 full and 2 partial tracts) A) FHA, FSA/RHS & VA B) Conventional C) Refinancings D) Home Improvement Loans E) Loans on Dwellings For 5+ Families F) Non-occupant Loans on G) Loans On Manufactured Number Average Value Number Average Value Number Average Value Number Average Value Number Average Value Number Average Value Number Average Value
LOANS ORIGINATED 22 $177,807 762 $132,824 667 $141,529 129 $81,030 0 $0 220 $128,211 44 $42,324 APPLICATIONS APPROVED, NOT ACCEPTED 1 $106,120 124 $125,491 113 $135,464 19 $45,896 0 $0 27 $113,355 22 $45,656 APPLICATIONS DENIED 4 $189,310 230 $128,860 308 $152,915 78 $56,596 0 $0 67 $130,805 32 $62,785 APPLICATIONS WITHDRAWN 4 $144,262 128 $189,791 269 $144,568 14 $100,344 1 $594,490 19 $101,852 3 $105,933 FILES CLOSED FOR INCOMPLETENESS 2 $258,490 26 $164,532 55 $151,422 3 $129,827 0 $0 6 $201,757 0 $0
Aggregated Statistics For Year 2005(Based on 2 full and 2 partial tracts) A) FHA, FSA/RHS & VA B) Conventional C) Refinancings D) Home Improvement Loans E) Loans on Dwellings For 5+ Families F) Non-occupant Loans on G) Loans On Manufactured Number Average Value Number Average Value Number Average Value Number Average Value Number Average Value Number Average Value Number Average Value
LOANS ORIGINATED 64 $131,299 782 $120,247 644 $114,134 84 $62,766 2 $234,630 261 $117,406 61 $42,492 APPLICATIONS APPROVED, NOT ACCEPTED 9 $138,900 99 $117,007 112 $122,462 18 $32,616 0 $0 18 $140,522 20 $49,834 APPLICATIONS DENIED 8 $141,639 180 $112,710 297 $114,806 64 $57,006 0 $0 66 $105,172 27 $68,702 APPLICATIONS WITHDRAWN 10 $188,673 107 $148,276 265 $112,953 26 $99,347 0 $0 11 $113,687 5 $73,390 FILES CLOSED FOR INCOMPLETENESS 0 $0 31 $133,052 96 $113,758 5 $101,002 0 $0 8 $172,309 3 $108,300
Aggregated Statistics For Year 2004(Based on 2 full and 2 partial tracts) A) FHA, FSA/RHS & VA B) Conventional C) Refinancings D) Home Improvement Loans E) Loans on Dwellings For 5+ Families F) Non-occupant Loans on G) Loans On Manufactured Number Average Value Number Average Value Number Average Value Number Average Value Number Average Value Number Average Value Number Average Value
LOANS ORIGINATED 52 $101,177 447 $93,918 390 $96,605 71 $45,003 2 $1,789,560 88 $78,174 18 $33,067 APPLICATIONS APPROVED, NOT ACCEPTED 6 $91,293 66 $93,872 114 $93,994 15 $72,121 0 $0 9 $75,129 13 $42,463 APPLICATIONS DENIED 10 $103,711 95 $81,907 318 $98,136 48 $45,041 0 $0 21 $71,510 27 $50,015 APPLICATIONS WITHDRAWN 4 $117,105 59 $89,062 233 $101,983 17 $54,178 0 $0 20 $84,458 2 $75,285 FILES CLOSED FOR INCOMPLETENESS 3 $104,157 19 $98,783 46 $102,476 2 $41,670 0 $0 4 $103,025 1 $37,780
Aggregated Statistics For Year 2003(Based on 2 full and 2 partial tracts) A) FHA, FSA/RHS & VA B) Conventional C) Refinancings D) Home Improvement Loans E) Loans on Dwellings For 5+ Families F) Non-occupant Loans on Number Average Value Number Average Value Number Average Value Number Average Value Number Average Value Number Average Value
LOANS ORIGINATED 67 $101,613 369 $97,609 741 $85,801 39 $23,715 2 $451,365 97 $78,037 APPLICATIONS APPROVED, NOT ACCEPTED 6 $77,062 38 $74,167 107 $78,866 15 $29,727 0 $0 12 $54,170 APPLICATIONS DENIED 14 $105,616 75 $75,038 277 $77,289 26 $32,175 2 $1,086,660 21 $71,836 APPLICATIONS WITHDRAWN 6 $91,800 33 $99,182 215 $92,671 1 $8,330 0 $0 12 $98,428 FILES CLOSED FOR INCOMPLETENESS 5 $112,626 22 $128,416 32 $94,496 2 $60,285 0 $0 3 $71,650
Aggregated Statistics For Year 2002(Based on 2 full and 2 partial tracts) A) FHA, FSA/RHS & VA B) Conventional C) Refinancings D) Home Improvement Loans E) Loans on Dwellings For 5+ Families F) Non-occupant Loans on Number Average Value Number Average Value Number Average Value Number Average Value Number Average Value Number Average Value
LOANS ORIGINATED 73 $84,500 311 $83,109 503 $77,579 41 $32,332 2 $119,305 68 $66,168 APPLICATIONS APPROVED, NOT ACCEPTED 5 $72,894 38 $79,567 78 $66,568 4 $23,768 0 $0 4 $44,132 APPLICATIONS DENIED 6 $96,547 65 $71,194 213 $72,495 52 $24,552 0 $0 28 $65,927 APPLICATIONS WITHDRAWN 7 $61,279 21 $83,453 169 $74,983 4 $36,392 0 $0 4 $38,418 FILES CLOSED FOR INCOMPLETENESS 4 $84,940 4 $85,145 25 $74,731 0 $0 0 $0 0 $0
Aggregated Statistics For Year 2001(Based on 2 full and 2 partial tracts) A) FHA, FSA/RHS & VA B) Conventional C) Refinancings D) Home Improvement Loans E) Loans on Dwellings For 5+ Families F) Non-occupant Loans on Number Average Value Number Average Value Number Average Value Number Average Value Number Average Value Number Average Value
LOANS ORIGINATED 98 $81,782 313 $69,934 383 $72,903 43 $16,903 2 $3,579,120 66 $64,206 APPLICATIONS APPROVED, NOT ACCEPTED 7 $50,919 36 $55,232 61 $64,662 15 $15,724 0 $0 6 $65,028 APPLICATIONS DENIED 5 $63,618 68 $50,921 242 $62,076 46 $17,567 0 $0 15 $49,742 APPLICATIONS WITHDRAWN 5 $75,830 23 $89,101 180 $72,551 9 $19,056 0 $0 5 $72,602 FILES CLOSED FOR INCOMPLETENESS 1 $31,110 12 $67,452 25 $71,257 0 $0 0 $0 1 $25,000
Aggregated Statistics For Year 2000(Based on 2 full and 2 partial tracts) A) FHA, FSA/RHS & VA B) Conventional C) Refinancings D) Home Improvement Loans E) Loans on Dwellings For 5+ Families F) Non-occupant Loans on Number Average Value Number Average Value Number Average Value Number Average Value Number Average Value Number Average Value
LOANS ORIGINATED 78 $68,130 283 $71,300 144 $60,014 49 $23,381 0 $0 46 $67,023 APPLICATIONS APPROVED, NOT ACCEPTED 7 $83,297 40 $60,898 41 $54,428 17 $14,184 0 $0 6 $74,238 APPLICATIONS DENIED 7 $58,663 99 $51,404 173 $53,372 51 $18,632 2 $85,500 14 $60,344 APPLICATIONS WITHDRAWN 5 $75,760 27 $65,072 96 $49,217 6 $26,527 0 $0 4 $36,568 FILES CLOSED FOR INCOMPLETENESS 3 $53,747 7 $65,881 37 $66,758 0 $0 0 $0 1 $61,120
Aggregated Statistics For Year 1999(Based on 1 full and 1 partial tracts) A) FHA, FSA/RHS & VA B) Conventional C) Refinancings D) Home Improvement Loans F) Non-occupant Loans on Number Average Value Number Average Value Number Average Value Number Average Value Number Average Value
LOANS ORIGINATED 51 $74,607 141 $70,124 138 $58,737 29 $20,273 17 $59,155 APPLICATIONS APPROVED, NOT ACCEPTED 2 $57,775 19 $78,722 32 $54,375 7 $22,206 3 $55,193 APPLICATIONS DENIED 6 $71,858 41 $56,790 91 $55,030 25 $18,778 7 $69,006 APPLICATIONS WITHDRAWN 2 $69,100 12 $74,704 47 $59,104 5 $45,600 2 $37,145 FILES CLOSED FOR INCOMPLETENESS 3 $63,967 3 $77,233 14 $52,506 1 $14,810 0 $0
Detailed HMDA statistics for the following Tracts:
0908.01
,
0908.02
Private Mortgage Insurance Companies Aggregated Statistics For Year 2009(Based on 2 full and 2 partial tracts) A) Conventional B) Refinancings C) Non-occupant Loans on Number Average Value Number Average Value Number Average Value
LOANS ORIGINATED 3 $144,717 2 $291,300 0 $0 APPLICATIONS APPROVED, NOT ACCEPTED 6 $168,348 0 $0 0 $0 APPLICATIONS DENIED 1 $56,670 0 $0 1 $56,670 APPLICATIONS WITHDRAWN 0 $0 0 $0 0 $0 FILES CLOSED FOR INCOMPLETENESS 1 $120,010 0 $0 0 $0
Aggregated Statistics For Year 2008(Based on 2 full and 2 partial tracts) A) Conventional B) Refinancings C) Non-occupant Loans on Number Average Value Number Average Value Number Average Value
LOANS ORIGINATED 26 $184,531 15 $161,973 3 $129,640 APPLICATIONS APPROVED, NOT ACCEPTED 25 $195,490 11 $174,542 4 $281,288 APPLICATIONS DENIED 4 $235,152 5 $152,438 5 $229,014 APPLICATIONS WITHDRAWN 3 $304,277 0 $0 0 $0 FILES CLOSED FOR INCOMPLETENESS 1 $161,120 1 $167,790 1 $167,790
Aggregated Statistics For Year 2007(Based on 2 full and 2 partial tracts) A) Conventional B) Refinancings C) Non-occupant Loans on D) Loans On Manufactured Number Average Value Number Average Value Number Average Value Number Average Value
LOANS ORIGINATED 112 $184,922 42 $192,925 4 $144,318 1 $51,670 APPLICATIONS APPROVED, NOT ACCEPTED 31 $208,527 12 $226,253 1 $162,790 0 $0 APPLICATIONS DENIED 4 $178,955 1 $100,560 0 $0 0 $0 APPLICATIONS WITHDRAWN 4 $199,135 6 $254,572 0 $0 0 $0 FILES CLOSED FOR INCOMPLETENESS 3 $160,040 0 $0 0 $0 0 $0
Aggregated Statistics For Year 2006(Based on 2 full and 2 partial tracts) A) Conventional B) Refinancings C) Non-occupant Loans on D) Loans On Manufactured Number Average Value Number Average Value Number Average Value Number Average Value
LOANS ORIGINATED 131 $185,102 26 $187,728 15 $203,553 1 $113,900 APPLICATIONS APPROVED, NOT ACCEPTED 21 $174,729 15 $178,087 5 $148,200 0 $0 APPLICATIONS DENIED 1 $246,690 0 $0 1 $80,010 0 $0 APPLICATIONS WITHDRAWN 6 $165,810 1 $103,900 2 $159,070 1 $76,670 FILES CLOSED FOR INCOMPLETENESS 1 $54,450 0 $0 1 $54,450 0 $0
Aggregated Statistics For Year 2005(Based on 2 full and 2 partial tracts) A) Conventional B) Refinancings C) Non-occupant Loans on D) Loans On Manufactured Number Average Value Number Average Value Number Average Value Number Average Value
LOANS ORIGINATED 133 $161,512 30 $142,179 19 $168,688 2 $79,730 APPLICATIONS APPROVED, NOT ACCEPTED 30 $154,112 6 $116,028 8 $143,448 0 $0 APPLICATIONS DENIED 1 $220,570 1 $122,790 1 $126,680 0 $0 APPLICATIONS WITHDRAWN 10 $166,661 3 $71,963 3 $163,890 1 $76,670 FILES CLOSED FOR INCOMPLETENESS 2 $108,370 0 $0 0 $0 0 $0
Aggregated Statistics For Year 2004(Based on 2 full and 2 partial tracts) A) Conventional B) Refinancings C) Non-occupant Loans on Number Average Value Number Average Value Number Average Value
LOANS ORIGINATED 109 $113,870 21 $100,117 20 $89,494 APPLICATIONS APPROVED, NOT ACCEPTED 20 $121,237 21 $96,242 4 $70,040 APPLICATIONS DENIED 0 $0 1 $96,120 0 $0 APPLICATIONS WITHDRAWN 7 $113,374 1 $127,230 1 $32,780 FILES CLOSED FOR INCOMPLETENESS 2 $115,325 1 $83,340 0 $0
Aggregated Statistics For Year 2003(Based on 2 full and 2 partial tracts) A) Conventional B) Refinancings C) Non-occupant Loans on Number Average Value Number Average Value Number Average Value
LOANS ORIGINATED 106 $102,071 57 $109,849 14 $71,392 APPLICATIONS APPROVED, NOT ACCEPTED 16 $115,504 19 $105,765 6 $97,515 APPLICATIONS DENIED 1 $184,460 0 $0 0 $0 APPLICATIONS WITHDRAWN 6 $83,318 3 $80,747 1 $36,670 FILES CLOSED FOR INCOMPLETENESS 0 $0 3 $76,593 1 $38,890
Aggregated Statistics For Year 2002(Based on 2 full and 2 partial tracts) A) Conventional B) Refinancings C) Non-occupant Loans on Number Average Value Number Average Value Number Average Value
LOANS ORIGINATED 78 $108,942 43 $109,310 8 $103,320 APPLICATIONS APPROVED, NOT ACCEPTED 11 $147,688 10 $99,512 1 $32,780 APPLICATIONS DENIED 1 $112,790 1 $95,010 1 $28,890 APPLICATIONS WITHDRAWN 8 $118,359 7 $131,657 3 $141,510 FILES CLOSED FOR INCOMPLETENESS 0 $0 0 $0 0 $0
Aggregated Statistics For Year 2001(Based on 2 full and 2 partial tracts) A) Conventional B) Refinancings C) Non-occupant Loans on Number Average Value Number Average Value Number Average Value
LOANS ORIGINATED 84 $82,136 30 $82,157 12 $60,605 APPLICATIONS APPROVED, NOT ACCEPTED 10 $103,627 6 $98,578 1 $27,780 APPLICATIONS DENIED 1 $107,230 3 $87,307 0 $0 APPLICATIONS WITHDRAWN 0 $0 1 $71,120 0 $0 FILES CLOSED FOR INCOMPLETENESS 0 $0 0 $0 0 $0
Aggregated Statistics For Year 2000(Based on 2 full and 2 partial tracts) A) Conventional B) Refinancings C) Non-occupant Loans on Number Average Value Number Average Value Number Average Value
LOANS ORIGINATED 87 $103,336 12 $88,122 12 $118,244 APPLICATIONS APPROVED, NOT ACCEPTED 4 $109,628 2 $68,060 0 $0 APPLICATIONS DENIED 10 $87,894 1 $37,780 0 $0 APPLICATIONS WITHDRAWN 6 $54,350 1 $26,670 2 $28,830 FILES CLOSED FOR INCOMPLETENESS 0 $0 1 $27,780 0 $0
Aggregated Statistics For Year 1999(Based on 1 full and 1 partial tracts) A) Conventional B) Refinancings C) Non-occupant Loans on Number Average Value Number Average Value Number Average Value
LOANS ORIGINATED 40 $90,864 15 $90,580 5 $70,176 APPLICATIONS APPROVED, NOT ACCEPTED 6 $104,418 1 $94,480 1 $46,790 APPLICATIONS DENIED 1 $43,870 3 $84,683 0 $0 APPLICATIONS WITHDRAWN 0 $0 0 $0 0 $0 FILES CLOSED FOR INCOMPLETENESS 0 $0 0 $0 0 $0
Detailed PMIC statistics for the following Tracts:
0908.01
,
0908.02
2002 - 2018 National Fire Incident Reporting System (NFIRS) incidents See full 2006 National Fire Incident Reporting System statistics for zip code 32763, Florida
Most common first names in zip code 32763 among deceased individuals Name Count Lived (average)
William 214 76.5 years John 211 76.3 years Mary 146 80.3 years Robert 139 75.0 years James 138 73.5 years George 135 76.0 years Charles 128 76.1 years Joseph 109 74.4 years Helen 100 81.4 years Dorothy 94 80.9 years
Most common last names in zip code 32763 among deceased individuals Last name Count Lived (average)
Smith 65 77.4 years Johnson 51 79.3 years Miller 42 78.0 years Wilson 31 75.4 years Brown 30 76.6 years Williams 30 77.2 years Davis 29 79.1 years Anderson 26 76.9 years Martin 25 80.6 years Thomas 24 72.7 years
Businesses in zip code 32763
Name Count Name Count
7-Eleven 1 Kohl's 1 AMF Bowling 1 LA Fitness 1 AT&T 2 Lane Furniture 1 Ace Hardware 1 Long John Silver's 1 Advance Auto Parts 1 Lowe's 1 Applebee's 1 MasterBrand Cabinets 2 Arby's 1 McDonald's 1 AutoZone 1 Nike 2 Baskin-Robbins 1 Office Depot 1 Bed Bath & Beyond 1 Olive Garden 1 Blockbuster 1 Papa John's Pizza 1 Budget Car Rental 1 Payless 1 Burger King 1 Pizza Hut 1 CVS 1 Popeyes 1 Chick-Fil-A 1 Publix Super Markets 1 Curves 1 Quality 1 Days Inn 1 Quiznos 1 Dennys 1 RadioShack 1 Domino's Pizza 1 Ruby Tuesday 1 Dunkin Donuts 1 Rue21 1 Famous Footwear 1 SONIC Drive-In 1 FedEx 5 Sprint Nextel 1 Firestone Complete Auto Care 1 Staples 1 Ford 1 Starbucks 1 GNC 1 Steak 'n Shake 1 GameStop 1 T-Mobile 2 Goodwill 1 Taco Bell 1 H&R Block 1 Target 1 Hobby Lobby 1 Tire Kingdom 1 Holiday Inn 1 U-Haul 2 Home Depot 1 UPS 4 Honda 1 Verizon Wireless 2 Justice 1 Walgreens 1 KFC 1 Walmart 1 Kmart 1
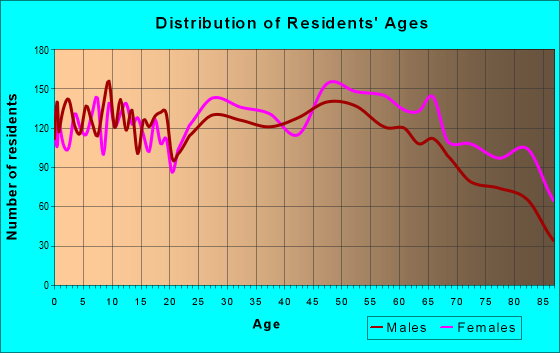
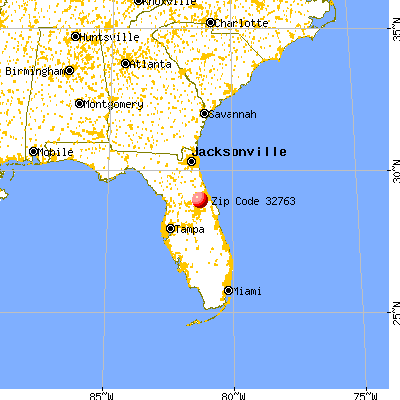


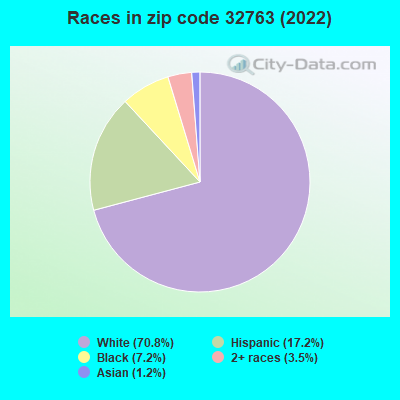


+$357
-$6,005
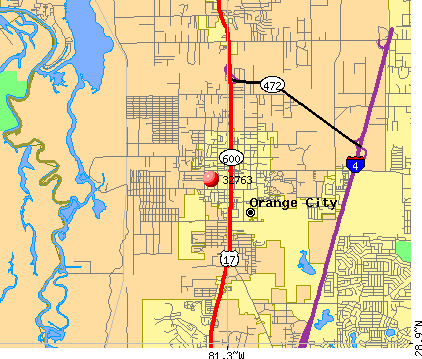 Nearest zip codes: 32713, 32725, 32744, 32720, 32738, 32771.
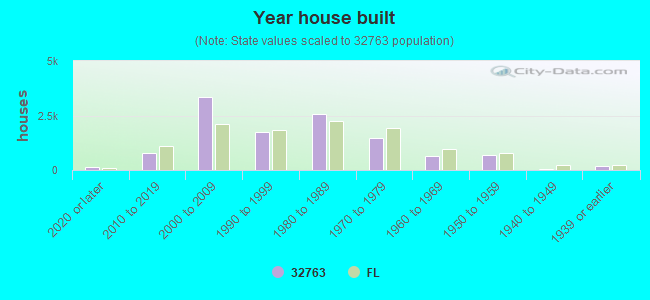
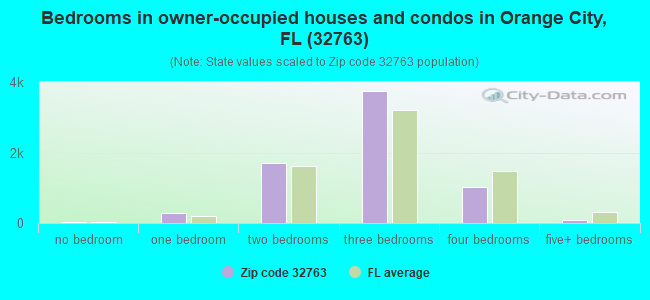
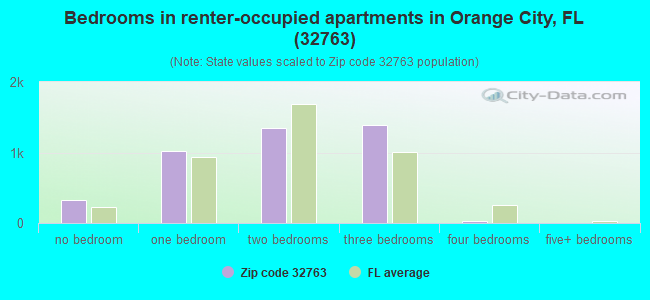
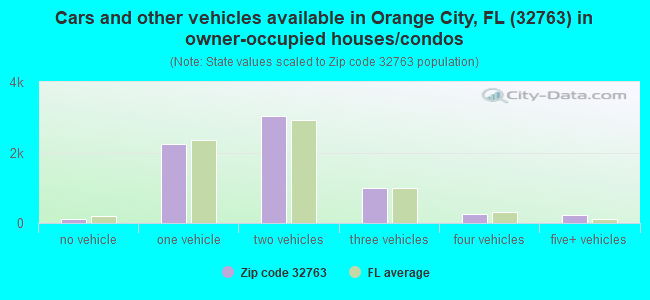
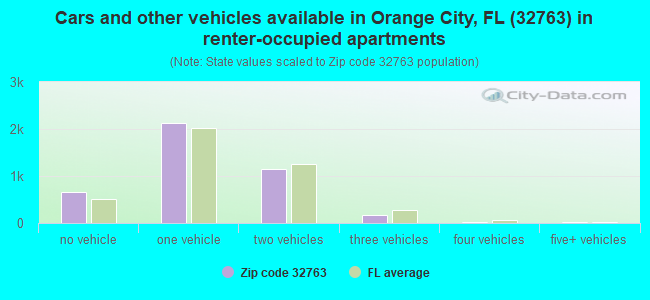


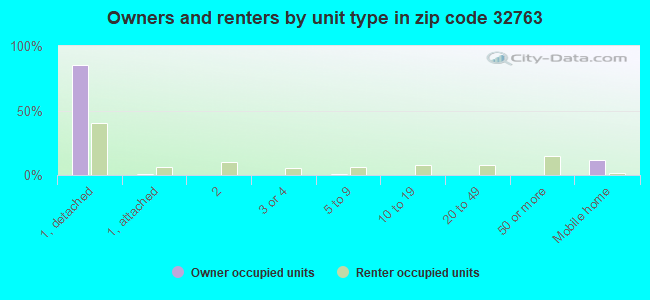
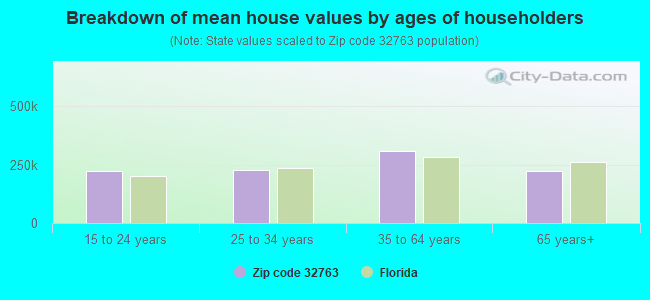


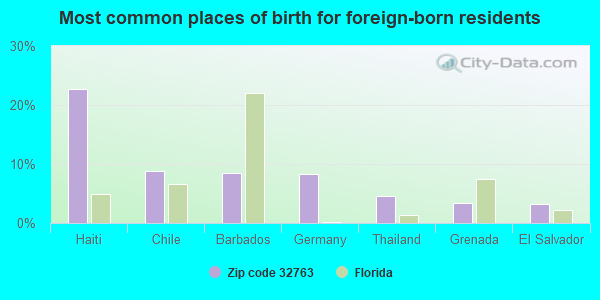
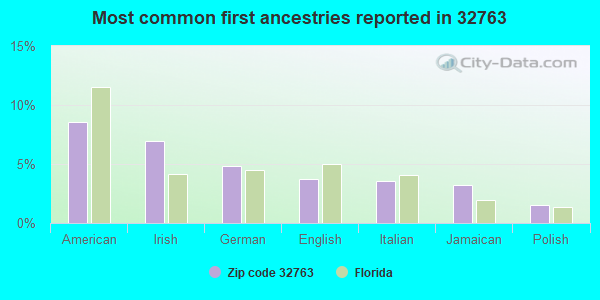
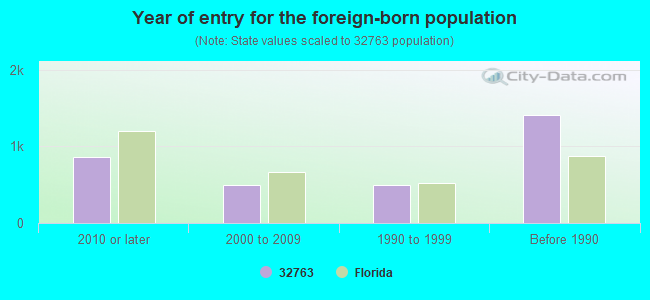
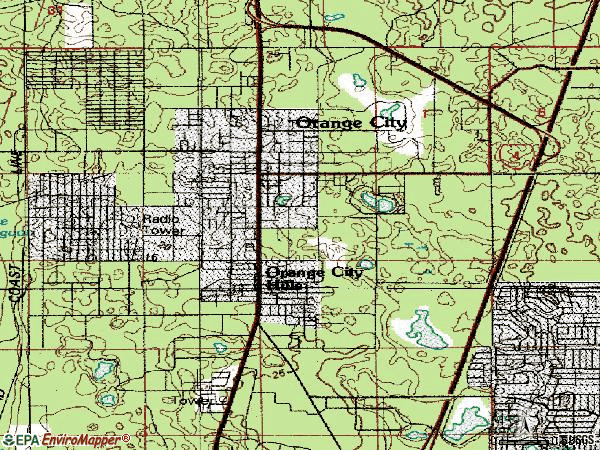

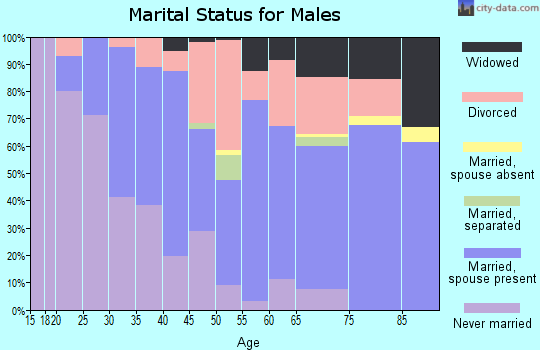
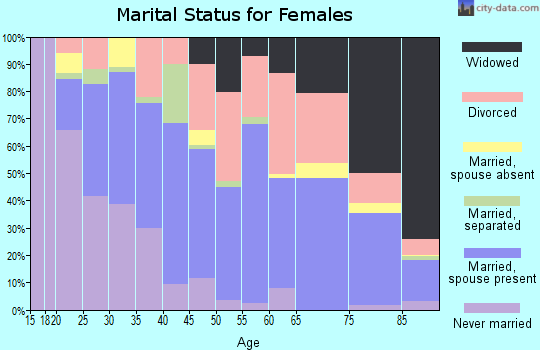
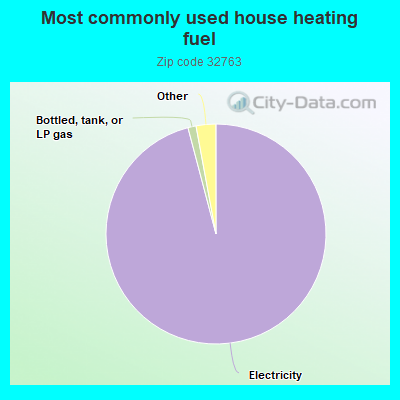
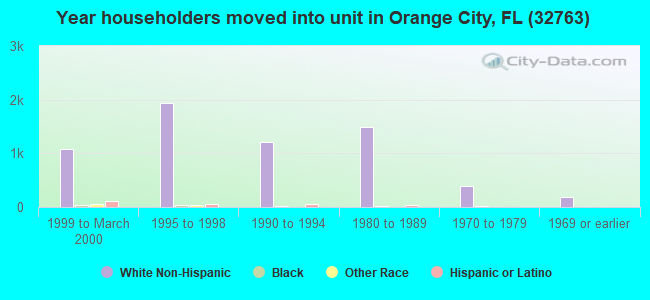
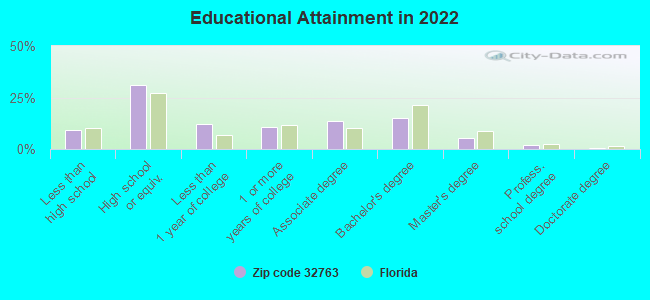
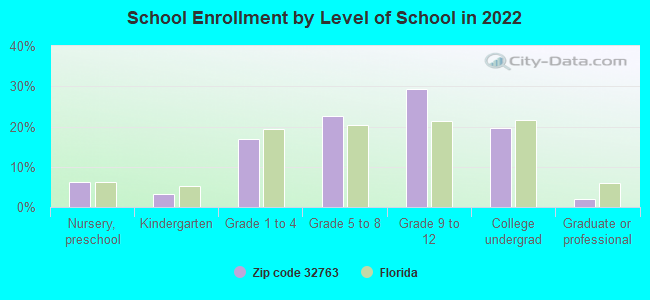
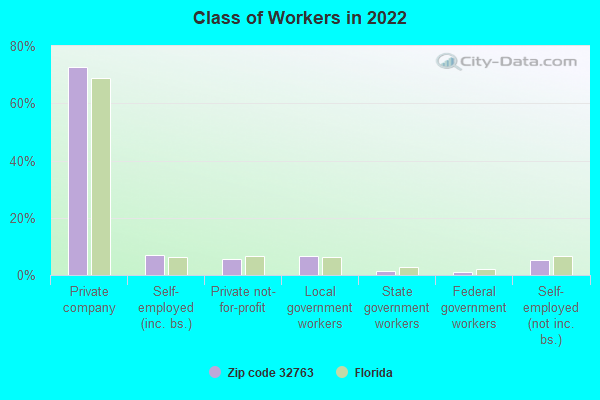
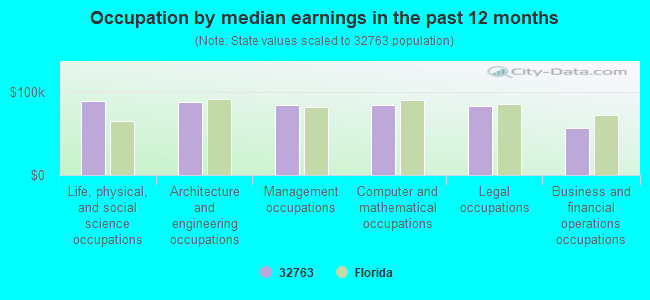
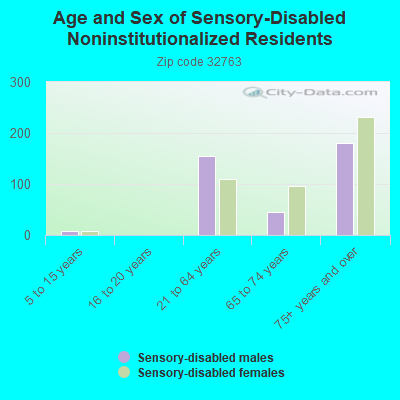
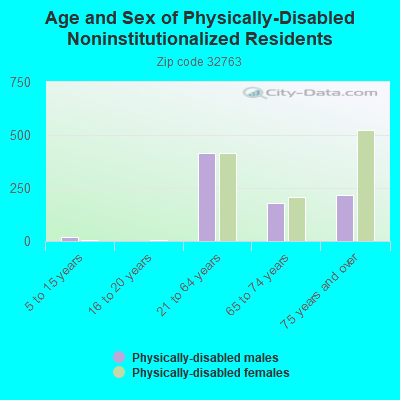
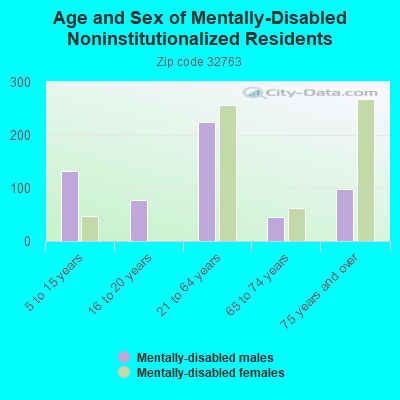
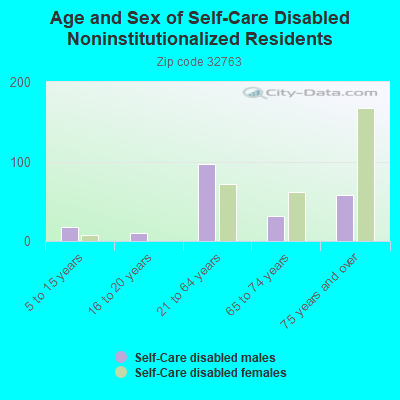
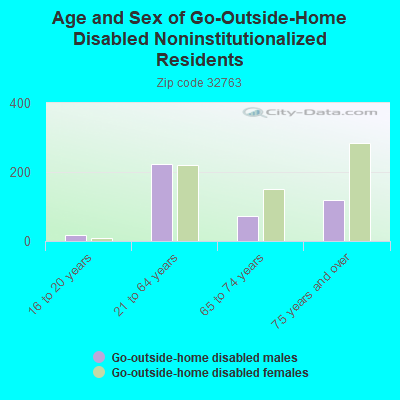

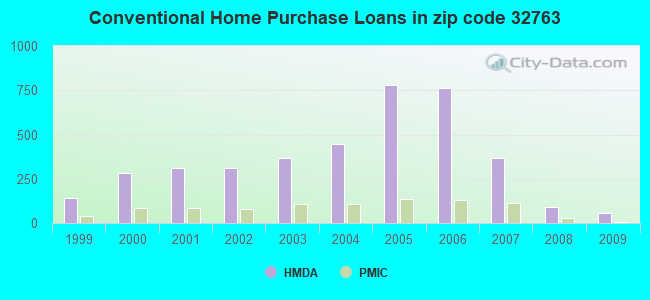
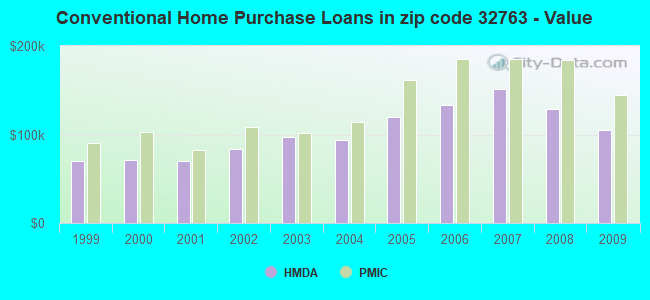
 Based on the data from the years 2002 - 2018 the average number of fire incidents per year is 133. The highest number of fires - 184 took place in 2006, and the least - 70 in 2005. The data has a declining trend.
 When looking into fire subcategories, the most reports belonged to: Outside Fires (51.2%), and Structure Fires (24.9%).