East Ridge, Tennessee Submit your own pictures of this city and show them to the world
OSM Map
General Map
Google Map
MSN Map
OSM Map
General Map
Google Map
MSN Map
OSM Map
General Map
Google Map
MSN Map
OSM Map
General Map
Google Map
MSN Map
Please wait while loading the map...
Population in 2022: 21,936 (100% urban, 0% rural). Population change since 2000: +6.3%Males: 10,667 Females: 11,269
March 2022 cost of living index in East Ridge: 88.6 (less than average, U.S. average is 100) Percentage of residents living in poverty in 2022: 15.8%for White Non-Hispanic residents , 19.9% for Black residents , 48.2% for Hispanic or Latino residents , 59.2% for other race residents , 33.7% for two or more races residents )
Profiles of local businesses
Business Search - 14 Million verified businesses
Data:
Median household income ($)
Median household income (% change since 2000)
Household income diversity
Ratio of average income to average house value (%)
Ratio of average income to average rent
Median household income ($) - White
Median household income ($) - Black or African American
Median household income ($) - Asian
Median household income ($) - Hispanic or Latino
Median household income ($) - American Indian and Alaska Native
Median household income ($) - Multirace
Median household income ($) - Other Race
Median household income for houses/condos with a mortgage ($)
Median household income for apartments without a mortgage ($)
Races - White alone (%)
Races - White alone (% change since 2000)
Races - Black alone (%)
Races - Black alone (% change since 2000)
Races - American Indian alone (%)
Races - American Indian alone (% change since 2000)
Races - Asian alone (%)
Races - Asian alone (% change since 2000)
Races - Hispanic (%)
Races - Hispanic (% change since 2000)
Races - Native Hawaiian and Other Pacific Islander alone (%)
Races - Native Hawaiian and Other Pacific Islander alone (% change since 2000)
Races - Two or more races (%)
Races - Two or more races (% change since 2000)
Races - Other race alone (%)
Races - Other race alone (% change since 2000)
Racial diversity
Unemployment (%)
Unemployment (% change since 2000)
Unemployment (%) - White
Unemployment (%) - Black or African American
Unemployment (%) - Asian
Unemployment (%) - Hispanic or Latino
Unemployment (%) - American Indian and Alaska Native
Unemployment (%) - Multirace
Unemployment (%) - Other Race
Population density (people per square mile)
Population - Males (%)
Population - Females (%)
Population - Males (%) - White
Population - Males (%) - Black or African American
Population - Males (%) - Asian
Population - Males (%) - Hispanic or Latino
Population - Males (%) - American Indian and Alaska Native
Population - Males (%) - Multirace
Population - Males (%) - Other Race
Population - Females (%) - White
Population - Females (%) - Black or African American
Population - Females (%) - Asian
Population - Females (%) - Hispanic or Latino
Population - Females (%) - American Indian and Alaska Native
Population - Females (%) - Multirace
Population - Females (%) - Other Race
Coronavirus confirmed cases (May 14, 2024)
Deaths caused by coronavirus (May 14, 2024)
Coronavirus confirmed cases (per 100k population) (May 14, 2024)
Deaths caused by coronavirus (per 100k population) (May 14, 2024)
Daily increase in number of cases (May 14, 2024)
Weekly increase in number of cases (May 14, 2024)
Cases doubled (in days) (May 14, 2024)
Hospitalized patients (Apr 18, 2022)
Negative test results (Apr 18, 2022)
Total test results (Apr 18, 2022)
COVID Vaccine doses distributed (per 100k population) (Sep 19, 2023)
COVID Vaccine doses administered (per 100k population) (Sep 19, 2023)
COVID Vaccine doses distributed (Sep 19, 2023)
COVID Vaccine doses administered (Sep 19, 2023)
Likely homosexual households (%)
Likely homosexual households (% change since 2000)
Likely homosexual households - Lesbian couples (%)
Likely homosexual households - Lesbian couples (% change since 2000)
Likely homosexual households - Gay men (%)
Likely homosexual households - Gay men (% change since 2000)
Cost of living index
Median gross rent ($)
Median contract rent ($)
Median monthly housing costs ($)
Median house or condo value ($)
Median house or condo value ($ change since 2000)
Mean house or condo value by units in structure - 1, detached ($)
Mean house or condo value by units in structure - 1, attached ($)
Mean house or condo value by units in structure - 2 ($)
Mean house or condo value by units in structure by units in structure - 3 or 4 ($)
Mean house or condo value by units in structure - 5 or more ($)
Mean house or condo value by units in structure - Boat, RV, van, etc. ($)
Mean house or condo value by units in structure - Mobile home ($)
Median house or condo value ($) - White
Median house or condo value ($) - Black or African American
Median house or condo value ($) - Asian
Median house or condo value ($) - Hispanic or Latino
Median house or condo value ($) - American Indian and Alaska Native
Median house or condo value ($) - Multirace
Median house or condo value ($) - Other Race
Median resident age
Resident age diversity
Median resident age - Males
Median resident age - Females
Median resident age - White
Median resident age - Black or African American
Median resident age - Asian
Median resident age - Hispanic or Latino
Median resident age - American Indian and Alaska Native
Median resident age - Multirace
Median resident age - Other Race
Median resident age - Males - White
Median resident age - Males - Black or African American
Median resident age - Males - Asian
Median resident age - Males - Hispanic or Latino
Median resident age - Males - American Indian and Alaska Native
Median resident age - Males - Multirace
Median resident age - Males - Other Race
Median resident age - Females - White
Median resident age - Females - Black or African American
Median resident age - Females - Asian
Median resident age - Females - Hispanic or Latino
Median resident age - Females - American Indian and Alaska Native
Median resident age - Females - Multirace
Median resident age - Females - Other Race
Commute - mean travel time to work (minutes)
Travel time to work - Less than 5 minutes (%)
Travel time to work - Less than 5 minutes (% change since 2000)
Travel time to work - 5 to 9 minutes (%)
Travel time to work - 5 to 9 minutes (% change since 2000)
Travel time to work - 10 to 19 minutes (%)
Travel time to work - 10 to 19 minutes (% change since 2000)
Travel time to work - 20 to 29 minutes (%)
Travel time to work - 20 to 29 minutes (% change since 2000)
Travel time to work - 30 to 39 minutes (%)
Travel time to work - 30 to 39 minutes (% change since 2000)
Travel time to work - 40 to 59 minutes (%)
Travel time to work - 40 to 59 minutes (% change since 2000)
Travel time to work - 60 to 89 minutes (%)
Travel time to work - 60 to 89 minutes (% change since 2000)
Travel time to work - 90 or more minutes (%)
Travel time to work - 90 or more minutes (% change since 2000)
Marital status - Never married (%)
Marital status - Now married (%)
Marital status - Separated (%)
Marital status - Widowed (%)
Marital status - Divorced (%)
Median family income ($)
Median family income (% change since 2000)
Median non-family income ($)
Median non-family income (% change since 2000)
Median per capita income ($)
Median per capita income (% change since 2000)
Median family income ($) - White
Median family income ($) - Black or African American
Median family income ($) - Asian
Median family income ($) - Hispanic or Latino
Median family income ($) - American Indian and Alaska Native
Median family income ($) - Multirace
Median family income ($) - Other Race
Median year house/condo built
Median year apartment built
Year house built - Built 2005 or later (%)
Year house built - Built 2000 to 2004 (%)
Year house built - Built 1990 to 1999 (%)
Year house built - Built 1980 to 1989 (%)
Year house built - Built 1970 to 1979 (%)
Year house built - Built 1960 to 1969 (%)
Year house built - Built 1950 to 1959 (%)
Year house built - Built 1940 to 1949 (%)
Year house built - Built 1939 or earlier (%)
Average household size
Household density (households per square mile)
Average household size - White
Average household size - Black or African American
Average household size - Asian
Average household size - Hispanic or Latino
Average household size - American Indian and Alaska Native
Average household size - Multirace
Average household size - Other Race
Occupied housing units (%)
Vacant housing units (%)
Owner occupied housing units (%)
Renter occupied housing units (%)
Vacancy status - For rent (%)
Vacancy status - For sale only (%)
Vacancy status - Rented or sold, not occupied (%)
Vacancy status - For seasonal, recreational, or occasional use (%)
Vacancy status - For migrant workers (%)
Vacancy status - Other vacant (%)
Residents with income below the poverty level (%)
Residents with income below 50% of the poverty level (%)
Children below poverty level (%)
Poor families by family type - Married-couple family (%)
Poor families by family type - Male, no wife present (%)
Poor families by family type - Female, no husband present (%)
Poverty status for native-born residents (%)
Poverty status for foreign-born residents (%)
Poverty among high school graduates not in families (%)
Poverty among people who did not graduate high school not in families (%)
Residents with income below the poverty level (%) - White
Residents with income below the poverty level (%) - Black or African American
Residents with income below the poverty level (%) - Asian
Residents with income below the poverty level (%) - Hispanic or Latino
Residents with income below the poverty level (%) - American Indian and Alaska Native
Residents with income below the poverty level (%) - Multirace
Residents with income below the poverty level (%) - Other Race
Air pollution - Air Quality Index (AQI)
Air pollution - CO
Air pollution - NO2
Air pollution - SO2
Air pollution - Ozone
Air pollution - PM10
Air pollution - PM25
Air pollution - Pb
Crime - Murders per 100,000 population
Crime - Rapes per 100,000 population
Crime - Robberies per 100,000 population
Crime - Assaults per 100,000 population
Crime - Burglaries per 100,000 population
Crime - Thefts per 100,000 population
Crime - Auto thefts per 100,000 population
Crime - Arson per 100,000 population
Crime - City-data.com crime index
Crime - Violent crime index
Crime - Property crime index
Crime - Murders per 100,000 population (5 year average)
Crime - Rapes per 100,000 population (5 year average)
Crime - Robberies per 100,000 population (5 year average)
Crime - Assaults per 100,000 population (5 year average)
Crime - Burglaries per 100,000 population (5 year average)
Crime - Thefts per 100,000 population (5 year average)
Crime - Auto thefts per 100,000 population (5 year average)
Crime - Arson per 100,000 population (5 year average)
Crime - City-data.com crime index (5 year average)
Crime - Violent crime index (5 year average)
Crime - Property crime index (5 year average)
1996 Presidential Elections Results (%) - Democratic Party (Clinton)
1996 Presidential Elections Results (%) - Republican Party (Dole)
1996 Presidential Elections Results (%) - Other
2000 Presidential Elections Results (%) - Democratic Party (Gore)
2000 Presidential Elections Results (%) - Republican Party (Bush)
2000 Presidential Elections Results (%) - Other
2004 Presidential Elections Results (%) - Democratic Party (Kerry)
2004 Presidential Elections Results (%) - Republican Party (Bush)
2004 Presidential Elections Results (%) - Other
2008 Presidential Elections Results (%) - Democratic Party (Obama)
2008 Presidential Elections Results (%) - Republican Party (McCain)
2008 Presidential Elections Results (%) - Other
2012 Presidential Elections Results (%) - Democratic Party (Obama)
2012 Presidential Elections Results (%) - Republican Party (Romney)
2012 Presidential Elections Results (%) - Other
2016 Presidential Elections Results (%) - Democratic Party (Clinton)
2016 Presidential Elections Results (%) - Republican Party (Trump)
2016 Presidential Elections Results (%) - Other
2020 Presidential Elections Results (%) - Democratic Party (Biden)
2020 Presidential Elections Results (%) - Republican Party (Trump)
2020 Presidential Elections Results (%) - Other
Ancestries Reported - Arab (%)
Ancestries Reported - Czech (%)
Ancestries Reported - Danish (%)
Ancestries Reported - Dutch (%)
Ancestries Reported - English (%)
Ancestries Reported - French (%)
Ancestries Reported - French Canadian (%)
Ancestries Reported - German (%)
Ancestries Reported - Greek (%)
Ancestries Reported - Hungarian (%)
Ancestries Reported - Irish (%)
Ancestries Reported - Italian (%)
Ancestries Reported - Lithuanian (%)
Ancestries Reported - Norwegian (%)
Ancestries Reported - Polish (%)
Ancestries Reported - Portuguese (%)
Ancestries Reported - Russian (%)
Ancestries Reported - Scotch-Irish (%)
Ancestries Reported - Scottish (%)
Ancestries Reported - Slovak (%)
Ancestries Reported - Subsaharan African (%)
Ancestries Reported - Swedish (%)
Ancestries Reported - Swiss (%)
Ancestries Reported - Ukrainian (%)
Ancestries Reported - United States (%)
Ancestries Reported - Welsh (%)
Ancestries Reported - West Indian (%)
Ancestries Reported - Other (%)
Educational Attainment - No schooling completed (%)
Educational Attainment - Less than high school (%)
Educational Attainment - High school or equivalent (%)
Educational Attainment - Less than 1 year of college (%)
Educational Attainment - 1 or more years of college (%)
Educational Attainment - Associate degree (%)
Educational Attainment - Bachelor's degree (%)
Educational Attainment - Master's degree (%)
Educational Attainment - Professional school degree (%)
Educational Attainment - Doctorate degree (%)
School Enrollment - Nursery, preschool (%)
School Enrollment - Kindergarten (%)
School Enrollment - Grade 1 to 4 (%)
School Enrollment - Grade 5 to 8 (%)
School Enrollment - Grade 9 to 12 (%)
School Enrollment - College undergrad (%)
School Enrollment - Graduate or professional (%)
School Enrollment - Not enrolled in school (%)
School enrollment - Public schools (%)
School enrollment - Private schools (%)
School enrollment - Not enrolled (%)
Median number of rooms in houses and condos
Median number of rooms in apartments
Housing units lacking complete plumbing facilities (%)
Housing units lacking complete kitchen facilities (%)
Density of houses
Urban houses (%)
Rural houses (%)
Households with people 60 years and over (%)
Households with people 65 years and over (%)
Households with people 75 years and over (%)
Households with one or more nonrelatives (%)
Households with no nonrelatives (%)
Population in households (%)
Family households (%)
Nonfamily households (%)
Population in families (%)
Family households with own children (%)
Median number of bedrooms in owner occupied houses
Mean number of bedrooms in owner occupied houses
Median number of bedrooms in renter occupied houses
Mean number of bedrooms in renter occupied houses
Median number of vehichles in owner occupied houses
Mean number of vehichles in owner occupied houses
Median number of vehichles in renter occupied houses
Mean number of vehichles in renter occupied houses
Mortgage status - with mortgage (%)
Mortgage status - with second mortgage (%)
Mortgage status - with home equity loan (%)
Mortgage status - with both second mortgage and home equity loan (%)
Mortgage status - without a mortgage (%)
Average family size
Average family size - White
Average family size - Black or African American
Average family size - Asian
Average family size - Hispanic or Latino
Average family size - American Indian and Alaska Native
Average family size - Multirace
Average family size - Other Race
Geographical mobility - Same house 1 year ago (%)
Geographical mobility - Moved within same county (%)
Geographical mobility - Moved from different county within same state (%)
Geographical mobility - Moved from different state (%)
Geographical mobility - Moved from abroad (%)
Place of birth - Born in state of residence (%)
Place of birth - Born in other state (%)
Place of birth - Native, outside of US (%)
Place of birth - Foreign born (%)
Housing units in structures - 1, detached (%)
Housing units in structures - 1, attached (%)
Housing units in structures - 2 (%)
Housing units in structures - 3 or 4 (%)
Housing units in structures - 5 to 9 (%)
Housing units in structures - 10 to 19 (%)
Housing units in structures - 20 to 49 (%)
Housing units in structures - 50 or more (%)
Housing units in structures - Mobile home (%)
Housing units in structures - Boat, RV, van, etc. (%)
House/condo owner moved in on average (years ago)
Renter moved in on average (years ago)
Year householder moved into unit - Moved in 1999 to March 2000 (%)
Year householder moved into unit - Moved in 1995 to 1998 (%)
Year householder moved into unit - Moved in 1990 to 1994 (%)
Year householder moved into unit - Moved in 1980 to 1989 (%)
Year householder moved into unit - Moved in 1970 to 1979 (%)
Year householder moved into unit - Moved in 1969 or earlier (%)
Means of transportation to work - Drove car alone (%)
Means of transportation to work - Carpooled (%)
Means of transportation to work - Public transportation (%)
Means of transportation to work - Bus or trolley bus (%)
Means of transportation to work - Streetcar or trolley car (%)
Means of transportation to work - Subway or elevated (%)
Means of transportation to work - Railroad (%)
Means of transportation to work - Ferryboat (%)
Means of transportation to work - Taxicab (%)
Means of transportation to work - Motorcycle (%)
Means of transportation to work - Bicycle (%)
Means of transportation to work - Walked (%)
Means of transportation to work - Other means (%)
Working at home (%)
Industry diversity
Most Common Industries - Agriculture, forestry, fishing and hunting, and mining (%)
Most Common Industries - Agriculture, forestry, fishing and hunting (%)
Most Common Industries - Mining, quarrying, and oil and gas extraction (%)
Most Common Industries - Construction (%)
Most Common Industries - Manufacturing (%)
Most Common Industries - Wholesale trade (%)
Most Common Industries - Retail trade (%)
Most Common Industries - Transportation and warehousing, and utilities (%)
Most Common Industries - Transportation and warehousing (%)
Most Common Industries - Utilities (%)
Most Common Industries - Information (%)
Most Common Industries - Finance and insurance, and real estate and rental and leasing (%)
Most Common Industries - Finance and insurance (%)
Most Common Industries - Real estate and rental and leasing (%)
Most Common Industries - Professional, scientific, and management, and administrative and waste management services (%)
Most Common Industries - Professional, scientific, and technical services (%)
Most Common Industries - Management of companies and enterprises (%)
Most Common Industries - Administrative and support and waste management services (%)
Most Common Industries - Educational services, and health care and social assistance (%)
Most Common Industries - Educational services (%)
Most Common Industries - Health care and social assistance (%)
Most Common Industries - Arts, entertainment, and recreation, and accommodation and food services (%)
Most Common Industries - Arts, entertainment, and recreation (%)
Most Common Industries - Accommodation and food services (%)
Most Common Industries - Other services, except public administration (%)
Most Common Industries - Public administration (%)
Occupation diversity
Most Common Occupations - Management, business, science, and arts occupations (%)
Most Common Occupations - Management, business, and financial occupations (%)
Most Common Occupations - Management occupations (%)
Most Common Occupations - Business and financial operations occupations (%)
Most Common Occupations - Computer, engineering, and science occupations (%)
Most Common Occupations - Computer and mathematical occupations (%)
Most Common Occupations - Architecture and engineering occupations (%)
Most Common Occupations - Life, physical, and social science occupations (%)
Most Common Occupations - Education, legal, community service, arts, and media occupations (%)
Most Common Occupations - Community and social service occupations (%)
Most Common Occupations - Legal occupations (%)
Most Common Occupations - Education, training, and library occupations (%)
Most Common Occupations - Arts, design, entertainment, sports, and media occupations (%)
Most Common Occupations - Healthcare practitioners and technical occupations (%)
Most Common Occupations - Health diagnosing and treating practitioners and other technical occupations (%)
Most Common Occupations - Health technologists and technicians (%)
Most Common Occupations - Service occupations (%)
Most Common Occupations - Healthcare support occupations (%)
Most Common Occupations - Protective service occupations (%)
Most Common Occupations - Fire fighting and prevention, and other protective service workers including supervisors (%)
Most Common Occupations - Law enforcement workers including supervisors (%)
Most Common Occupations - Food preparation and serving related occupations (%)
Most Common Occupations - Building and grounds cleaning and maintenance occupations (%)
Most Common Occupations - Personal care and service occupations (%)
Most Common Occupations - Sales and office occupations (%)
Most Common Occupations - Sales and related occupations (%)
Most Common Occupations - Office and administrative support occupations (%)
Most Common Occupations - Natural resources, construction, and maintenance occupations (%)
Most Common Occupations - Farming, fishing, and forestry occupations (%)
Most Common Occupations - Construction and extraction occupations (%)
Most Common Occupations - Installation, maintenance, and repair occupations (%)
Most Common Occupations - Production, transportation, and material moving occupations (%)
Most Common Occupations - Production occupations (%)
Most Common Occupations - Transportation occupations (%)
Most Common Occupations - Material moving occupations (%)
People in Group quarters - Institutionalized population (%)
People in Group quarters - Correctional institutions (%)
People in Group quarters - Federal prisons and detention centers (%)
People in Group quarters - Halfway houses (%)
People in Group quarters - Local jails and other confinement facilities (including police lockups) (%)
People in Group quarters - Military disciplinary barracks (%)
People in Group quarters - State prisons (%)
People in Group quarters - Other types of correctional institutions (%)
People in Group quarters - Nursing homes (%)
People in Group quarters - Hospitals/wards, hospices, and schools for the handicapped (%)
People in Group quarters - Hospitals/wards and hospices for chronically ill (%)
People in Group quarters - Hospices or homes for chronically ill (%)
People in Group quarters - Military hospitals or wards for chronically ill (%)
People in Group quarters - Other hospitals or wards for chronically ill (%)
People in Group quarters - Hospitals or wards for drug/alcohol abuse (%)
People in Group quarters - Mental (Psychiatric) hospitals or wards (%)
People in Group quarters - Schools, hospitals, or wards for the mentally retarded (%)
People in Group quarters - Schools, hospitals, or wards for the physically handicapped (%)
People in Group quarters - Institutions for the deaf (%)
People in Group quarters - Institutions for the blind (%)
People in Group quarters - Orthopedic wards and institutions for the physically handicapped (%)
People in Group quarters - Wards in general hospitals for patients who have no usual home elsewhere (%)
People in Group quarters - Wards in military hospitals for patients who have no usual home elsewhere (%)
People in Group quarters - Juvenile institutions (%)
People in Group quarters - Long-term care (%)
People in Group quarters - Homes for abused, dependent, and neglected children (%)
People in Group quarters - Residential treatment centers for emotionally disturbed children (%)
People in Group quarters - Training schools for juvenile delinquents (%)
People in Group quarters - Short-term care, detention or diagnostic centers for delinquent children (%)
People in Group quarters - Type of juvenile institution unknown (%)
People in Group quarters - Noninstitutionalized population (%)
People in Group quarters - College dormitories (includes college quarters off campus) (%)
People in Group quarters - Military quarters (%)
People in Group quarters - On base (%)
People in Group quarters - Barracks, unaccompanied personnel housing (UPH), (Enlisted/Officer), ;and similar group living quarters for military personnel (%)
People in Group quarters - Transient quarters for temporary residents (%)
People in Group quarters - Military ships (%)
People in Group quarters - Group homes (%)
People in Group quarters - Homes or halfway houses for drug/alcohol abuse (%)
People in Group quarters - Homes for the mentally ill (%)
People in Group quarters - Homes for the mentally retarded (%)
People in Group quarters - Homes for the physically handicapped (%)
People in Group quarters - Other group homes (%)
People in Group quarters - Religious group quarters (%)
People in Group quarters - Dormitories (%)
People in Group quarters - Agriculture workers' dormitories on farms (%)
People in Group quarters - Job Corps and vocational training facilities (%)
People in Group quarters - Other workers' dormitories (%)
People in Group quarters - Crews of maritime vessels (%)
People in Group quarters - Other nonhousehold living situations (%)
People in Group quarters - Other noninstitutional group quarters (%)
Residents speaking English at home (%)
Residents speaking English at home - Born in the United States (%)
Residents speaking English at home - Native, born elsewhere (%)
Residents speaking English at home - Foreign born (%)
Residents speaking Spanish at home (%)
Residents speaking Spanish at home - Born in the United States (%)
Residents speaking Spanish at home - Native, born elsewhere (%)
Residents speaking Spanish at home - Foreign born (%)
Residents speaking other language at home (%)
Residents speaking other language at home - Born in the United States (%)
Residents speaking other language at home - Native, born elsewhere (%)
Residents speaking other language at home - Foreign born (%)
Class of Workers - Employee of private company (%)
Class of Workers - Self-employed in own incorporated business (%)
Class of Workers - Private not-for-profit wage and salary workers (%)
Class of Workers - Local government workers (%)
Class of Workers - State government workers (%)
Class of Workers - Federal government workers (%)
Class of Workers - Self-employed workers in own not incorporated business and Unpaid family workers (%)
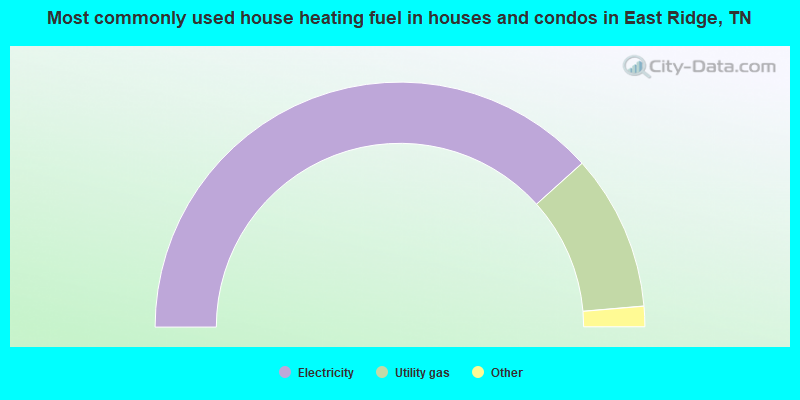
House heating fuel used in houses and condos - Utility gas (%)
House heating fuel used in houses and condos - Bottled, tank, or LP gas (%)
House heating fuel used in houses and condos - Electricity (%)
House heating fuel used in houses and condos - Fuel oil, kerosene, etc. (%)
House heating fuel used in houses and condos - Coal or coke (%)
House heating fuel used in houses and condos - Wood (%)
House heating fuel used in houses and condos - Solar energy (%)
House heating fuel used in houses and condos - Other fuel (%)
House heating fuel used in houses and condos - No fuel used (%)
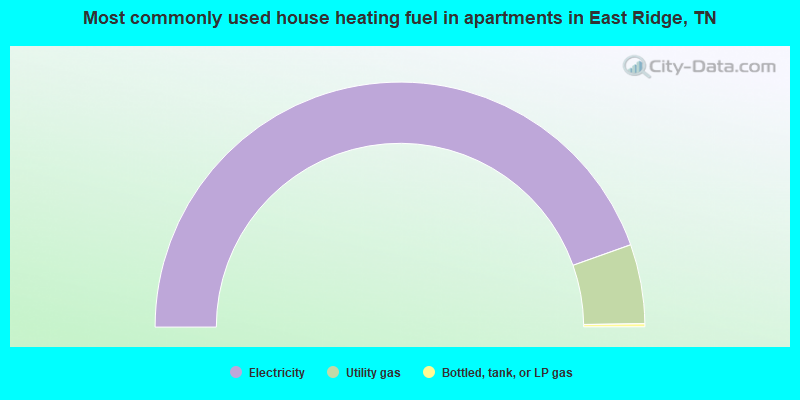
House heating fuel used in apartments - Utility gas (%)
House heating fuel used in apartments - Bottled, tank, or LP gas (%)
House heating fuel used in apartments - Electricity (%)
House heating fuel used in apartments - Fuel oil, kerosene, etc. (%)
House heating fuel used in apartments - Coal or coke (%)
House heating fuel used in apartments - Wood (%)
House heating fuel used in apartments - Solar energy (%)
House heating fuel used in apartments - Other fuel (%)
House heating fuel used in apartments - No fuel used (%)
Armed forces status - In Armed Forces (%)
Armed forces status - Civilian (%)
Armed forces status - Civilian - Veteran (%)
Armed forces status - Civilian - Nonveteran (%)
Fatal accidents locations in years 2005-2021
Fatal accidents locations in 2005
Fatal accidents locations in 2006
Fatal accidents locations in 2007
Fatal accidents locations in 2008
Fatal accidents locations in 2009
Fatal accidents locations in 2010
Fatal accidents locations in 2011
Fatal accidents locations in 2012
Fatal accidents locations in 2013
Fatal accidents locations in 2014
Fatal accidents locations in 2015
Fatal accidents locations in 2016
Fatal accidents locations in 2017
Fatal accidents locations in 2018
Fatal accidents locations in 2019
Fatal accidents locations in 2020
Fatal accidents locations in 2021
Alcohol use - People drinking some alcohol every month (%)
Alcohol use - People not drinking at all (%)
Alcohol use - Average days/month drinking alcohol
Alcohol use - Average drinks/week
Alcohol use - Average days/year people drink much
Audiometry - Average condition of hearing (%)
Audiometry - People that can hear a whisper from across a quiet room (%)
Audiometry - People that can hear normal voice from across a quiet room (%)
Audiometry - Ears ringing, roaring, buzzing (%)
Audiometry - Had a job exposure to loud noise (%)
Audiometry - Had off-work exposure to loud noise (%)
Blood Pressure & Cholesterol - Has high blood pressure (%)
Blood Pressure & Cholesterol - Checking blood pressure at home (%)
Blood Pressure & Cholesterol - Frequently checking blood cholesterol (%)
Blood Pressure & Cholesterol - Has high cholesterol level (%)
Consumer Behavior - Money monthly spent on food at supermarket/grocery store
Consumer Behavior - Money monthly spent on food at other stores
Consumer Behavior - Money monthly spent on eating out
Consumer Behavior - Money monthly spent on carryout/delivered foods
Consumer Behavior - Income spent on food at supermarket/grocery store (%)
Consumer Behavior - Income spent on food at other stores (%)
Consumer Behavior - Income spent on eating out (%)
Consumer Behavior - Income spent on carryout/delivered foods (%)
Current Health Status - General health condition (%)
Current Health Status - Blood donors (%)
Current Health Status - Has blood ever tested for HIV virus (%)
Current Health Status - Left-handed people (%)
Dermatology - People using sunscreen (%)
Diabetes - Diabetics (%)
Diabetes - Had a blood test for high blood sugar (%)
Diabetes - People taking insulin (%)
Diet Behavior & Nutrition - Diet health (%)
Diet Behavior & Nutrition - Milk product consumption (# of products/month)
Diet Behavior & Nutrition - Meals not home prepared (#/week)
Diet Behavior & Nutrition - Meals from fast food or pizza place (#/week)
Diet Behavior & Nutrition - Ready-to-eat foods (#/month)
Diet Behavior & Nutrition - Frozen meals/pizza (#/month)
Drug Use - People that ever used marijuana or hashish (%)
Drug Use - Ever used hard drugs (%)
Drug Use - Ever used any form of cocaine (%)
Drug Use - Ever used heroin (%)
Drug Use - Ever used methamphetamine (%)
Health Insurance - People covered by health insurance (%)
Kidney Conditions-Urology - Avg. # of times urinating at night
Medical Conditions - People with asthma (%)
Medical Conditions - People with anemia (%)
Medical Conditions - People with psoriasis (%)
Medical Conditions - People with overweight (%)
Medical Conditions - Elderly people having difficulties in thinking or remembering (%)
Medical Conditions - People who ever received blood transfusion (%)
Medical Conditions - People having trouble seeing even with glass/contacts (%)
Medical Conditions - People with arthritis (%)
Medical Conditions - People with gout (%)
Medical Conditions - People with congestive heart failure (%)
Medical Conditions - People with coronary heart disease (%)
Medical Conditions - People with angina pectoris (%)
Medical Conditions - People who ever had heart attack (%)
Medical Conditions - People who ever had stroke (%)
Medical Conditions - People with emphysema (%)
Medical Conditions - People with thyroid problem (%)
Medical Conditions - People with chronic bronchitis (%)
Medical Conditions - People with any liver condition (%)
Medical Conditions - People who ever had cancer or malignancy (%)
Mental Health - People who have little interest in doing things (%)
Mental Health - People feeling down, depressed, or hopeless (%)
Mental Health - People who have trouble sleeping or sleeping too much (%)
Mental Health - People feeling tired or having little energy (%)
Mental Health - People with poor appetite or overeating (%)
Mental Health - People feeling bad about themself (%)
Mental Health - People who have trouble concentrating on things (%)
Mental Health - People moving or speaking slowly or too fast (%)
Mental Health - People having thoughts they would be better off dead (%)
Oral Health - Average years since last visit a dentist
Oral Health - People embarrassed because of mouth (%)
Oral Health - People with gum disease (%)
Oral Health - General health of teeth and gums (%)
Oral Health - Average days a week using dental floss/device
Oral Health - Average days a week using mouthwash for dental problem
Oral Health - Average number of teeth
Pesticide Use - Households using pesticides to control insects (%)
Pesticide Use - Households using pesticides to kill weeds (%)
Physical Activity - People doing vigorous-intensity work activities (%)
Physical Activity - People doing moderate-intensity work activities (%)
Physical Activity - People walking or bicycling (%)
Physical Activity - People doing vigorous-intensity recreational activities (%)
Physical Activity - People doing moderate-intensity recreational activities (%)
Physical Activity - Average hours a day doing sedentary activities
Physical Activity - Average hours a day watching TV or videos
Physical Activity - Average hours a day using computer
Physical Functioning - People having limitations keeping them from working (%)
Physical Functioning - People limited in amount of work they can do (%)
Physical Functioning - People that need special equipment to walk (%)
Physical Functioning - People experiencing confusion/memory problems (%)
Physical Functioning - People requiring special healthcare equipment (%)
Prescription Medications - Average number of prescription medicines taking
Preventive Aspirin Use - Adults 40+ taking low-dose aspirin (%)
Reproductive Health - Vaginal deliveries (%)
Reproductive Health - Cesarean deliveries (%)
Reproductive Health - Deliveries resulted in a live birth (%)
Reproductive Health - Pregnancies resulted in a delivery (%)
Reproductive Health - Women breastfeeding newborns (%)
Reproductive Health - Women that had a hysterectomy (%)
Reproductive Health - Women that had both ovaries removed (%)
Reproductive Health - Women that have ever taken birth control pills (%)
Reproductive Health - Women taking birth control pills (%)
Reproductive Health - Women that have ever used Depo-Provera or injectables (%)
Reproductive Health - Women that have ever used female hormones (%)
Sexual Behavior - People 18+ that ever had sex (vaginal, anal, or oral) (%)
Sexual Behavior - Males 18+ that ever had vaginal sex with a woman (%)
Sexual Behavior - Males 18+ that ever performed oral sex on a woman (%)
Sexual Behavior - Males 18+ that ever had anal sex with a woman (%)
Sexual Behavior - Males 18+ that ever had any sex with a man (%)
Sexual Behavior - Females 18+ that ever had vaginal sex with a man (%)
Sexual Behavior - Females 18+ that ever performed oral sex on a man (%)
Sexual Behavior - Females 18+ that ever had anal sex with a man (%)
Sexual Behavior - Females 18+ that ever had any kind of sex with a woman (%)
Sexual Behavior - Average age people first had sex
Sexual Behavior - Average number of female sex partners in lifetime (males 18+)
Sexual Behavior - Average number of female vaginal sex partners in lifetime (males 18+)
Sexual Behavior - Average age people first performed oral sex on a woman (18+)
Sexual Behavior - Average number of woman performed oral sex on in lifetime (18+)
Sexual Behavior - Average number of male sex partners in lifetime (males 18+)
Sexual Behavior - Average number of male anal sex partners in lifetime (males 18+)
Sexual Behavior - Average age people first performed oral sex on a man (18+)
Sexual Behavior - Average number of male oral sex partners in lifetime (18+)
Sexual Behavior - People using protection when performing oral sex (%)
Sexual Behavior - Average number of times people have vaginal or anal sex a year
Sexual Behavior - People having sex without condom (%)
Sexual Behavior - Average number of male sex partners in lifetime (females 18+)
Sexual Behavior - Average number of male vaginal sex partners in lifetime (females 18+)
Sexual Behavior - Average number of female sex partners in lifetime (females 18+)
Sexual Behavior - Circumcised males 18+ (%)
Sleep Disorders - Average hours sleeping at night
Sleep Disorders - People that has trouble sleeping (%)
Smoking-Cigarette Use - People smoking cigarettes (%)
Taste & Smell - People 40+ having problems with smell (%)
Taste & Smell - People 40+ having problems with taste (%)
Taste & Smell - People 40+ that ever had wisdom teeth removed (%)
Taste & Smell - People 40+ that ever had tonsils teeth removed (%)
Taste & Smell - People 40+ that ever had a loss of consciousness because of a head injury (%)
Taste & Smell - People 40+ that ever had a broken nose or other serious injury to face or skull (%)
Taste & Smell - People 40+ that ever had two or more sinus infections (%)
Weight - Average height (inches)
Weight - Average weight (pounds)
Weight - Average BMI
Weight - People that are obese (%)
Weight - People that ever were obese (%)
Weight - People trying to lose weight (%)
According to our research of Tennessee and other state lists, there were 2 registered sex offenders living in East Ridge, Tennessee as of May 14, 2024 . The ratio of all residents to sex offenders in East Ridge is 10,851 to 1.The ratio of registered sex offenders to all residents in this city is much lower than the state average.
Officers per 1,000 residents here:
2.21Tennessee average:
2.57
Latest news from East Ridge, TN collected exclusively by city-data.com from local newspapers, TV, and radio stations
Ancestries: American (16.5%), English (11.1%), Irish (9.6%), German (7.6%), Yugoslavian (4.0%), European (3.1%).
Current Local Time:
Land area: 8.26 square miles.
Population density: 2,654 people per square mile (average).
2,100 residents are foreign born (5.7% Latin America , 2.0% Europe , 1.3% Asia ).
This city:
9.3%Tennessee:
5.4%
Median real estate property taxes paid for housing units with mortgages in 2022: $1,475 (0.7%)Median real estate property taxes paid for housing units with no mortgage in 2022: $1,602 (0.8%)
Nearest city with pop. 50,000+: Chattanooga, TN
Nearest city with pop. 200,000+: Atlanta, GA
Nearest city with pop. 1,000,000+: Chicago, IL
Nearest cities:
Latitude: 35.00 N, Longitude: 85.24 W
Daytime population change due to commuting: -5,404 (-24.0%)Workers who live and work in this city: 2,504 (21.2%)
Property values in East Ridge, TN
Single-family new house construction building permits:
2022: 28 buildings , average cost: $241,5002020: 19 buildings , average cost: $141,4002019: 45 buildings , average cost: $131,1002018: 32 buildings , average cost: $100,8002017: 22 buildings , average cost: $105,6002016: 22 buildings , average cost: $100,8002015: 11 buildings , average cost: $89,1002014: 12 buildings , average cost: $87,3002013: 14 buildings , average cost: $79,3002012: 20 buildings , average cost: $87,4002011: 10 buildings , average cost: $92,6002010: 14 buildings , average cost: $101,1002009: 7 buildings , average cost: $88,6002008: 24 buildings , average cost: $99,1002007: 31 buildings , average cost: $94,5002006: 18 buildings , average cost: $68,0002005: 19 buildings , average cost: $74,5002004: 15 buildings , average cost: $84,1002003: 30 buildings , average cost: $63,6002002: 10 buildings , average cost: $62,7002001: 10 buildings , average cost: $90,0002000: 8 buildings , average cost: $87,1001999: 14 buildings , average cost: $102,1001998: 12 buildings , average cost: $94,4001997: 20 buildings , average cost: $76,200Unemployment in December 2023:
Most common occupations in East Ridge, TN (%)
Both Males Females
Other office and administrative support workers, including supervisors (6.0%)
Other production occupations, including supervisors (5.4%)
Other sales and related occupations, including supervisors (4.2%)
Other management occupations, except farmers and farm managers (3.9%)
Driver/sales workers and truck drivers (3.7%)
Material recording, scheduling, dispatching, and distributing workers (3.6%)
Retail sales workers, except cashiers (3.1%)
Other production occupations, including supervisors (7.0%)
Driver/sales workers and truck drivers (6.5%)
Other sales and related occupations, including supervisors (5.0%)
Laborers and material movers, hand (4.2%)
Electrical equipment mechanics and other installation, maintenance, and repair workers, including supervisors (4.1%)
Material recording, scheduling, dispatching, and distributing workers (4.0%)
Other management occupations, except farmers and farm managers (3.8%)
Other office and administrative support workers, including supervisors (9.4%)
Retail sales workers, except cashiers (4.4%)
Customer service representatives (4.1%)
Secretaries and administrative assistants (4.1%)
Other management occupations, except farmers and farm managers (4.0%)
Preschool, kindergarten, elementary, and middle school teachers (4.0%)
Other production occupations, including supervisors (3.7%)
Air pollution and air quality trends(lower is better)
AQI Ozone PM2.5
Tornado activity:
East Ridge-area historical tornado activity is near Tennessee state average. It is 50% greater than the overall U.S. average.
On 3/29/1997, a category F3 (max. wind speeds 158-206 mph) tornado 4.9 miles away from the East Ridge city center injured 44 people and caused $45 million in damages.
On 4/3/1974, a category F4 (max. wind speeds 207-260 mph) tornado 33.4 miles away from the city center killed 9 people and injured 67 people and caused between $500,000 and $5,000,000 in damages.
Earthquake activity:
East Ridge-area historical earthquake activity is significantly above Tennessee state average. It is 113% greater than the overall U.S. average. On 4/29/2003 at 08:59:39, a magnitude 4.9 (4.4 MB, 4.6 MW, 4.9 LG, Class: Light, Intensity: IV - V) earthquake occurred 41.3 miles away from East Ridge center On 4/29/2003 at 08:59:39, a magnitude 4.6 (4.6 MW, Depth: 12.3 mi) earthquake occurred 41.3 miles away from East Ridge center On 11/30/1973 at 07:48:41, a magnitude 4.7 (4.7 MB, 4.6 ML) earthquake occurred 90.8 miles away from the city center On 12/12/2018 at 09:14:43, a magnitude 4.4 (4.4 MW, Depth: 4.9 mi) earthquake occurred 51.3 miles away from East Ridge center On 7/27/1980 at 18:52:21, a magnitude 5.2 (5.1 MB, 4.7 MS, 5.0 UK, 5.2 UK, Class: Moderate, Intensity: VI - VII) earthquake occurred 233.3 miles away from the city center On 8/2/1974 at 08:52:09, a magnitude 4.9 (4.3 MB, 4.9 LG) earthquake occurred 175.1 miles away from East Ridge center Magnitude types: regional Lg-wave magnitude (LG), body-wave magnitude (MB), local magnitude (ML), surface-wave magnitude (MS), moment magnitude (MW) Natural disasters: The number of natural disasters in Hamilton County (17) is near the US average (15).Major Disasters (Presidential) Declared: 12Emergencies Declared: 2Floods: 10, Storms: 10, Tornadoes: 7, Winds: 3, Heavy Rains: 2, Winter Storms: 2, Flash Flood: 1, Hurricane: 1, Landslide: 1, Mudslide: 1, Snowfall: 1, Other: 1 (Note: some incidents may be assigned to more than one category). Hospitals and medical centers in East Ridge: LIFE CARE CENTER OF EAST RIDGE (1500 FINCHER AVENUE)
DCI EAST RIDGE (6104 NORTH MACK SMITH RD.)
Other hospitals and medical centers near East Ridge: (CLOSED) COLUMIBA EAST RIDGE HOSP (Hospital, about 2 miles away; CHATTANOOGA, TN)
EVERGREEN MANOR INC (Nursing Home, about 3 miles away; FORT OGLETHORPE, GA)
HERITAGE HEALTHCARE OF FORT OGLETHORPE (Nursing Home, about 3 miles away; FORT OGLETHORPE, GA)
HEALTHSOUTH CHATTANOOGA REHAB HOSPITAL (Hospital, about 3 miles away; CHATTANOOGA, TN)
PARKRIDGE MEDICAL CENTER (about 4 miles away; CHATTANOOGA, TN)
(CLOSED) PARKRIDGE MEDICAL CENTER SKILLED NURSING (Nursing Home, about 4 miles away; CHATTANOOGA, TN)
NHC HEALTHCARE, CHATTANOOGA (Nursing Home, about 4 miles away; CHATTANOOGA, TN)
Amtrak station near East Ridge: 4 miles: CHATTANOOGA (GREYHOUND STA., 960 AIRPORT RD.) - Bus Station Services: enclosed waiting area, public restrooms, public payphones, call for taxi service, intercity bus service.
Operable nuclear power plants near East Ridge:
19 miles: Sequoyah 1 and 2 in Soddy-Daisy, TN.
Colleges/universities with over 2000 students nearest to East Ridge:
The University of Tennessee-Chattanooga (about 6 miles; Chattanooga, TN ; Full-time enrollment: 10,158)
Chattanooga State Community College (about 8 miles; Chattanooga, TN ; FT enrollment: 6,827)
Southern Adventist University (about 12 miles; Collegedale, TN ; FT enrollment: 2,898)
Dalton State College (about 21 miles; Dalton, GA ; FT enrollment: 3,846)
Lee University (about 24 miles; Cleveland, TN ; FT enrollment: 4,422)
Cleveland State Community College (about 25 miles; Cleveland, TN ; FT enrollment: 2,500)
Berry College (about 50 miles; Mount Berry, GA ; FT enrollment: 2,102)
Notable locations in East Ridge: (A) , East Ridge City Hall (B) , Puckett EMS (C) . Display/hide their locations on the map
Shopping Centers: (1) , Osborne Shopping Center (2) , East Ridge Shopping Center (3) . Display/hide their locations on the map
Churches in East Ridge include: (A) , Duncan Park Church (B) , East Ridge Baptist Church (C) , East Ridge Christian Church (D) , East Ridge Church of Christ (E) , EAst Ridge Church of God (F) , East Ridge Presbyterian Church (G) , Fellowship Baptist Church (H) , Frawley Church (I) . Display/hide their locations on the map
Cemeteries: (1) , Mount Olivet Cemetery (2) . Display/hide their locations on the map
Creeks: (A) , West Chickamauga Creek (B) . Display/hide their locations on the map
Park in East Ridge: (1) . Display/hide its location on the map
Hamilton County has a predicted average indoor radon screening level between 2 and 4 pCi/L (pico curies per liter) - Moderate Potential Average household size: This city:
2.2 peopleTennessee:
2.5 people
Percentage of family households: This city:
56.8%Whole state:
67.3%
Percentage of households with unmarried partners: This city:
6.4%Whole state:
5.8%
Likely homosexual households (counted as self-reported same-sex unmarried-partner households)
Lesbian couples: 0.4% of all households Gay men: 0.3% of all households
People in group quarters in East Ridge in 2010:
138 people in nursing facilities/skilled-nursing facilities
15 people in group homes intended for adults
11 people in workers' group living quarters and job corps centers
11 people in other noninstitutional facilities
People in group quarters in East Ridge in 2000:
115 people in nursing homes
72 people in other noninstitutional group quarters
27 people in other group homes
8 people in homes for the mentally retarded
3 people in religious group quarters
Banks with branches in East Ridge (2011 data):
First Tennessee Bank, National Association: East Ridge Branch at 5401 Ringgold Road, branch established on 1970/06/03. Info updated 2009/09/08: Bank assets: $24,563.4 mil, Deposits: $16,402.1 mil, headquarters in Memphis, TN, positive income , Commercial Lending Specialization, 180 total offices , Holding Company: First Horizon National Corporation
Branch Banking and Trust Company: East Ridge Branch at 6501 Ringgold Road, branch established on 2002/10/15. Info updated 2010/03/29: Bank assets: $168,867.6 mil, Deposits: $127,549.5 mil, headquarters in Winston Salem, NC, positive income , Commercial Lending Specialization, 1793 total offices , Holding Company: Bb&T Corporation
Cornerstone Community Bank: East Ridge Branch at 4154 Ringgold Road, branch established on 1997/10/15. Info updated 2006/11/03: Bank assets: $423.1 mil, Deposits: $317.5 mil, headquarters in Chattanooga, TN, positive income , Commercial Lending Specialization, 7 total offices , Holding Company: Cornerstone Bancshares, Inc.
For population 15 years and over in East Ridge:
Never married: 32.9%Now married: 46.1%Separated: 1.1%Widowed: 7.0%Divorced: 12.9% For population 25 years and over in East Ridge:
High school or higher: 85.7%Bachelor's degree or higher: 21.5%Graduate or professional degree: 6.8%Unemployed: 3.5%Mean travel time to work (commute): 16.3 minutes
Education Gini index (Inequality in education) Here:
12.5Tennessee average:
11.4
Religion statistics for East Ridge, TN (based on Hamilton County data)
Religion Adherents Congregations Evangelical Protestant 137,194 357 Mainline Protestant 31,981 68 Black Protestant 14,525 61 Catholic 12,685 6 Other 6,187 31 Orthodox 388 4 None 133,503 -
Source: Clifford Grammich, Kirk Hadaway, Richard Houseal, Dale E.Jones, Alexei Krindatch, Richie Stanley and Richard H.Taylor. 2012. 2010 U.S.Religion Census: Religious Congregations & Membership Study. Association of Statisticians of American Religious Bodies. Jones, Dale E., et al. 2002. Congregations and Membership in the United States 2000. Nashville, TN: Glenmary Research Center. Graphs represent county-level data
Food Environment Statistics: Number of grocery stores : 68Hamilton County :
2.06 / 10,000 pop.State :
1.99 / 10,000 pop.
Number of supercenters and club stores : 3Hamilton County :
0.09 / 10,000 pop.State :
0.17 / 10,000 pop.
Number of convenience stores (no gas) : 20Here :
0.61 / 10,000 pop.Tennessee :
0.65 / 10,000 pop.
Number of convenience stores (with gas) : 156This county :
4.73 / 10,000 pop.State :
5.16 / 10,000 pop.
Number of full-service restaurants : 259Hamilton County :
7.85 / 10,000 pop.State :
6.56 / 10,000 pop.
Adult diabetes rate : This county :
11.1%Tennessee :
11.4%
Adult obesity rate : This county :
28.5%Tennessee :
30.2%
Low-income preschool obesity rate : This county :
12.6%State :
13.5%
Health and Nutrition:
Average overall health of teeth and gums : People feeling badly about themselves : East Ridge:
23.0%Tennessee:
21.0%
People not drinking alcohol at all : This city:
11.8%Tennessee:
10.5%
Average hours sleeping at night : Overweight people : East Ridge:
32.8%Tennessee:
33.9%
General health condition : Average condition of hearing : East Ridge:
76.0%State:
79.1%
More about Health and Nutrition of East Ridge, TN Residents
Local government employment and payroll (March 2022)
Function
Full-time employees
Monthly full-time payroll
Average yearly full-time wage
Part-time employees
Monthly part-time payroll
Police Protection - Officers
44 $198,309 $54,084 1 $2,068 Firefighters
23 $88,361 $46,101 0 $0 Solid Waste Management
14 $45,307 $38,835 0 $0 Parks and Recreation
12 $44,341 $44,341 7 $11,111 Other and Unallocable
11 $39,386 $42,967 4 $6,067 Streets and Highways
10 $38,338 $46,006 0 $0 Financial Administration
6 $33,763 $67,526 0 $0 Police - Other
5 $16,678 $40,027 7 $9,382 Judicial and Legal
4 $14,811 $44,433 0 $0 Local Libraries
2 $8,069 $48,414 4 $6,324 Other Government Administration
1 $4,393 $52,716 0 $0
Totals for Government
132 $531,756 $48,341 23 $34,953
East Ridge government finances - Expenditure in 2021 (per resident):
Current Operations - Police Protection: $4,870,000 ($222.01)
Central Staff Services: $2,654,000 ($120.99)Local Fire Protection: $2,301,000 ($104.90)Parks and Recreation: $2,081,000 ($94.87)Solid Waste Management: $1,339,000 ($61.04)Regular Highways: $973,000 ($44.36)Financial Administration: $676,000 ($30.82)Protective Inspection and Regulation - Other: $617,000 ($28.13)Judicial and Legal Services: $382,000 ($17.41)Libraries: $197,000 ($8.98)General - Interest on Debt: $678,000 ($30.91)
Other Capital Outlay - Regular Highways: $712,000 ($32.46)
Total Salaries and Wages: $2,067,000 ($94.23)
East Ridge government finances - Revenue in 2021 (per resident):
Charges - Other: $11,033,000 ($502.96)
Solid Waste Management: $1,595,000 ($72.71)Parks and Recreation: $599,000 ($27.31)Miscellaneous Commercial Activities: $330,000 ($15.04)Local Intergovernmental - Other: $98,000 ($4.47)
Miscellaneous - Fines and Forfeits: $415,000 ($18.92)
State Intergovernmental - Highways: $1,678,000 ($76.50)
Tax - Property: $5,987,000 ($272.93)
General Sales and Gross Receipts: $5,724,000 ($260.94)Alcoholic Beverage Sales: $474,000 ($21.61)Occupation and Business License - Other: $232,000 ($10.58)Other License: $179,000 ($8.16)Alcoholic Beverage License: $9,000 ($0.41)
East Ridge government finances - Debt in 2021 (per resident):
Long Term Debt - Beginning Outstanding - Unspecified Public Purpose: $16,137,000 ($735.64)
Outstanding Unspecified Public Purpose: $15,269,000 ($696.07)Retired Unspecified Public Purpose: $868,000 ($39.57)
East Ridge government finances - Cash and Securities in 2021 (per resident):
Bond Funds - Cash and Securities: $578,000 ($26.35)
Other Funds - Cash and Securities: $1,304,000 ($59.45)
Businesses in East Ridge, TN
Name Count Name Count
Advance Auto Parts 1 Long John Silver's 1 Arby's 1 Marriott 1 AutoZone 1 Pizza Hut 1 CVS 1 Rite Aid 1 Cracker Barrel 1 SONIC Drive-In 1 Cricket Wireless 1 Taco Bell 1 H&R Block 1 U-Haul 1 Kmart 1 Waffle House 1 Little Caesars Pizza 1 Walgreens 2
Strongest AM radio stations in East Ridge:
WFLI (1070 AM; 50 kW; LOOKOUT MOUNTAIN, TN; Owner: WFLI, INC.)
WNOO (1260 AM; 5 kW; CHATTANOOGA, TN; Owner: PYE BROADCASTING, INC.)
WWAM (820 AM; daytime; 50 kW; JASPER, TN; Owner: SHELTON BROADCASTING SYSTEM)
WDEF (1370 AM; 5 kW; CHATTANOOGA, TN; Owner: JACKSON TELECASTERS, INC)
WGOW (1150 AM; 5 kW; CHATTANOOGA, TN; Owner: CITADEL BROADCASTING COMPANY)
WDOD (1310 AM; 5 kW; CHATTANOOGA, TN; Owner: WDOD OF CHATTANOOGA, INC.)
WLMR (1450 AM; 1 kW; CHATTANOOGA, TN; Owner: GRACE MEDIA, INC.)
WJOC (1490 AM; 1 kW; CHATTANOOGA, TN; Owner: SARAH MARGARETT FRYAR)
WUUS (980 AM; 0 kW; ROSSVILLE, GA; Owner: CAPSTAR TX LIMITED PARTNERSHIP)
WTTI (1530 AM; daytime; 10 kW; DALTON, GA; Owner: PYE WILSON BROADCASTING, INC.)
WCNN (680 AM; 50 kW; NORTH ATLANTA, GA; Owner: DICKEY BROADCASTING COMPANY)
WQCH (1590 AM; 5 kW; LAFAYETTE, GA; Owner: RADIX BROADCASTING, INC.)
WNSI (810 AM; 50 kW; JACKSONVILLE, AL; Owner: UNITED BROADCASTING NETWORK, INC.)
Strongest FM radio stations in East Ridge:
WRXR-FM (105.5 FM; ROSSVILLE, GA; Owner: CAPSTAR TX LIMITED PARTNERSHIP)
W257AZ (99.3 FM; LOOKOUT MOUNTAIN, TN; Owner: CAPSTAR TX LIMITED PARTNERSHIP)
WMBW (88.9 FM; CHATTANOOGA, TN; Owner: THE MOODY BIBLE INSTITUTE OF CHICAGO)
W284AE (104.7 FM; ORCHARD HILLS, GA; Owner: WAY-FM MEDIA GROUP, INC.)
WLOV-FM1 (97.3 FM; CHATTANOOGA, TN; Owner: CAPSTAR TX LIMITED PARTNERSHIP)
WAWL-FM (91.5 FM; RED BANK, TN; Owner: CHATTANOOGA STATE TECHNICAL COMMUNITY COLLEGE)
W241AF (96.1 FM; ROSSVILLE, GA; Owner: IMMANUEL BROADCASTING NETWORK, INC.)
WUSY (100.7 FM; CLEVELAND, TN; Owner: CAPSTAR TX LIMITED PARTNERSHIP)
WDEF-FM (92.3 FM; CHATTANOOGA, TN; Owner: JACKSON TELECASTERS, INC.)
WBDX (102.7 FM; TRENTON, GA; Owner: PARTNERS FOR CHRISTIAN RADIO, INC.)
WKXJ (98.1 FM; SIGNAL MOUNTAIN, TN; Owner: CAPSTAR TX LIMITED PARTNERSHIP)
WDOD-FM (96.5 FM; CHATTANOOGA, TN; Owner: WDOD OF CHATTANOOGA, INC.)
WSGC-FM (101.9 FM; RINGGOLD, GA; Owner: CLEAR CHANNEL BROADCASTING LICENSES, INC.)
WSKZ (106.5 FM; CHATTANOOGA, TN; Owner: CITADEL BROADCASTING COMPANY)
WOGT (107.9 FM; EAST RIDGE, TN; Owner: CITADEL BROADCASTING COMPANY)
W278AC (103.5 FM; WALDEN, TN; Owner: CAPSTAR TX LIMITED PARTNERSHIP)
WDYN (89.7 FM; CHATTANOOGA, TN; Owner: TENNESSEE TEMPLE UNIVERSITY)
W260AJ (99.9 FM; RINGGOLD, GA; Owner: WCCV)
WUTC (88.1 FM; CHATTANOOGA, TN; Owner: UNIVERSITY OF TENNESSEE)
W268AA (101.5 FM; FALLING WATER, TN; Owner: S/WEST FLORIDA COMMUNITY RADIO, INC.)
TV broadcast stations around East Ridge:
WFLI-TV (Channel 53; CLEVELAND, TN; Owner: CHATTANOOGA MEDIA HOLDINGS, L.L.C.)
WELF (Channel 23; DALTON, GA; Owner: TRINITY BROADCASTING NETWORK)
WDEF-TV (Channel 12; CHATTANOOGA, TN; Owner: MEDIA GENERAL COMMUNICATIONS, INC.)
WDSI-TV (Channel 61; CHATTANOOGA, TN; Owner: WDSI LICENSE CORP.)
WRCB-TV (Channel 3; CHATTANOOGA, TN; Owner: SARKES TARZIAN, INC.)
WTCI (Channel 45; CHATTANOOGA, TN; Owner: THE GREATER CHATTANOOGA PUBLIC TELEVISION CORP)
WTVC (Channel 9; CHATTANOOGA, TN; Owner: FREEDOM BROADCASTING OF TENNESSEE, INC.)
W26BE (Channel 26; CHATTANOOGA, TN; Owner: THREE ANGELS BROADCASTING NETWORK)
W66CG (Channel 66; ACTON, TN; Owner: MS COMMUNICATIONS, LLC)
W21BZ (Channel 21; COLLEGEDALE, TN; Owner: THREE ANGELS BROADCASTING NETWORK)
WOOT-LP (Channel 6; CHATTANOOGA, ETC., TN; Owner: TIGER EYE BROADCASTING CORPORATION)
WCNT-LP (Channel 65; CHATTANOOGA, TN; Owner: NORTH GEORGIA TELEVISION)
WYHB-CA (Channel 39; CHATTANOOGA, TN; Owner: YING HUA BENNS)
WRNG-LP (Channel 63; RINGGOLD, GA; Owner: NORTH GEORGIA TELEVISION)
National Bridge Inventory (NBI) Statistics 23 Number of bridges220ft / 67.4m Total length $8,340,000 Total costs873,301 Total average daily traffic162,644 Total average daily truck traffic
New bridges - historical statistics
1 1930-1939 7 1950-1959 7 1960-1969 3 1970-1979 2 1990-1999 3 2020-2022
See full National Bridge Inventory statistics for East Ridge, TN
FCC Registered Antenna Towers: 26 (
See the full list of FCC Registered Antenna Towers in East Ridge )
FCC Registered Broadcast Land Mobile Towers: 3
Lat: 34.995361 Lon: -85.241889, Call Sign: KQY705, Assigned Frequencies: 460.300 MHz, 460.325 MHz, 465.325 MHz, Grant Date: 03/26/2015, Expiration Date: 06/20/2025, Registrant: Communications & Electronics, Inc., 2310 Belle Arbor Ave., Chattanooga, TN 37406, Phone: (423) 698-3306, Fax: (423) 698-0446, Email:
Lat: 34.995889 Lon: -85.239917, Call Sign: WQUZ578, Assigned Frequencies: 155.295 MHz, 155.205 MHz, 155.340 MHz, Grant Date: 12/01/2014, Expiration Date: 12/01/2024, Certifier: Todd Penny, Registrant: Communications & Electronics, Inc., 1201 Crutchfield Street, Chattanooga, TN 37406, Phone: (423) 702-7517, Fax: (423) 698-0446, Email:
Prestige Patient Tra, Lat: 34.992139 Lon: -85.227806, Call Sign: WROY423, Assigned Frequencies: 155.205 MHz, 155.340 MHz, 155.295 MHz, Grant Date: 12/29/2021, Expiration Date: 12/29/2031, Certifier: Alan C Motta, Registrant: Prestige Patient Transport LLC, 934 1/2 Business 28, Suite A, Milford, OH 45150, Phone: (937) 690-6100, Fax: (888) 273-7025, Email:
FCC Registered Microwave Towers: 1
5512 Ringgold Rd (Lat: 34.992278 Lon: -85.228278), Overall height: 15.2 m, Call Sign: WLP692, Assigned Frequencies: 944.500 MHz, Grant Date: 08/19/1999, Expiration Date: 04/01/2028, Phone: (423) 332-4953 FCC Registered Amateur Radio Licenses: 37 (
See the full list of FCC Registered Amateur Radio Licenses in East Ridge )
FAA Registered Aircraft: 2
Aircraft: GRUMMAN AMERICAN AVN. CORP. AA-1B (Category: Land, Seats: 2, Weight: Up to 12,499 Pounds, Speed: 100 mph), Engine: LYCOMING 0-235 SERIES (115 HP) (Reciprocating)N-Number: 8860L, N8860L, N-8860L, Serial Number: AA1B-0360, Year manufactured: 1974, Airworthiness Date: 03/01/1974, Certificate Issue Date: 10/25/2013Registrant (Individual): George J Crowe, 3706 Connelly Ln, East Ridge, TN 37412Aircraft: AIRBORNE OF AUSTRALIA EDGE X (Category: Land, Seats: 2, Weight: Up to 12,499 Pounds), Engine: ROTAX 582SER (65 HP) (2 Cycle)N-Number: 659SJ, N659SJ, N-659SJ, Serial Number: 582-388, Year manufactured: 2004, Airworthiness Date: 09/20/2011, Certificate Issue Date: 03/15/2012Registrant (Individual): Benjamin Valdes, Po Box 9963, East Ridge, TN 37412Deregistered: Cancel Date: 02/09/2018
Home Mortgage Disclosure Act Aggregated Statistics For Year 2009(Based on 4 full and 1 partial tracts) A) FHA, FSA/RHS & VA B) Conventional C) Refinancings D) Home Improvement Loans E) Loans on Dwellings For 5+ Families F) Non-occupant Loans on Number Average Value Number Average Value Number Average Value Number Average Value Number Average Value Number Average Value
LOANS ORIGINATED 133 $97,300 77 $106,922 297 $99,747 19 $28,689 4 $385,500 73 $99,884 APPLICATIONS APPROVED, NOT ACCEPTED 4 $102,748 3 $61,000 26 $95,344 4 $16,500 0 $0 5 $85,600 APPLICATIONS DENIED 10 $92,081 20 $91,606 109 $114,891 17 $26,323 0 $0 10 $68,500 APPLICATIONS WITHDRAWN 22 $105,664 14 $98,357 102 $116,026 1 $104,000 0 $0 8 $76,875 FILES CLOSED FOR INCOMPLETENESS 4 $96,475 3 $124,547 24 $124,912 0 $0 0 $0 1 $95,000
Aggregated Statistics For Year 2008(Based on 4 full and 1 partial tracts) A) FHA, FSA/RHS & VA B) Conventional C) Refinancings D) Home Improvement Loans E) Loans on Dwellings For 5+ Families F) Non-occupant Loans on G) Loans On Manufactured Number Average Value Number Average Value Number Average Value Number Average Value Number Average Value Number Average Value Number Average Value
LOANS ORIGINATED 107 $107,873 99 $102,246 203 $104,540 41 $35,162 8 $1,231,125 80 $96,048 0 $0 APPLICATIONS APPROVED, NOT ACCEPTED 4 $103,000 9 $91,198 21 $103,087 11 $22,636 0 $0 2 $110,000 0 $0 APPLICATIONS DENIED 13 $111,923 24 $88,103 187 $113,247 28 $53,418 0 $0 19 $81,263 2 $83,500 APPLICATIONS WITHDRAWN 17 $107,059 20 $112,651 63 $117,131 5 $50,920 0 $0 10 $65,100 0 $0 FILES CLOSED FOR INCOMPLETENESS 3 $118,333 4 $138,285 32 $105,218 0 $0 0 $0 4 $93,498 0 $0
Aggregated Statistics For Year 2007(Based on 4 full and 1 partial tracts) A) FHA, FSA/RHS & VA B) Conventional C) Refinancings D) Home Improvement Loans E) Loans on Dwellings For 5+ Families F) Non-occupant Loans on G) Loans On Manufactured Number Average Value Number Average Value Number Average Value Number Average Value Number Average Value Number Average Value Number Average Value
LOANS ORIGINATED 68 $109,475 280 $119,149 303 $95,136 59 $44,300 5 $2,305,400 92 $91,755 2 $102,500 APPLICATIONS APPROVED, NOT ACCEPTED 0 $0 35 $90,831 55 $101,728 9 $29,333 0 $0 21 $102,000 1 $98,000 APPLICATIONS DENIED 16 $108,812 70 $97,698 289 $105,629 54 $49,944 2 $1,672,500 36 $96,344 0 $0 APPLICATIONS WITHDRAWN 5 $118,200 43 $117,015 109 $105,731 13 $56,268 1 $644,770 16 $90,562 0 $0 FILES CLOSED FOR INCOMPLETENESS 4 $112,500 30 $110,076 79 $108,977 2 $47,000 0 $0 10 $105,800 0 $0
Aggregated Statistics For Year 2006(Based on 4 full and 1 partial tracts) A) FHA, FSA/RHS & VA B) Conventional C) Refinancings D) Home Improvement Loans E) Loans on Dwellings For 5+ Families F) Non-occupant Loans on G) Loans On Manufactured Number Average Value Number Average Value Number Average Value Number Average Value Number Average Value Number Average Value Number Average Value
LOANS ORIGINATED 41 $112,268 376 $78,766 347 $87,385 66 $33,290 1 $680,000 125 $76,847 1 $69,000 APPLICATIONS APPROVED, NOT ACCEPTED 2 $91,500 78 $86,306 87 $88,234 11 $27,727 0 $0 18 $81,216 6 $71,167 APPLICATIONS DENIED 5 $75,400 104 $115,259 296 $97,447 74 $40,946 0 $0 44 $72,359 12 $60,077 APPLICATIONS WITHDRAWN 7 $108,304 53 $77,457 157 $102,763 11 $50,455 0 $0 17 $86,645 0 $0 FILES CLOSED FOR INCOMPLETENESS 0 $0 20 $72,588 59 $95,287 3 $10,000 0 $0 10 $68,781 0 $0
Aggregated Statistics For Year 2005(Based on 4 full and 1 partial tracts) A) FHA, FSA/RHS & VA B) Conventional C) Refinancings D) Home Improvement Loans E) Loans on Dwellings For 5+ Families F) Non-occupant Loans on G) Loans On Manufactured Number Average Value Number Average Value Number Average Value Number Average Value Number Average Value Number Average Value Number Average Value
LOANS ORIGINATED 48 $100,017 380 $76,876 388 $83,627 56 $32,971 1 $285,420 102 $87,901 1 $94,000 APPLICATIONS APPROVED, NOT ACCEPTED 3 $90,000 55 $77,907 64 $83,215 12 $33,394 0 $0 11 $74,727 7 $67,429 APPLICATIONS DENIED 10 $99,600 93 $67,526 254 $93,139 59 $30,161 0 $0 19 $58,278 20 $44,764 APPLICATIONS WITHDRAWN 4 $84,360 48 $87,806 216 $102,989 15 $90,200 0 $0 16 $104,431 0 $0 FILES CLOSED FOR INCOMPLETENESS 3 $99,000 17 $79,706 24 $109,009 1 $29,000 0 $0 2 $35,370 0 $0
Aggregated Statistics For Year 2004(Based on 4 full and 1 partial tracts) A) FHA, FSA/RHS & VA B) Conventional C) Refinancings D) Home Improvement Loans E) Loans on Dwellings For 5+ Families F) Non-occupant Loans on G) Loans On Manufactured Number Average Value Number Average Value Number Average Value Number Average Value Number Average Value Number Average Value Number Average Value
LOANS ORIGINATED 62 $97,235 294 $84,015 407 $81,680 51 $32,556 3 $2,213,333 120 $73,825 2 $8,000 APPLICATIONS APPROVED, NOT ACCEPTED 4 $109,000 62 $82,127 105 $78,866 8 $41,534 0 $0 12 $63,132 9 $25,951 APPLICATIONS DENIED 9 $91,788 84 $71,038 260 $87,974 60 $26,729 1 $320,000 21 $83,318 25 $42,185 APPLICATIONS WITHDRAWN 6 $85,500 41 $77,728 149 $88,141 9 $32,620 0 $0 11 $61,000 0 $0 FILES CLOSED FOR INCOMPLETENESS 1 $79,090 9 $80,333 30 $86,073 4 $31,500 0 $0 1 $72,000 0 $0
Aggregated Statistics For Year 2003(Based on 4 full and 1 partial tracts) A) FHA, FSA/RHS & VA B) Conventional C) Refinancings D) Home Improvement Loans E) Loans on Dwellings For 5+ Families F) Non-occupant Loans on Number Average Value Number Average Value Number Average Value Number Average Value Number Average Value Number Average Value
LOANS ORIGINATED 64 $87,066 255 $79,081 665 $75,926 37 $18,499 4 $894,000 119 $65,636 APPLICATIONS APPROVED, NOT ACCEPTED 4 $92,440 28 $80,630 115 $78,877 6 $22,500 0 $0 15 $76,037 APPLICATIONS DENIED 7 $85,714 38 $78,834 286 $80,412 46 $19,856 0 $0 23 $71,837 APPLICATIONS WITHDRAWN 7 $93,271 25 $85,116 145 $86,119 4 $27,250 0 $0 8 $67,014 FILES CLOSED FOR INCOMPLETENESS 1 $97,000 11 $65,000 16 $94,458 1 $100,000 0 $0 1 $88,000
Aggregated Statistics For Year 2002(Based on 4 full tracts) A) FHA, FSA/RHS & VA B) Conventional C) Refinancings D) Home Improvement Loans E) Loans on Dwellings For 5+ Families F) Non-occupant Loans on Number Average Value Number Average Value Number Average Value Number Average Value Number Average Value Number Average Value
LOANS ORIGINATED 64 $81,562 175 $72,554 429 $71,744 38 $14,921 1 $700,000 85 $61,141 APPLICATIONS APPROVED, NOT ACCEPTED 3 $68,667 48 $77,146 109 $69,358 6 $21,000 0 $0 8 $59,625 APPLICATIONS DENIED 7 $72,000 95 $56,989 196 $66,536 26 $13,846 0 $0 28 $53,571 APPLICATIONS WITHDRAWN 6 $88,500 35 $73,743 113 $72,699 4 $45,000 0 $0 6 $61,000 FILES CLOSED FOR INCOMPLETENESS 1 $58,000 6 $68,833 10 $64,700 1 $106,000 0 $0 3 $50,667
Aggregated Statistics For Year 2001(Based on 4 full tracts) A) FHA, FSA/RHS & VA B) Conventional C) Refinancings D) Home Improvement Loans E) Loans on Dwellings For 5+ Families F) Non-occupant Loans on Number Average Value Number Average Value Number Average Value Number Average Value Number Average Value Number Average Value
LOANS ORIGINATED 78 $80,949 188 $70,899 376 $72,122 45 $11,844 8 $673,250 77 $64,299 APPLICATIONS APPROVED, NOT ACCEPTED 0 $0 46 $70,109 70 $67,500 9 $18,333 0 $0 8 $47,000 APPLICATIONS DENIED 8 $77,250 84 $52,810 179 $75,084 27 $18,667 1 $2,200,000 17 $76,235 APPLICATIONS WITHDRAWN 9 $73,333 24 $57,792 106 $63,509 7 $20,571 0 $0 4 $47,500 FILES CLOSED FOR INCOMPLETENESS 1 $100,000 10 $63,200 29 $69,414 0 $0 0 $0 2 $56,000
Aggregated Statistics For Year 2000(Based on 4 full tracts) A) FHA, FSA/RHS & VA B) Conventional C) Refinancings D) Home Improvement Loans F) Non-occupant Loans on Number Average Value Number Average Value Number Average Value Number Average Value Number Average Value
LOANS ORIGINATED 85 $77,000 176 $62,858 173 $57,179 42 $17,762 52 $46,538 APPLICATIONS APPROVED, NOT ACCEPTED 9 $43,111 28 $58,464 42 $63,690 13 $14,077 7 $62,571 APPLICATIONS DENIED 14 $66,571 81 $55,716 145 $57,455 33 $15,758 11 $56,091 APPLICATIONS WITHDRAWN 11 $62,364 32 $68,938 82 $64,671 4 $20,500 0 $0 FILES CLOSED FOR INCOMPLETENESS 1 $70,000 18 $66,889 23 $64,000 0 $0 3 $65,000
Aggregated Statistics For Year 1999(Based on 5 full and 1 partial tracts) A) FHA, FSA/RHS & VA B) Conventional C) Refinancings D) Home Improvement Loans E) Loans on Dwellings For 5+ Families F) Non-occupant Loans on Number Average Value Number Average Value Number Average Value Number Average Value Number Average Value Number Average Value
LOANS ORIGINATED 84 $76,070 182 $75,161 274 $63,630 69 $19,533 1 $107,760 57 $58,237 APPLICATIONS APPROVED, NOT ACCEPTED 0 $0 48 $73,252 82 $68,255 14 $11,031 0 $0 2 $89,505 APPLICATIONS DENIED 13 $71,536 98 $59,241 147 $66,099 38 $11,410 0 $0 11 $62,914 APPLICATIONS WITHDRAWN 5 $68,618 34 $68,015 133 $63,129 9 $39,540 0 $0 1 $89,430 FILES CLOSED FOR INCOMPLETENESS 1 $91,890 20 $57,802 31 $57,492 0 $0 0 $0 2 $44,395
Detailed HMDA statistics for the following Tracts:
0114.42
, 0116.00 , 0117.00 , 0118.00 , 0119.00
Private Mortgage Insurance Companies Aggregated Statistics For Year 2009(Based on 4 full and 1 partial tracts) A) Conventional B) Refinancings C) Non-occupant Loans on Number Average Value Number Average Value Number Average Value
LOANS ORIGINATED 14 $102,361 13 $123,100 1 $120,000 APPLICATIONS APPROVED, NOT ACCEPTED 3 $218,273 4 $244,750 1 $193,430 APPLICATIONS DENIED 1 $105,740 1 $72,000 0 $0 APPLICATIONS WITHDRAWN 2 $94,000 0 $0 0 $0 FILES CLOSED FOR INCOMPLETENESS 0 $0 1 $90,000 1 $90,000
Aggregated Statistics For Year 2008(Based on 4 full and 1 partial tracts) A) Conventional B) Refinancings C) Non-occupant Loans on Number Average Value Number Average Value Number Average Value
LOANS ORIGINATED 50 $109,473 21 $126,911 11 $100,610 APPLICATIONS APPROVED, NOT ACCEPTED 15 $130,834 8 $166,125 4 $100,500 APPLICATIONS DENIED 2 $167,500 5 $123,600 4 $89,250 APPLICATIONS WITHDRAWN 0 $0 1 $82,000 0 $0 FILES CLOSED FOR INCOMPLETENESS 4 $193,050 3 $85,000 5 $90,002
Aggregated Statistics For Year 2007(Based on 4 full and 1 partial tracts) A) Conventional B) Refinancings C) Non-occupant Loans on Number Average Value Number Average Value Number Average Value
LOANS ORIGINATED 137 $108,123 39 $107,422 12 $97,406 APPLICATIONS APPROVED, NOT ACCEPTED 19 $100,684 14 $114,268 4 $110,750 APPLICATIONS DENIED 4 $88,500 1 $122,000 0 $0 APPLICATIONS WITHDRAWN 3 $103,333 2 $126,500 2 $106,000 FILES CLOSED FOR INCOMPLETENESS 2 $93,500 1 $85,000 1 $102,000
Aggregated Statistics For Year 2006(Based on 4 full and 1 partial tracts) A) Conventional B) Refinancings C) Non-occupant Loans on Number Average Value Number Average Value Number Average Value
LOANS ORIGINATED 71 $97,920 27 $111,804 14 $85,571 APPLICATIONS APPROVED, NOT ACCEPTED 14 $98,853 7 $94,571 5 $104,400 APPLICATIONS DENIED 2 $109,500 2 $95,520 2 $98,500 APPLICATIONS WITHDRAWN 2 $89,500 4 $115,000 2 $82,500 FILES CLOSED FOR INCOMPLETENESS 0 $0 0 $0 0 $0
Aggregated Statistics For Year 2005(Based on 4 full and 1 partial tracts) A) Conventional B) Refinancings C) Non-occupant Loans on Number Average Value Number Average Value Number Average Value
LOANS ORIGINATED 67 $96,751 35 $99,814 15 $78,363 APPLICATIONS APPROVED, NOT ACCEPTED 14 $82,429 7 $106,857 2 $102,500 APPLICATIONS DENIED 1 $31,000 0 $0 0 $0 APPLICATIONS WITHDRAWN 2 $107,895 2 $99,500 1 $49,000 FILES CLOSED FOR INCOMPLETENESS 0 $0 0 $0 0 $0
Aggregated Statistics For Year 2004(Based on 4 full and 1 partial tracts) A) Conventional B) Refinancings C) Non-occupant Loans on Number Average Value Number Average Value Number Average Value
LOANS ORIGINATED 71 $90,579 39 $102,161 17 $89,290 APPLICATIONS APPROVED, NOT ACCEPTED 13 $85,135 14 $110,782 7 $77,679 APPLICATIONS DENIED 5 $68,400 3 $96,000 1 $108,000 APPLICATIONS WITHDRAWN 1 $61,900 4 $89,250 1 $61,000 FILES CLOSED FOR INCOMPLETENESS 1 $104,000 0 $0 1 $104,000
Aggregated Statistics For Year 2003(Based on 4 full and 1 partial tracts) A) Conventional B) Refinancings C) Non-occupant Loans on Number Average Value Number Average Value Number Average Value
LOANS ORIGINATED 101 $90,012 85 $87,012 11 $73,503 APPLICATIONS APPROVED, NOT ACCEPTED 4 $74,000 13 $79,720 3 $78,333 APPLICATIONS DENIED 1 $78,000 0 $0 0 $0 APPLICATIONS WITHDRAWN 4 $93,250 5 $78,882 1 $76,000 FILES CLOSED FOR INCOMPLETENESS 0 $0 0 $0 0 $0
Aggregated Statistics For Year 2002(Based on 4 full tracts) A) Conventional B) Refinancings C) Non-occupant Loans on Number Average Value Number Average Value Number Average Value
LOANS ORIGINATED 72 $83,278 72 $86,014 15 $74,533 APPLICATIONS APPROVED, NOT ACCEPTED 4 $69,250 17 $85,588 1 $65,000 APPLICATIONS DENIED 0 $0 0 $0 0 $0 APPLICATIONS WITHDRAWN 4 $80,250 3 $78,000 0 $0 FILES CLOSED FOR INCOMPLETENESS 2 $94,000 2 $69,500 0 $0
Aggregated Statistics For Year 2001(Based on 4 full tracts) A) Conventional B) Refinancings C) Non-occupant Loans on Number Average Value Number Average Value Number Average Value
LOANS ORIGINATED 67 $79,522 63 $83,429 13 $63,692 APPLICATIONS APPROVED, NOT ACCEPTED 12 $68,250 16 $91,812 5 $66,000 APPLICATIONS DENIED 0 $0 2 $153,000 0 $0 APPLICATIONS WITHDRAWN 1 $45,000 3 $55,000 1 $45,000 FILES CLOSED FOR INCOMPLETENESS 2 $65,500 2 $69,000 1 $71,000
Aggregated Statistics For Year 2000(Based on 4 full tracts) A) Conventional B) Refinancings C) Non-occupant Loans on Number Average Value Number Average Value Number Average Value
LOANS ORIGINATED 77 $75,104 18 $77,833 9 $56,111 APPLICATIONS APPROVED, NOT ACCEPTED 5 $74,800 0 $0 0 $0 APPLICATIONS DENIED 2 $83,000 1 $106,000 0 $0 APPLICATIONS WITHDRAWN 3 $83,333 1 $99,000 0 $0 FILES CLOSED FOR INCOMPLETENESS 2 $82,500 0 $0 1 $77,000
Aggregated Statistics For Year 1999(Based on 5 full and 1 partial tracts) A) Conventional B) Refinancings C) Non-occupant Loans on Number Average Value Number Average Value Number Average Value
LOANS ORIGINATED 71 $73,602 22 $80,803 8 $64,620 APPLICATIONS APPROVED, NOT ACCEPTED 2 $69,275 2 $75,545 0 $0 APPLICATIONS DENIED 1 $64,830 0 $0 0 $0 APPLICATIONS WITHDRAWN 3 $68,127 0 $0 0 $0 FILES CLOSED FOR INCOMPLETENESS 0 $0 0 $0 0 $0
Detailed PMIC statistics for the following Tracts:
0114.42
, 0116.00 , 0117.00 , 0118.00 , 0119.00 Fire-safe hotels and motels in East Ridge, Tennessee:
Fairfield Inn And Suites By Marriott, 1453 Mack Smith Rd, East Ridge, Tennessee 37412 Phone: (423) 499-4080, Fax: (423) 499-4079
Motel 6, 2281 Cp Jordan Pkwy, East Ridge, Tennessee 37412 Phone: (423) 894-1417, Fax: (423) 242-1257
All 2 fire-safe hotels and motels in East Ridge, Tennessee East Ridge compared to Tennessee state average:
Unemployed percentage significantly below state average. Hispanic race population percentage above state average. Foreign-born population percentage above state average. Length of stay since moving in significantly above state average. East Ridge on our top lists :
#40 on the list of "Top 101 cities with the most residents born in Bosnia and Herzegovina (population 500+)"
#20 on the list of "Top 101 counties with the highest number of infant deaths per 1000 residents 2007-2013 (pop. 50,000+)"
#41 on the list of "Top 101 counties with the most Black Protestant congregations"
#49 on the list of "Top 101 counties with the most Evangelical Protestant adherents"
#53 on the list of "Top 101 counties with the most Evangelical Protestant congregations"
#68 on the list of "Top 101 counties with the most Black Protestant adherents"
Top Patent Applicants
Michael Varner (1)
Russell W. Fountain (1)
Aram Perez (1)
Russell Fountain (1)
Bradley J. Mccurry (1)
Total of 5 patent applications in 2008-2024.
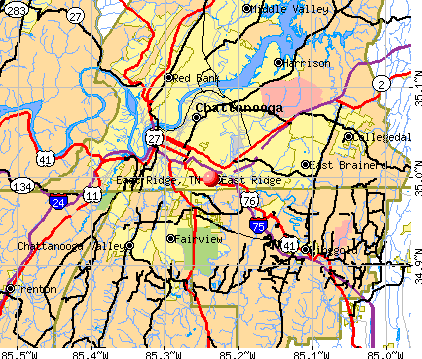


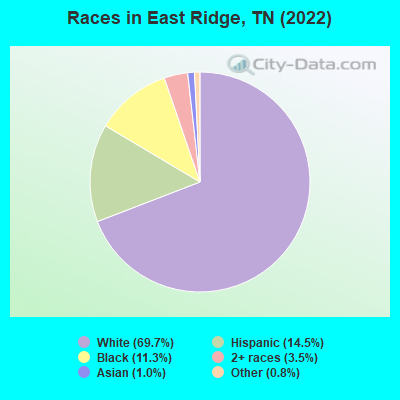
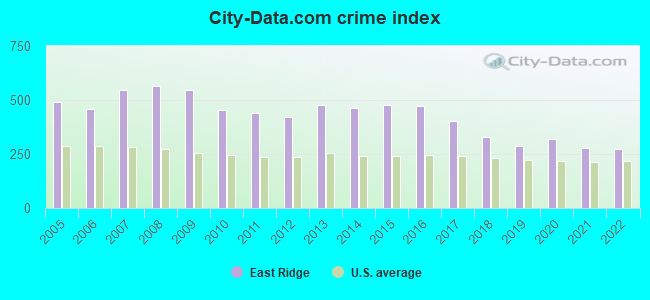
 Recent articles from our blog. Our writers, many of them Ph.D. graduates or candidates, create easy-to-read articles on a wide variety of topics.

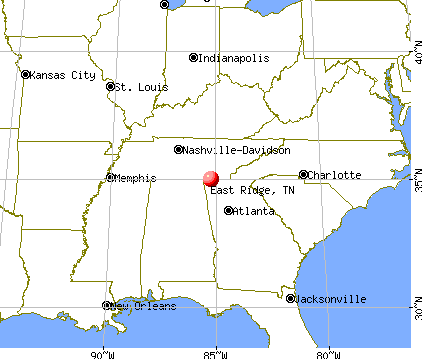
 (3.8 miles
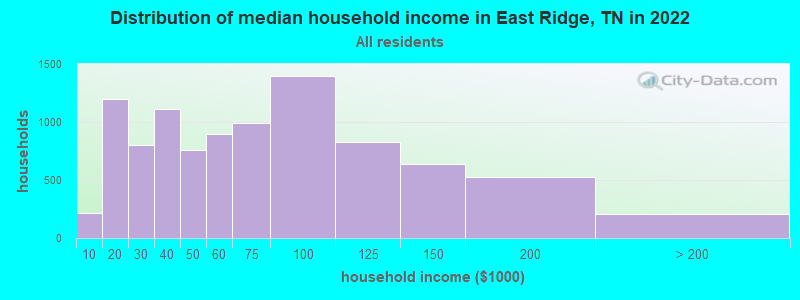
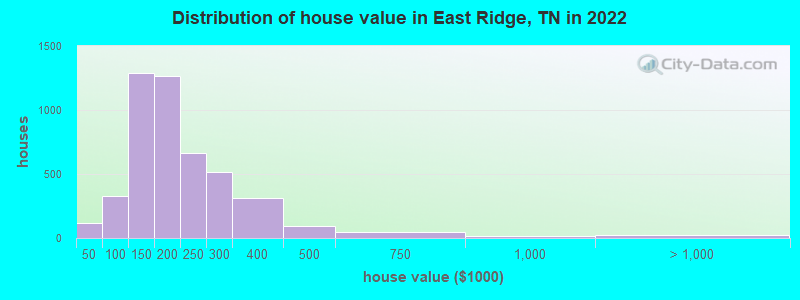

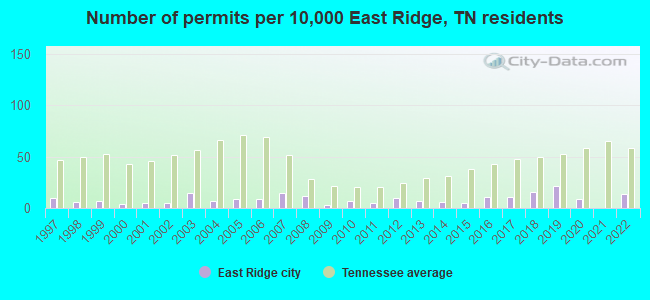
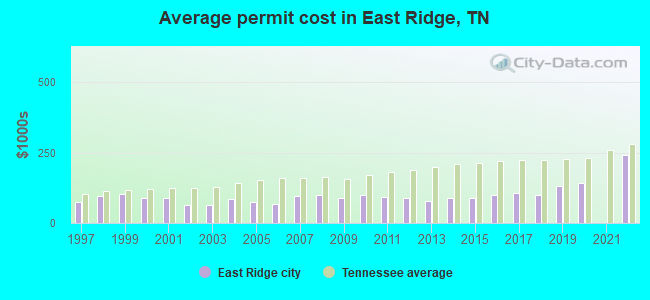
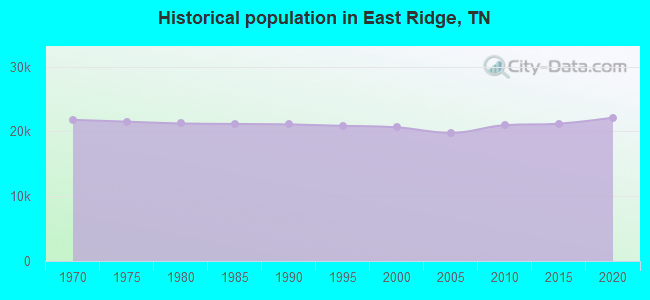
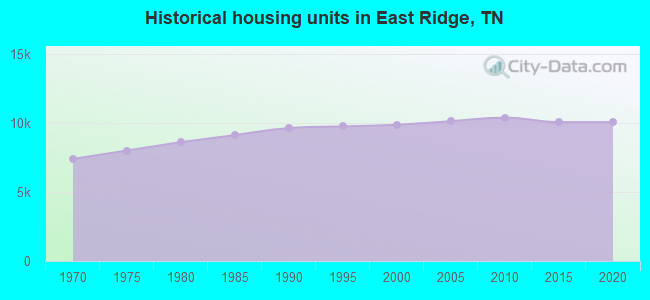
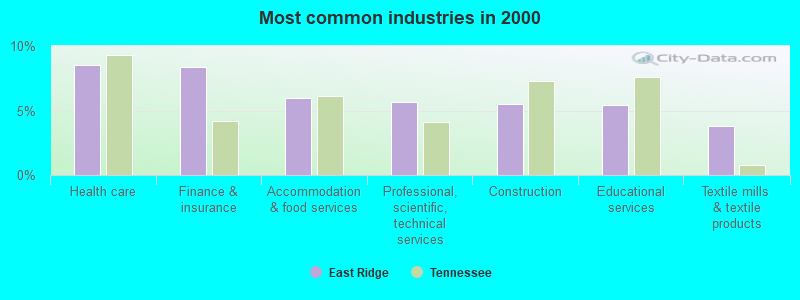
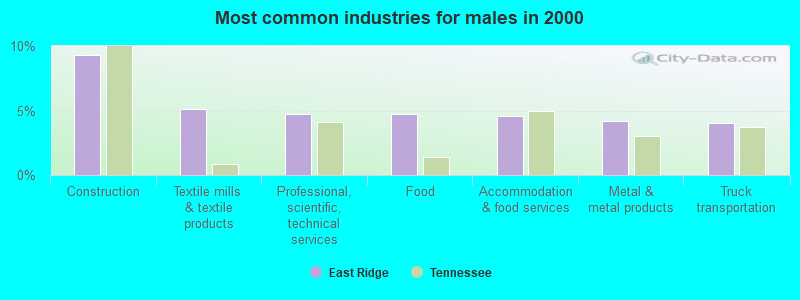
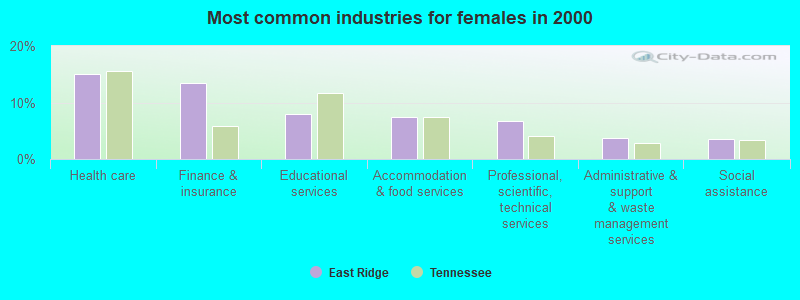
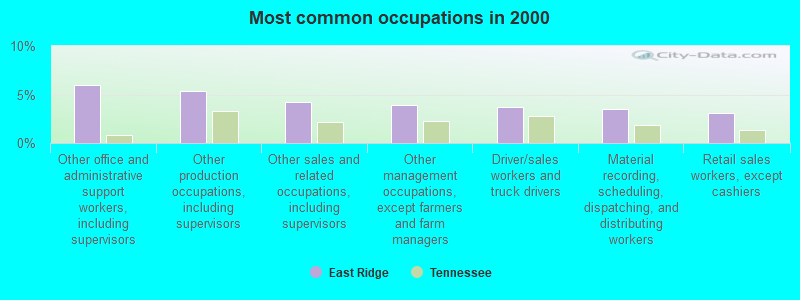
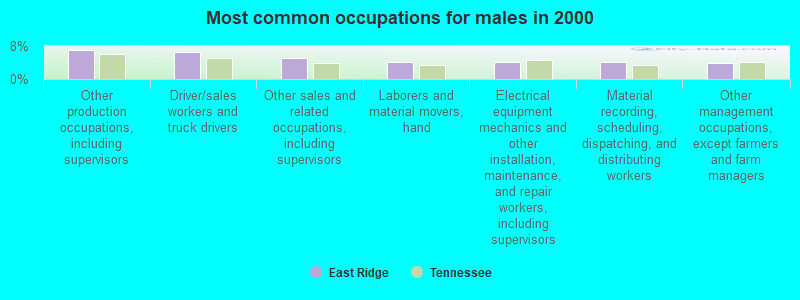
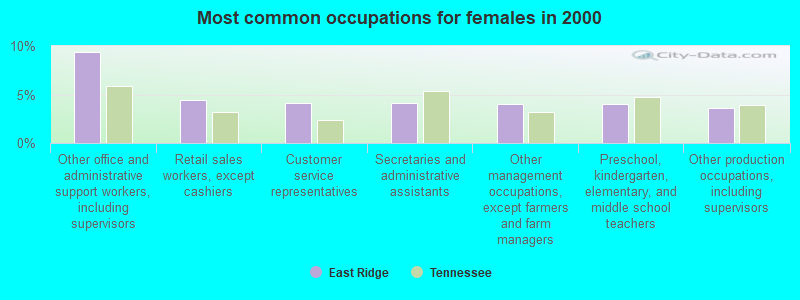
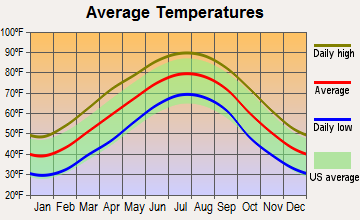
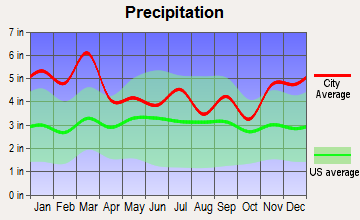
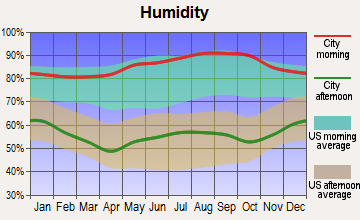
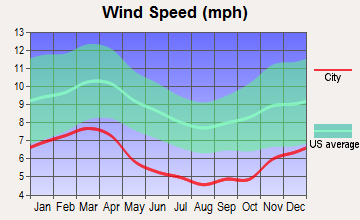
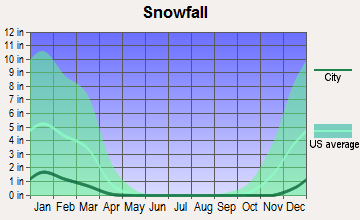
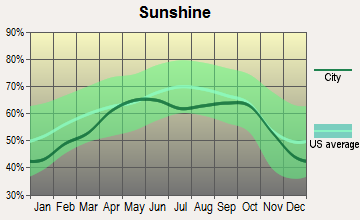
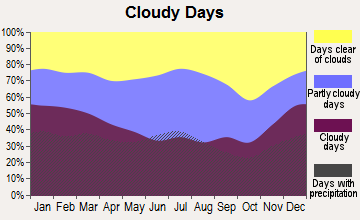


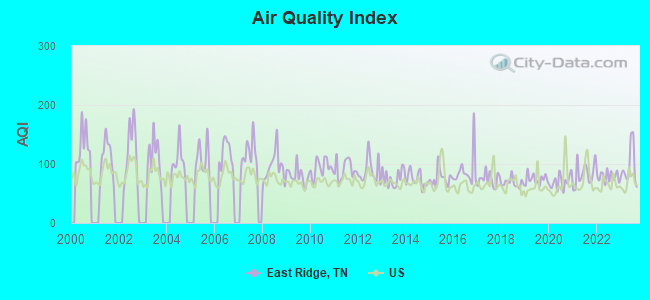
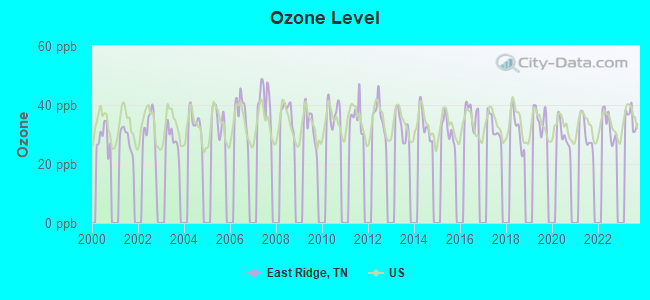
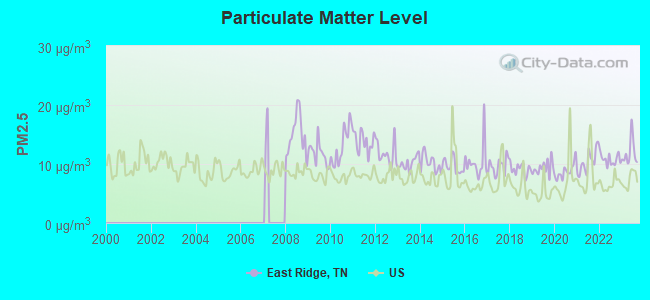

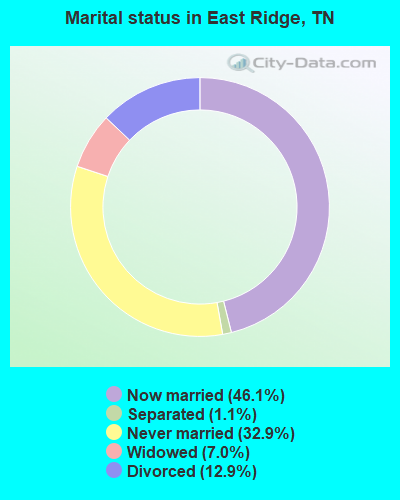
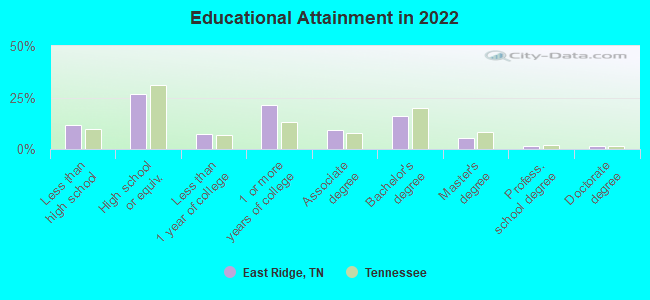
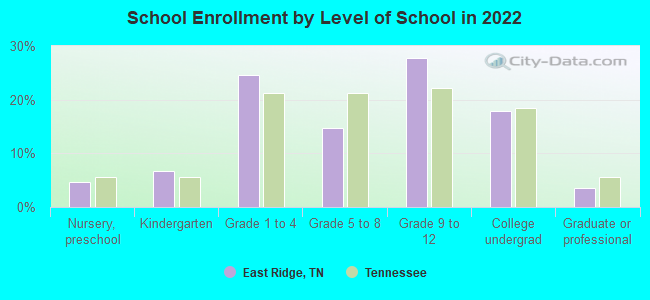
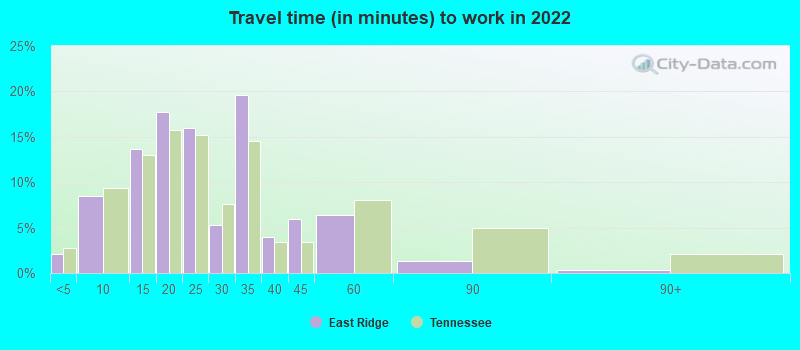
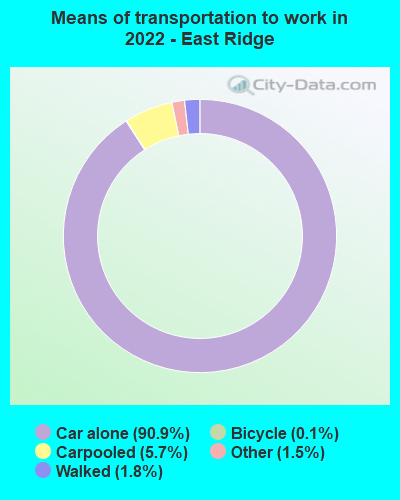
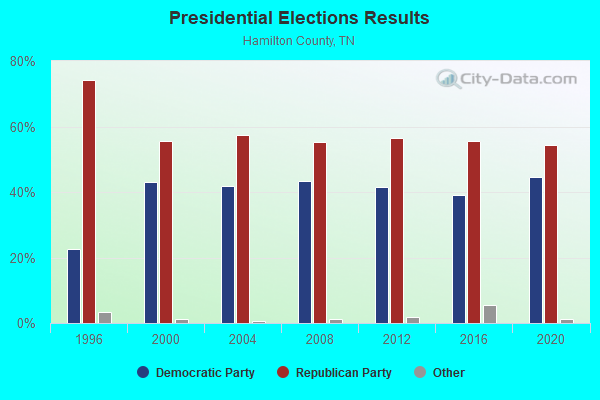
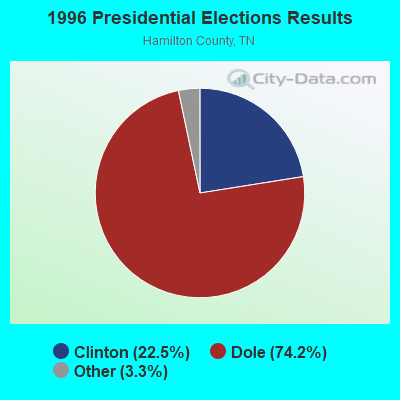

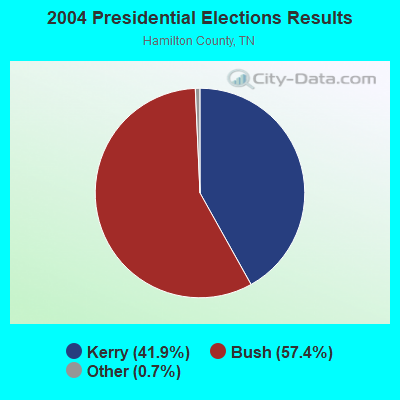

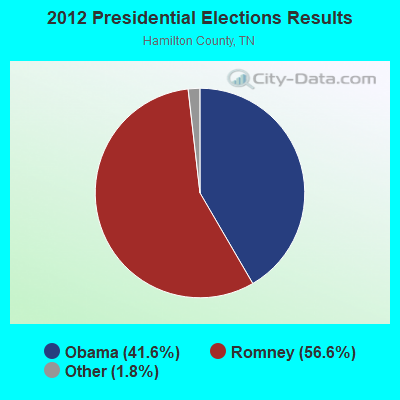
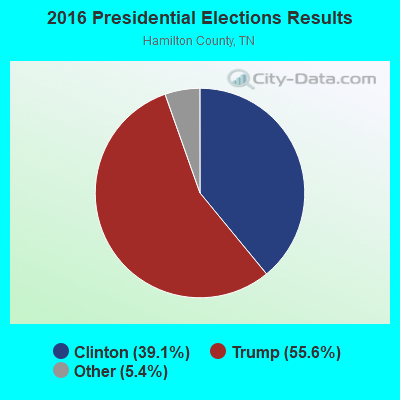
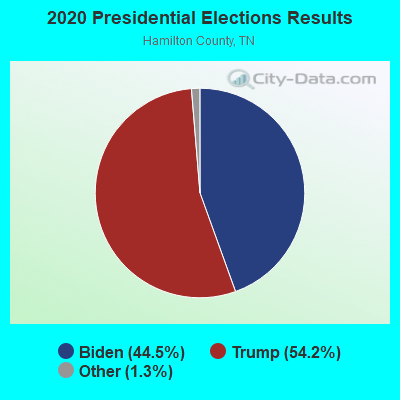
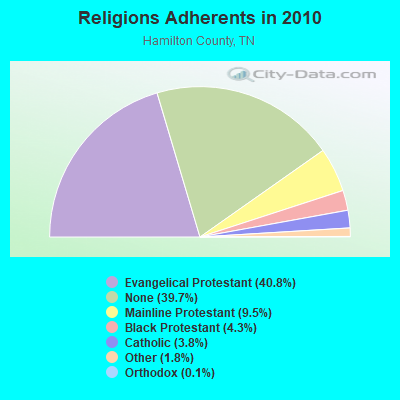
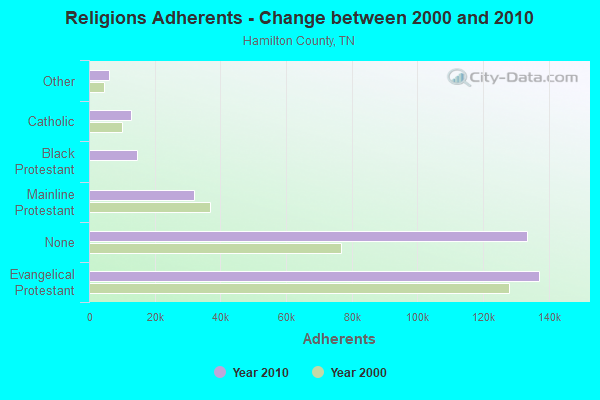
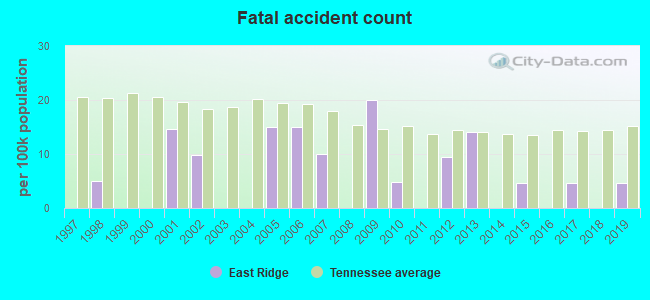

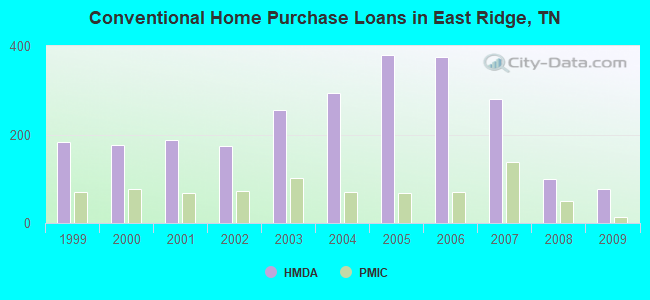
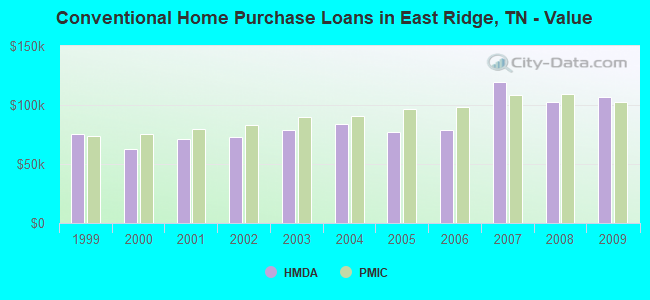
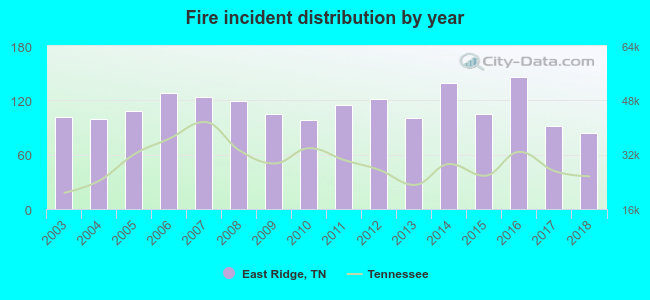 According to the data from the years 2003 - 2018 the average number of fires per year is 112. The highest number of reported fires - 146 took place in 2016, and the least - 84 in 2018. The data has a decreasing trend.
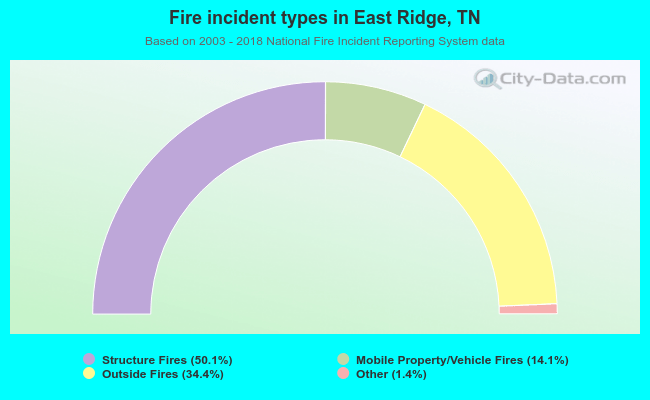 When looking into fire subcategories, the most incidents belonged to: Structure Fires (50.1%), and Outside Fires (34.4%).