Estimated zip code population in 2022: 22,242
Zip code population in 2010: 20,951
Zip code population in 2000: 20,574
Houses and condos: 10,603
Renter-occupied apartments: 3,865
% of renters here:
39%State:
33%
March 2022 cost of living index in zip code 37412: 88.6
(less than average, U.S. average is 100)
Land area: 8.7
sq. mi.
Water area: 0.0
sq. mi.
Population density: 2,546 people per square mile (average).
OSM Map
General Map
Google Map
MSN Map
OSM Map
General Map
Google Map
MSN Map
OSM Map
General Map
Google Map
MSN Map
OSM Map
General Map
Google Map
MSN Map
Please wait while loading the map...
Real estate property taxes paid for housing units in 2022:
This zip code:
0.8% ($1,532)Tennessee:
0.5% ($1,376)
Median real estate property taxes paid for housing units with mortgages in 2022: $1,495 (0.8%)
Median real estate property taxes paid for housing units with no mortgage in 2022: $1,653 (0.7%)
Profiles of local businesses
Business Search - 14 Million verified businesses
Males: 10,802 Females: 11,440
For population 25 years and over in 37412:
High school or higher: 86.0%Bachelor's degree or higher: 22.7%Graduate or professional degree: 7.0%Unemployed: 4.3%Mean travel time to work (commute): 19.1 minutes
For population 15 years and over in 37412:
Never married: 32.4%Now married: 45.2%Separated: 1.5%Widowed: 7.3%Divorced: 13.5%
Zip code 37412 compared to state average:
Hispanic race population percentage above state average. Foreign-born population percentage above state average. Length of stay since moving in significantly above state average. House age above state average. 15,657 70.4% White 2,983 13.4% Hispanic or Latino 2,605 11.7% Black 581 2.6% Two or more races 257 1.2% Asian 156 0.7% Some other race
Data:
Median household income ($)
Median household income (% change since 2000)
Household income diversity
Ratio of average income to average house value (%)
Ratio of average income to average rent
Median household income ($) - White
Median household income ($) - Black or African American
Median household income ($) - Asian
Median household income ($) - Hispanic or Latino
Median household income ($) - American Indian and Alaska Native
Median household income ($) - Multirace
Median household income ($) - Other Race
Median household income for houses/condos with a mortgage ($)
Median household income for apartments without a mortgage ($)
Races - White alone (%)
Races - White alone (% change since 2000)
Races - Black alone (%)
Races - Black alone (% change since 2000)
Races - American Indian alone (%)
Races - American Indian alone (% change since 2000)
Races - Asian alone (%)
Races - Asian alone (% change since 2000)
Races - Hispanic (%)
Races - Hispanic (% change since 2000)
Races - Native Hawaiian and Other Pacific Islander alone (%)
Races - Native Hawaiian and Other Pacific Islander alone (% change since 2000)
Races - Two or more races (%)
Races - Two or more races (% change since 2000)
Races - Other race alone (%)
Races - Other race alone (% change since 2000)
Racial diversity
Unemployment (%)
Unemployment (% change since 2000)
Unemployment (%) - White
Unemployment (%) - Black or African American
Unemployment (%) - Asian
Unemployment (%) - Hispanic or Latino
Unemployment (%) - American Indian and Alaska Native
Unemployment (%) - Multirace
Unemployment (%) - Other Race
Population density (people per square mile)
Population - Males (%)
Population - Females (%)
Population - Males (%) - White
Population - Males (%) - Black or African American
Population - Males (%) - Asian
Population - Males (%) - Hispanic or Latino
Population - Males (%) - American Indian and Alaska Native
Population - Males (%) - Multirace
Population - Males (%) - Other Race
Population - Females (%) - White
Population - Females (%) - Black or African American
Population - Females (%) - Asian
Population - Females (%) - Hispanic or Latino
Population - Females (%) - American Indian and Alaska Native
Population - Females (%) - Multirace
Population - Females (%) - Other Race
Coronavirus confirmed cases (May 28, 2024)
Deaths caused by coronavirus (May 28, 2024)
Coronavirus confirmed cases (per 100k population) (May 28, 2024)
Deaths caused by coronavirus (per 100k population) (May 28, 2024)
Daily increase in number of cases (May 28, 2024)
Weekly increase in number of cases (May 28, 2024)
Cases doubled (in days) (May 28, 2024)
Hospitalized patients (Apr 18, 2022)
Negative test results (Apr 18, 2022)
Total test results (Apr 18, 2022)
COVID Vaccine doses distributed (per 100k population) (Sep 19, 2023)
COVID Vaccine doses administered (per 100k population) (Sep 19, 2023)
COVID Vaccine doses distributed (Sep 19, 2023)
COVID Vaccine doses administered (Sep 19, 2023)
Likely homosexual households (%)
Likely homosexual households (% change since 2000)
Likely homosexual households - Lesbian couples (%)
Likely homosexual households - Lesbian couples (% change since 2000)
Likely homosexual households - Gay men (%)
Likely homosexual households - Gay men (% change since 2000)
Cost of living index
Median gross rent ($)
Median contract rent ($)
Median monthly housing costs ($)
Median house or condo value ($)
Median house or condo value ($ change since 2000)
Mean house or condo value by units in structure - 1, detached ($)
Mean house or condo value by units in structure - 1, attached ($)
Mean house or condo value by units in structure - 2 ($)
Mean house or condo value by units in structure by units in structure - 3 or 4 ($)
Mean house or condo value by units in structure - 5 or more ($)
Mean house or condo value by units in structure - Boat, RV, van, etc. ($)
Mean house or condo value by units in structure - Mobile home ($)
Median house or condo value ($) - White
Median house or condo value ($) - Black or African American
Median house or condo value ($) - Asian
Median house or condo value ($) - Hispanic or Latino
Median house or condo value ($) - American Indian and Alaska Native
Median house or condo value ($) - Multirace
Median house or condo value ($) - Other Race
Median resident age
Resident age diversity
Median resident age - Males
Median resident age - Females
Median resident age - White
Median resident age - Black or African American
Median resident age - Asian
Median resident age - Hispanic or Latino
Median resident age - American Indian and Alaska Native
Median resident age - Multirace
Median resident age - Other Race
Median resident age - Males - White
Median resident age - Males - Black or African American
Median resident age - Males - Asian
Median resident age - Males - Hispanic or Latino
Median resident age - Males - American Indian and Alaska Native
Median resident age - Males - Multirace
Median resident age - Males - Other Race
Median resident age - Females - White
Median resident age - Females - Black or African American
Median resident age - Females - Asian
Median resident age - Females - Hispanic or Latino
Median resident age - Females - American Indian and Alaska Native
Median resident age - Females - Multirace
Median resident age - Females - Other Race
Commute - mean travel time to work (minutes)
Travel time to work - Less than 5 minutes (%)
Travel time to work - Less than 5 minutes (% change since 2000)
Travel time to work - 5 to 9 minutes (%)
Travel time to work - 5 to 9 minutes (% change since 2000)
Travel time to work - 10 to 19 minutes (%)
Travel time to work - 10 to 19 minutes (% change since 2000)
Travel time to work - 20 to 29 minutes (%)
Travel time to work - 20 to 29 minutes (% change since 2000)
Travel time to work - 30 to 39 minutes (%)
Travel time to work - 30 to 39 minutes (% change since 2000)
Travel time to work - 40 to 59 minutes (%)
Travel time to work - 40 to 59 minutes (% change since 2000)
Travel time to work - 60 to 89 minutes (%)
Travel time to work - 60 to 89 minutes (% change since 2000)
Travel time to work - 90 or more minutes (%)
Travel time to work - 90 or more minutes (% change since 2000)
Marital status - Never married (%)
Marital status - Now married (%)
Marital status - Separated (%)
Marital status - Widowed (%)
Marital status - Divorced (%)
Median family income ($)
Median family income (% change since 2000)
Median non-family income ($)
Median non-family income (% change since 2000)
Median per capita income ($)
Median per capita income (% change since 2000)
Median family income ($) - White
Median family income ($) - Black or African American
Median family income ($) - Asian
Median family income ($) - Hispanic or Latino
Median family income ($) - American Indian and Alaska Native
Median family income ($) - Multirace
Median family income ($) - Other Race
Median year house/condo built
Median year apartment built
Year house built - Built 2005 or later (%)
Year house built - Built 2000 to 2004 (%)
Year house built - Built 1990 to 1999 (%)
Year house built - Built 1980 to 1989 (%)
Year house built - Built 1970 to 1979 (%)
Year house built - Built 1960 to 1969 (%)
Year house built - Built 1950 to 1959 (%)
Year house built - Built 1940 to 1949 (%)
Year house built - Built 1939 or earlier (%)
Average household size
Household density (households per square mile)
Average household size - White
Average household size - Black or African American
Average household size - Asian
Average household size - Hispanic or Latino
Average household size - American Indian and Alaska Native
Average household size - Multirace
Average household size - Other Race
Occupied housing units (%)
Vacant housing units (%)
Owner occupied housing units (%)
Renter occupied housing units (%)
Vacancy status - For rent (%)
Vacancy status - For sale only (%)
Vacancy status - Rented or sold, not occupied (%)
Vacancy status - For seasonal, recreational, or occasional use (%)
Vacancy status - For migrant workers (%)
Vacancy status - Other vacant (%)
Residents with income below the poverty level (%)
Residents with income below 50% of the poverty level (%)
Children below poverty level (%)
Poor families by family type - Married-couple family (%)
Poor families by family type - Male, no wife present (%)
Poor families by family type - Female, no husband present (%)
Poverty status for native-born residents (%)
Poverty status for foreign-born residents (%)
Poverty among high school graduates not in families (%)
Poverty among people who did not graduate high school not in families (%)
Residents with income below the poverty level (%) - White
Residents with income below the poverty level (%) - Black or African American
Residents with income below the poverty level (%) - Asian
Residents with income below the poverty level (%) - Hispanic or Latino
Residents with income below the poverty level (%) - American Indian and Alaska Native
Residents with income below the poverty level (%) - Multirace
Residents with income below the poverty level (%) - Other Race
Air pollution - Air Quality Index (AQI)
Air pollution - CO
Air pollution - NO2
Air pollution - SO2
Air pollution - Ozone
Air pollution - PM10
Air pollution - PM25
Air pollution - Pb
Crime - Murders per 100,000 population
Crime - Rapes per 100,000 population
Crime - Robberies per 100,000 population
Crime - Assaults per 100,000 population
Crime - Burglaries per 100,000 population
Crime - Thefts per 100,000 population
Crime - Auto thefts per 100,000 population
Crime - Arson per 100,000 population
Crime - City-data.com crime index
Crime - Violent crime index
Crime - Property crime index
Crime - Murders per 100,000 population (5 year average)
Crime - Rapes per 100,000 population (5 year average)
Crime - Robberies per 100,000 population (5 year average)
Crime - Assaults per 100,000 population (5 year average)
Crime - Burglaries per 100,000 population (5 year average)
Crime - Thefts per 100,000 population (5 year average)
Crime - Auto thefts per 100,000 population (5 year average)
Crime - Arson per 100,000 population (5 year average)
Crime - City-data.com crime index (5 year average)
Crime - Violent crime index (5 year average)
Crime - Property crime index (5 year average)
1996 Presidential Elections Results (%) - Democratic Party (Clinton)
1996 Presidential Elections Results (%) - Republican Party (Dole)
1996 Presidential Elections Results (%) - Other
2000 Presidential Elections Results (%) - Democratic Party (Gore)
2000 Presidential Elections Results (%) - Republican Party (Bush)
2000 Presidential Elections Results (%) - Other
2004 Presidential Elections Results (%) - Democratic Party (Kerry)
2004 Presidential Elections Results (%) - Republican Party (Bush)
2004 Presidential Elections Results (%) - Other
2008 Presidential Elections Results (%) - Democratic Party (Obama)
2008 Presidential Elections Results (%) - Republican Party (McCain)
2008 Presidential Elections Results (%) - Other
2012 Presidential Elections Results (%) - Democratic Party (Obama)
2012 Presidential Elections Results (%) - Republican Party (Romney)
2012 Presidential Elections Results (%) - Other
2016 Presidential Elections Results (%) - Democratic Party (Clinton)
2016 Presidential Elections Results (%) - Republican Party (Trump)
2016 Presidential Elections Results (%) - Other
2020 Presidential Elections Results (%) - Democratic Party (Biden)
2020 Presidential Elections Results (%) - Republican Party (Trump)
2020 Presidential Elections Results (%) - Other
Ancestries Reported - Arab (%)
Ancestries Reported - Czech (%)
Ancestries Reported - Danish (%)
Ancestries Reported - Dutch (%)
Ancestries Reported - English (%)
Ancestries Reported - French (%)
Ancestries Reported - French Canadian (%)
Ancestries Reported - German (%)
Ancestries Reported - Greek (%)
Ancestries Reported - Hungarian (%)
Ancestries Reported - Irish (%)
Ancestries Reported - Italian (%)
Ancestries Reported - Lithuanian (%)
Ancestries Reported - Norwegian (%)
Ancestries Reported - Polish (%)
Ancestries Reported - Portuguese (%)
Ancestries Reported - Russian (%)
Ancestries Reported - Scotch-Irish (%)
Ancestries Reported - Scottish (%)
Ancestries Reported - Slovak (%)
Ancestries Reported - Subsaharan African (%)
Ancestries Reported - Swedish (%)
Ancestries Reported - Swiss (%)
Ancestries Reported - Ukrainian (%)
Ancestries Reported - United States (%)
Ancestries Reported - Welsh (%)
Ancestries Reported - West Indian (%)
Ancestries Reported - Other (%)
Educational Attainment - No schooling completed (%)
Educational Attainment - Less than high school (%)
Educational Attainment - High school or equivalent (%)
Educational Attainment - Less than 1 year of college (%)
Educational Attainment - 1 or more years of college (%)
Educational Attainment - Associate degree (%)
Educational Attainment - Bachelor's degree (%)
Educational Attainment - Master's degree (%)
Educational Attainment - Professional school degree (%)
Educational Attainment - Doctorate degree (%)
School Enrollment - Nursery, preschool (%)
School Enrollment - Kindergarten (%)
School Enrollment - Grade 1 to 4 (%)
School Enrollment - Grade 5 to 8 (%)
School Enrollment - Grade 9 to 12 (%)
School Enrollment - College undergrad (%)
School Enrollment - Graduate or professional (%)
School Enrollment - Not enrolled in school (%)
School enrollment - Public schools (%)
School enrollment - Private schools (%)
School enrollment - Not enrolled (%)
Median number of rooms in houses and condos
Median number of rooms in apartments
Housing units lacking complete plumbing facilities (%)
Housing units lacking complete kitchen facilities (%)
Density of houses
Urban houses (%)
Rural houses (%)
Households with people 60 years and over (%)
Households with people 65 years and over (%)
Households with people 75 years and over (%)
Households with one or more nonrelatives (%)
Households with no nonrelatives (%)
Population in households (%)
Family households (%)
Nonfamily households (%)
Population in families (%)
Family households with own children (%)
Median number of bedrooms in owner occupied houses
Mean number of bedrooms in owner occupied houses
Median number of bedrooms in renter occupied houses
Mean number of bedrooms in renter occupied houses
Median number of vehichles in owner occupied houses
Mean number of vehichles in owner occupied houses
Median number of vehichles in renter occupied houses
Mean number of vehichles in renter occupied houses
Mortgage status - with mortgage (%)
Mortgage status - with second mortgage (%)
Mortgage status - with home equity loan (%)
Mortgage status - with both second mortgage and home equity loan (%)
Mortgage status - without a mortgage (%)
Average family size
Average family size - White
Average family size - Black or African American
Average family size - Asian
Average family size - Hispanic or Latino
Average family size - American Indian and Alaska Native
Average family size - Multirace
Average family size - Other Race
Geographical mobility - Same house 1 year ago (%)
Geographical mobility - Moved within same county (%)
Geographical mobility - Moved from different county within same state (%)
Geographical mobility - Moved from different state (%)
Geographical mobility - Moved from abroad (%)
Place of birth - Born in state of residence (%)
Place of birth - Born in other state (%)
Place of birth - Native, outside of US (%)
Place of birth - Foreign born (%)
Housing units in structures - 1, detached (%)
Housing units in structures - 1, attached (%)
Housing units in structures - 2 (%)
Housing units in structures - 3 or 4 (%)
Housing units in structures - 5 to 9 (%)
Housing units in structures - 10 to 19 (%)
Housing units in structures - 20 to 49 (%)
Housing units in structures - 50 or more (%)
Housing units in structures - Mobile home (%)
Housing units in structures - Boat, RV, van, etc. (%)
House/condo owner moved in on average (years ago)
Renter moved in on average (years ago)
Year householder moved into unit - Moved in 1999 to March 2000 (%)
Year householder moved into unit - Moved in 1995 to 1998 (%)
Year householder moved into unit - Moved in 1990 to 1994 (%)
Year householder moved into unit - Moved in 1980 to 1989 (%)
Year householder moved into unit - Moved in 1970 to 1979 (%)
Year householder moved into unit - Moved in 1969 or earlier (%)
Means of transportation to work - Drove car alone (%)
Means of transportation to work - Carpooled (%)
Means of transportation to work - Public transportation (%)
Means of transportation to work - Bus or trolley bus (%)
Means of transportation to work - Streetcar or trolley car (%)
Means of transportation to work - Subway or elevated (%)
Means of transportation to work - Railroad (%)
Means of transportation to work - Ferryboat (%)
Means of transportation to work - Taxicab (%)
Means of transportation to work - Motorcycle (%)
Means of transportation to work - Bicycle (%)
Means of transportation to work - Walked (%)
Means of transportation to work - Other means (%)
Working at home (%)
Industry diversity
Most Common Industries - Agriculture, forestry, fishing and hunting, and mining (%)
Most Common Industries - Agriculture, forestry, fishing and hunting (%)
Most Common Industries - Mining, quarrying, and oil and gas extraction (%)
Most Common Industries - Construction (%)
Most Common Industries - Manufacturing (%)
Most Common Industries - Wholesale trade (%)
Most Common Industries - Retail trade (%)
Most Common Industries - Transportation and warehousing, and utilities (%)
Most Common Industries - Transportation and warehousing (%)
Most Common Industries - Utilities (%)
Most Common Industries - Information (%)
Most Common Industries - Finance and insurance, and real estate and rental and leasing (%)
Most Common Industries - Finance and insurance (%)
Most Common Industries - Real estate and rental and leasing (%)
Most Common Industries - Professional, scientific, and management, and administrative and waste management services (%)
Most Common Industries - Professional, scientific, and technical services (%)
Most Common Industries - Management of companies and enterprises (%)
Most Common Industries - Administrative and support and waste management services (%)
Most Common Industries - Educational services, and health care and social assistance (%)
Most Common Industries - Educational services (%)
Most Common Industries - Health care and social assistance (%)
Most Common Industries - Arts, entertainment, and recreation, and accommodation and food services (%)
Most Common Industries - Arts, entertainment, and recreation (%)
Most Common Industries - Accommodation and food services (%)
Most Common Industries - Other services, except public administration (%)
Most Common Industries - Public administration (%)
Occupation diversity
Most Common Occupations - Management, business, science, and arts occupations (%)
Most Common Occupations - Management, business, and financial occupations (%)
Most Common Occupations - Management occupations (%)
Most Common Occupations - Business and financial operations occupations (%)
Most Common Occupations - Computer, engineering, and science occupations (%)
Most Common Occupations - Computer and mathematical occupations (%)
Most Common Occupations - Architecture and engineering occupations (%)
Most Common Occupations - Life, physical, and social science occupations (%)
Most Common Occupations - Education, legal, community service, arts, and media occupations (%)
Most Common Occupations - Community and social service occupations (%)
Most Common Occupations - Legal occupations (%)
Most Common Occupations - Education, training, and library occupations (%)
Most Common Occupations - Arts, design, entertainment, sports, and media occupations (%)
Most Common Occupations - Healthcare practitioners and technical occupations (%)
Most Common Occupations - Health diagnosing and treating practitioners and other technical occupations (%)
Most Common Occupations - Health technologists and technicians (%)
Most Common Occupations - Service occupations (%)
Most Common Occupations - Healthcare support occupations (%)
Most Common Occupations - Protective service occupations (%)
Most Common Occupations - Fire fighting and prevention, and other protective service workers including supervisors (%)
Most Common Occupations - Law enforcement workers including supervisors (%)
Most Common Occupations - Food preparation and serving related occupations (%)
Most Common Occupations - Building and grounds cleaning and maintenance occupations (%)
Most Common Occupations - Personal care and service occupations (%)
Most Common Occupations - Sales and office occupations (%)
Most Common Occupations - Sales and related occupations (%)
Most Common Occupations - Office and administrative support occupations (%)
Most Common Occupations - Natural resources, construction, and maintenance occupations (%)
Most Common Occupations - Farming, fishing, and forestry occupations (%)
Most Common Occupations - Construction and extraction occupations (%)
Most Common Occupations - Installation, maintenance, and repair occupations (%)
Most Common Occupations - Production, transportation, and material moving occupations (%)
Most Common Occupations - Production occupations (%)
Most Common Occupations - Transportation occupations (%)
Most Common Occupations - Material moving occupations (%)
People in Group quarters - Institutionalized population (%)
People in Group quarters - Correctional institutions (%)
People in Group quarters - Federal prisons and detention centers (%)
People in Group quarters - Halfway houses (%)
People in Group quarters - Local jails and other confinement facilities (including police lockups) (%)
People in Group quarters - Military disciplinary barracks (%)
People in Group quarters - State prisons (%)
People in Group quarters - Other types of correctional institutions (%)
People in Group quarters - Nursing homes (%)
People in Group quarters - Hospitals/wards, hospices, and schools for the handicapped (%)
People in Group quarters - Hospitals/wards and hospices for chronically ill (%)
People in Group quarters - Hospices or homes for chronically ill (%)
People in Group quarters - Military hospitals or wards for chronically ill (%)
People in Group quarters - Other hospitals or wards for chronically ill (%)
People in Group quarters - Hospitals or wards for drug/alcohol abuse (%)
People in Group quarters - Mental (Psychiatric) hospitals or wards (%)
People in Group quarters - Schools, hospitals, or wards for the mentally retarded (%)
People in Group quarters - Schools, hospitals, or wards for the physically handicapped (%)
People in Group quarters - Institutions for the deaf (%)
People in Group quarters - Institutions for the blind (%)
People in Group quarters - Orthopedic wards and institutions for the physically handicapped (%)
People in Group quarters - Wards in general hospitals for patients who have no usual home elsewhere (%)
People in Group quarters - Wards in military hospitals for patients who have no usual home elsewhere (%)
People in Group quarters - Juvenile institutions (%)
People in Group quarters - Long-term care (%)
People in Group quarters - Homes for abused, dependent, and neglected children (%)
People in Group quarters - Residential treatment centers for emotionally disturbed children (%)
People in Group quarters - Training schools for juvenile delinquents (%)
People in Group quarters - Short-term care, detention or diagnostic centers for delinquent children (%)
People in Group quarters - Type of juvenile institution unknown (%)
People in Group quarters - Noninstitutionalized population (%)
People in Group quarters - College dormitories (includes college quarters off campus) (%)
People in Group quarters - Military quarters (%)
People in Group quarters - On base (%)
People in Group quarters - Barracks, unaccompanied personnel housing (UPH), (Enlisted/Officer), ;and similar group living quarters for military personnel (%)
People in Group quarters - Transient quarters for temporary residents (%)
People in Group quarters - Military ships (%)
People in Group quarters - Group homes (%)
People in Group quarters - Homes or halfway houses for drug/alcohol abuse (%)
People in Group quarters - Homes for the mentally ill (%)
People in Group quarters - Homes for the mentally retarded (%)
People in Group quarters - Homes for the physically handicapped (%)
People in Group quarters - Other group homes (%)
People in Group quarters - Religious group quarters (%)
People in Group quarters - Dormitories (%)
People in Group quarters - Agriculture workers' dormitories on farms (%)
People in Group quarters - Job Corps and vocational training facilities (%)
People in Group quarters - Other workers' dormitories (%)
People in Group quarters - Crews of maritime vessels (%)
People in Group quarters - Other nonhousehold living situations (%)
People in Group quarters - Other noninstitutional group quarters (%)
Residents speaking English at home (%)
Residents speaking English at home - Born in the United States (%)
Residents speaking English at home - Native, born elsewhere (%)
Residents speaking English at home - Foreign born (%)
Residents speaking Spanish at home (%)
Residents speaking Spanish at home - Born in the United States (%)
Residents speaking Spanish at home - Native, born elsewhere (%)
Residents speaking Spanish at home - Foreign born (%)
Residents speaking other language at home (%)
Residents speaking other language at home - Born in the United States (%)
Residents speaking other language at home - Native, born elsewhere (%)
Residents speaking other language at home - Foreign born (%)
Class of Workers - Employee of private company (%)
Class of Workers - Self-employed in own incorporated business (%)
Class of Workers - Private not-for-profit wage and salary workers (%)
Class of Workers - Local government workers (%)
Class of Workers - State government workers (%)
Class of Workers - Federal government workers (%)
Class of Workers - Self-employed workers in own not incorporated business and Unpaid family workers (%)
House heating fuel used in houses and condos - Utility gas (%)
House heating fuel used in houses and condos - Bottled, tank, or LP gas (%)
House heating fuel used in houses and condos - Electricity (%)
House heating fuel used in houses and condos - Fuel oil, kerosene, etc. (%)
House heating fuel used in houses and condos - Coal or coke (%)
House heating fuel used in houses and condos - Wood (%)
House heating fuel used in houses and condos - Solar energy (%)
House heating fuel used in houses and condos - Other fuel (%)
House heating fuel used in houses and condos - No fuel used (%)
House heating fuel used in apartments - Utility gas (%)
House heating fuel used in apartments - Bottled, tank, or LP gas (%)
House heating fuel used in apartments - Electricity (%)
House heating fuel used in apartments - Fuel oil, kerosene, etc. (%)
House heating fuel used in apartments - Coal or coke (%)
House heating fuel used in apartments - Wood (%)
House heating fuel used in apartments - Solar energy (%)
House heating fuel used in apartments - Other fuel (%)
House heating fuel used in apartments - No fuel used (%)
Armed forces status - In Armed Forces (%)
Armed forces status - Civilian (%)
Armed forces status - Civilian - Veteran (%)
Armed forces status - Civilian - Nonveteran (%)
Fatal accidents locations in years 2005-2021
Fatal accidents locations in 2005
Fatal accidents locations in 2006
Fatal accidents locations in 2007
Fatal accidents locations in 2008
Fatal accidents locations in 2009
Fatal accidents locations in 2010
Fatal accidents locations in 2011
Fatal accidents locations in 2012
Fatal accidents locations in 2013
Fatal accidents locations in 2014
Fatal accidents locations in 2015
Fatal accidents locations in 2016
Fatal accidents locations in 2017
Fatal accidents locations in 2018
Fatal accidents locations in 2019
Fatal accidents locations in 2020
Fatal accidents locations in 2021
Alcohol use - People drinking some alcohol every month (%)
Alcohol use - People not drinking at all (%)
Alcohol use - Average days/month drinking alcohol
Alcohol use - Average drinks/week
Alcohol use - Average days/year people drink much
Audiometry - Average condition of hearing (%)
Audiometry - People that can hear a whisper from across a quiet room (%)
Audiometry - People that can hear normal voice from across a quiet room (%)
Audiometry - Ears ringing, roaring, buzzing (%)
Audiometry - Had a job exposure to loud noise (%)
Audiometry - Had off-work exposure to loud noise (%)
Blood Pressure & Cholesterol - Has high blood pressure (%)
Blood Pressure & Cholesterol - Checking blood pressure at home (%)
Blood Pressure & Cholesterol - Frequently checking blood cholesterol (%)
Blood Pressure & Cholesterol - Has high cholesterol level (%)
Consumer Behavior - Money monthly spent on food at supermarket/grocery store
Consumer Behavior - Money monthly spent on food at other stores
Consumer Behavior - Money monthly spent on eating out
Consumer Behavior - Money monthly spent on carryout/delivered foods
Consumer Behavior - Income spent on food at supermarket/grocery store (%)
Consumer Behavior - Income spent on food at other stores (%)
Consumer Behavior - Income spent on eating out (%)
Consumer Behavior - Income spent on carryout/delivered foods (%)
Current Health Status - General health condition (%)
Current Health Status - Blood donors (%)
Current Health Status - Has blood ever tested for HIV virus (%)
Current Health Status - Left-handed people (%)
Dermatology - People using sunscreen (%)
Diabetes - Diabetics (%)
Diabetes - Had a blood test for high blood sugar (%)
Diabetes - People taking insulin (%)
Diet Behavior & Nutrition - Diet health (%)
Diet Behavior & Nutrition - Milk product consumption (# of products/month)
Diet Behavior & Nutrition - Meals not home prepared (#/week)
Diet Behavior & Nutrition - Meals from fast food or pizza place (#/week)
Diet Behavior & Nutrition - Ready-to-eat foods (#/month)
Diet Behavior & Nutrition - Frozen meals/pizza (#/month)
Drug Use - People that ever used marijuana or hashish (%)
Drug Use - Ever used hard drugs (%)
Drug Use - Ever used any form of cocaine (%)
Drug Use - Ever used heroin (%)
Drug Use - Ever used methamphetamine (%)
Health Insurance - People covered by health insurance (%)
Kidney Conditions-Urology - Avg. # of times urinating at night
Medical Conditions - People with asthma (%)
Medical Conditions - People with anemia (%)
Medical Conditions - People with psoriasis (%)
Medical Conditions - People with overweight (%)
Medical Conditions - Elderly people having difficulties in thinking or remembering (%)
Medical Conditions - People who ever received blood transfusion (%)
Medical Conditions - People having trouble seeing even with glass/contacts (%)
Medical Conditions - People with arthritis (%)
Medical Conditions - People with gout (%)
Medical Conditions - People with congestive heart failure (%)
Medical Conditions - People with coronary heart disease (%)
Medical Conditions - People with angina pectoris (%)
Medical Conditions - People who ever had heart attack (%)
Medical Conditions - People who ever had stroke (%)
Medical Conditions - People with emphysema (%)
Medical Conditions - People with thyroid problem (%)
Medical Conditions - People with chronic bronchitis (%)
Medical Conditions - People with any liver condition (%)
Medical Conditions - People who ever had cancer or malignancy (%)
Mental Health - People who have little interest in doing things (%)
Mental Health - People feeling down, depressed, or hopeless (%)
Mental Health - People who have trouble sleeping or sleeping too much (%)
Mental Health - People feeling tired or having little energy (%)
Mental Health - People with poor appetite or overeating (%)
Mental Health - People feeling bad about themself (%)
Mental Health - People who have trouble concentrating on things (%)
Mental Health - People moving or speaking slowly or too fast (%)
Mental Health - People having thoughts they would be better off dead (%)
Oral Health - Average years since last visit a dentist
Oral Health - People embarrassed because of mouth (%)
Oral Health - People with gum disease (%)
Oral Health - General health of teeth and gums (%)
Oral Health - Average days a week using dental floss/device
Oral Health - Average days a week using mouthwash for dental problem
Oral Health - Average number of teeth
Pesticide Use - Households using pesticides to control insects (%)
Pesticide Use - Households using pesticides to kill weeds (%)
Physical Activity - People doing vigorous-intensity work activities (%)
Physical Activity - People doing moderate-intensity work activities (%)
Physical Activity - People walking or bicycling (%)
Physical Activity - People doing vigorous-intensity recreational activities (%)
Physical Activity - People doing moderate-intensity recreational activities (%)
Physical Activity - Average hours a day doing sedentary activities
Physical Activity - Average hours a day watching TV or videos
Physical Activity - Average hours a day using computer
Physical Functioning - People having limitations keeping them from working (%)
Physical Functioning - People limited in amount of work they can do (%)
Physical Functioning - People that need special equipment to walk (%)
Physical Functioning - People experiencing confusion/memory problems (%)
Physical Functioning - People requiring special healthcare equipment (%)
Prescription Medications - Average number of prescription medicines taking
Preventive Aspirin Use - Adults 40+ taking low-dose aspirin (%)
Reproductive Health - Vaginal deliveries (%)
Reproductive Health - Cesarean deliveries (%)
Reproductive Health - Deliveries resulted in a live birth (%)
Reproductive Health - Pregnancies resulted in a delivery (%)
Reproductive Health - Women breastfeeding newborns (%)
Reproductive Health - Women that had a hysterectomy (%)
Reproductive Health - Women that had both ovaries removed (%)
Reproductive Health - Women that have ever taken birth control pills (%)
Reproductive Health - Women taking birth control pills (%)
Reproductive Health - Women that have ever used Depo-Provera or injectables (%)
Reproductive Health - Women that have ever used female hormones (%)
Sexual Behavior - People 18+ that ever had sex (vaginal, anal, or oral) (%)
Sexual Behavior - Males 18+ that ever had vaginal sex with a woman (%)
Sexual Behavior - Males 18+ that ever performed oral sex on a woman (%)
Sexual Behavior - Males 18+ that ever had anal sex with a woman (%)
Sexual Behavior - Males 18+ that ever had any sex with a man (%)
Sexual Behavior - Females 18+ that ever had vaginal sex with a man (%)
Sexual Behavior - Females 18+ that ever performed oral sex on a man (%)
Sexual Behavior - Females 18+ that ever had anal sex with a man (%)
Sexual Behavior - Females 18+ that ever had any kind of sex with a woman (%)
Sexual Behavior - Average age people first had sex
Sexual Behavior - Average number of female sex partners in lifetime (males 18+)
Sexual Behavior - Average number of female vaginal sex partners in lifetime (males 18+)
Sexual Behavior - Average age people first performed oral sex on a woman (18+)
Sexual Behavior - Average number of woman performed oral sex on in lifetime (18+)
Sexual Behavior - Average number of male sex partners in lifetime (males 18+)
Sexual Behavior - Average number of male anal sex partners in lifetime (males 18+)
Sexual Behavior - Average age people first performed oral sex on a man (18+)
Sexual Behavior - Average number of male oral sex partners in lifetime (18+)
Sexual Behavior - People using protection when performing oral sex (%)
Sexual Behavior - Average number of times people have vaginal or anal sex a year
Sexual Behavior - People having sex without condom (%)
Sexual Behavior - Average number of male sex partners in lifetime (females 18+)
Sexual Behavior - Average number of male vaginal sex partners in lifetime (females 18+)
Sexual Behavior - Average number of female sex partners in lifetime (females 18+)
Sexual Behavior - Circumcised males 18+ (%)
Sleep Disorders - Average hours sleeping at night
Sleep Disorders - People that has trouble sleeping (%)
Smoking-Cigarette Use - People smoking cigarettes (%)
Taste & Smell - People 40+ having problems with smell (%)
Taste & Smell - People 40+ having problems with taste (%)
Taste & Smell - People 40+ that ever had wisdom teeth removed (%)
Taste & Smell - People 40+ that ever had tonsils teeth removed (%)
Taste & Smell - People 40+ that ever had a loss of consciousness because of a head injury (%)
Taste & Smell - People 40+ that ever had a broken nose or other serious injury to face or skull (%)
Taste & Smell - People 40+ that ever had two or more sinus infections (%)
Weight - Average height (inches)
Weight - Average weight (pounds)
Weight - Average BMI
Weight - People that are obese (%)
Weight - People that ever were obese (%)
Weight - People trying to lose weight (%)
100%
urban population.
Estimated median house/condo value in 2022: $201,606
37412:
$201,606Tennessee:
$284,800
According to our research of Tennessee and other state lists, there were 43 registered sex offenders living in 37412 zip code as of May 28, 2024 . The ratio of all residents to sex offenders in zip code 37412 is 503 to 1.The ratio of registered sex offenders to all residents in this zip code is lower than the state average.
Median resident age: This zip code:
39.7 yearsTennessee median age:
39.2 years
Average household size: This zip code:
2.2 peopleTennessee:
2.4 people
Averages for the 2020 tax year for zip code 37412, filed in 2021:
Average Adjusted Gross Income (AGI) in 2020: $45,390 (Individual Income Tax Returns) Here:
$45,390State:
$69,014
Salary/wage: $41,029 (reported on 83.9% of returns )Here:
$41,029State:
$55,872
(% of AGI for various income ranges: 1177.4% for AGIs below $25k , 3780.0% for AGIs $25k-50k , 6714.7% for AGIs $50k-75k , 10070.9% for AGIs $75k-100k , 15487.2% for AGIs $100k-200k , 72026.7% for AGIs over 200k ) Taxable interest for individuals: $1,142 (reported on 16.8% of returns )This zip code:
$1,142Tennessee:
$1,945
(% of AGI for various income ranges: 11.7% for AGIs below $25k , 8.4% for AGIs $25k-50k , 30.0% for AGIs $50k-75k , 30.7% for AGIs $75k-100k , 93.9% for AGIs $100k-200k , 1723.3% for AGIs over 200k ) Ordinary dividends: $3,820 (reported on 9.0% of returns )(% of AGI for various income ranges: 12.7% for AGIs below $25k , 13.6% for AGIs $25k-50k , 38.1% for AGIs $50k-75k , 78.5% for AGIs $75k-100k , 270.4% for AGIs $100k-200k , 2740.0% for AGIs over 200k ) Net capital gain/loss in AGI: +$6,775 (reported on 8.4% of returns )Here:
+$6,775State:
+$33,664
(% of AGI for various income ranges: 7.6% for AGIs below $25k , 9.0% for AGIs $25k-50k , 48.6% for AGIs $50k-75k , 90.6% for AGIs $75k-100k , 640.7% for AGIs $100k-200k , 5663.3% for AGIs over 200k ) Profit/loss from business: +$12,570 (reported on 15.8% of returns )Here:
+$12,570State:
+$18,991
(% of AGI for various income ranges: 176.1% for AGIs below $25k , 162.5% for AGIs $25k-50k , 241.4% for AGIs $50k-75k , 270.9% for AGIs $75k-100k , 667.2% for AGIs $100k-200k , 13460.0% for AGIs over 200k ) Taxable individual retirement arrangement distribution: $14,024 (reported on 6.1% of returns )37412:
$14,024Tennessee:
$20,036
(% of AGI for various income ranges: 43.5% for AGIs below $25k , 59.3% for AGIs $25k-50k , 125.0% for AGIs $50k-75k , 279.1% for AGIs $75k-100k , 717.0% for AGIs $100k-200k ) Total itemized deductions: $29,979 (reported on 2.7% of returns )Here:
$29,979State:
$40,136
(% of AGI for various income ranges: 13.2% for AGIs below $25k , 53.9% for AGIs $25k-50k , 90.3% for AGIs $50k-75k , 257.4% for AGIs $75k-100k , 553.0% for AGIs $100k-200k , 5593.3% for AGIs over 200k ) Charity contributions: $12,268 (reported on 2.0% of returns )Here:
$12,268State:
$19,852
(% of AGI for various income ranges: 11.2% for AGIs $25k-50k , 26.8% for AGIs $50k-75k , 67.4% for AGIs $75k-100k , 222.8% for AGIs $100k-200k , 2173.3% for AGIs over 200k ) Taxes paid: $4,289 (reported on 2.5% of returns )(% of AGI for various income ranges: 7.8% for AGIs $25k-50k , 12.0% for AGIs $50k-75k , 36.7% for AGIs $75k-100k , 75.0% for AGIs $100k-200k , 803.3% for AGIs over 200k ) Earned income credit: $2,276 (reported on 20.2% of returns )(% of AGI for various income ranges: 104.0% for AGIs below $25k , 64.4% for AGIs $25k-50k , 1.1% for AGIs $50k-75k ) Percentage of individuals using paid preparers for their 2020 taxes: 92.9%(% for various income ranges: 91.2% for AGIs below $25k , 93.6% for AGIs $25k-50k , 94.7% for AGIs $50k-75k , 94.9% for AGIs $75k-100k , 90.9% for AGIs $100k-200k , 100.0% for AGIs over 200k )
Averages for the 2012 tax year for zip code 37412, filed in 2013:
Average Adjusted Gross Income (AGI) in 2012: $36,431 (Individual Income Tax Returns) Here:
$36,431State:
$53,767
Salary/wage: $33,555 (reported on 85.5% of returns )Here:
$33,555State:
$45,421
(% of AGI for various income ranges: 82.5% for AGIs below $25k , 85.9% for AGIs $25k-50k , 81.5% for AGIs $50k-75k , 75.3% for AGIs $75k-100k , 71.9% for AGIs $100k-200k , 43.5% for AGIs over 200k ) Taxable interest for individuals: $1,345 (reported on 20.0% of returns )This zip code:
$1,345Tennessee:
$1,732
(% of AGI for various income ranges: 0.7% for AGIs below $25k , 0.4% for AGIs $25k-50k , 0.5% for AGIs $50k-75k , 0.8% for AGIs $75k-100k , 1.4% for AGIs $100k-200k , 1.7% for AGIs over 200k ) Ordinary dividends: $3,113 (reported on 9.9% of returns )(% of AGI for various income ranges: 0.7% for AGIs below $25k , 0.5% for AGIs $25k-50k , 0.6% for AGIs $50k-75k , 0.7% for AGIs $75k-100k , 1.4% for AGIs $100k-200k , 3.0% for AGIs over 200k ) Net capital gain/loss in AGI: +$2,637 (reported on 5.7% of returns )Here:
+$2,637State:
+$19,082
(% of AGI for various income ranges: 0.3% for AGIs $50k-75k , 0.3% for AGIs $75k-100k , 1.3% for AGIs $100k-200k , 3.1% for AGIs over 200k ) Profit/loss from business: +$9,408 (reported on 13.3% of returns )Here:
+$9,408State:
+$15,240
(% of AGI for various income ranges: 6.2% for AGIs below $25k , 1.8% for AGIs $25k-50k , 2.8% for AGIs $50k-75k , 2.7% for AGIs $75k-100k , 6.5% for AGIs $100k-200k ) Taxable individual retirement arrangement distribution: $10,798 (reported on 8.2% of returns )37412:
$10,798Tennessee:
$15,505
(% of AGI for various income ranges: 2.4% for AGIs below $25k , 1.7% for AGIs $25k-50k , 1.8% for AGIs $50k-75k , 3.5% for AGIs $75k-100k , 4.8% for AGIs $100k-200k ) Self-employment retirement plans: $17,800 (reported on 0.2% of returns )37412:
$17,800Tennessee:
$22,567
Total itemized deductions: $16,232 (24% of AGI, reported on 16.3% of returns )Here:
$16,232State:
$21,976
Here:
23.9% of AGIState:
17.8% of AGI
(% of AGI for various income ranges: 5.2% for AGIs below $25k , 6.6% for AGIs $25k-50k , 7.4% for AGIs $50k-75k , 9.3% for AGIs $75k-100k , 9.0% for AGIs $100k-200k , 6.8% for AGIs over 200k ) Charity contributions: $4,701 (reported on 12.4% of returns )(% of AGI for various income ranges: 0.6% for AGIs below $25k , 1.3% for AGIs $25k-50k , 1.4% for AGIs $50k-75k , 2.2% for AGIs $75k-100k , 2.7% for AGIs $100k-200k , 2.9% for AGIs over 200k ) Taxes paid: $3,343 (reported on 16.0% of returns )(% of AGI for various income ranges: 0.9% for AGIs below $25k , 1.2% for AGIs $25k-50k , 1.4% for AGIs $50k-75k , 1.9% for AGIs $75k-100k , 2.2% for AGIs $100k-200k , 1.9% for AGIs over 200k ) Earned income credit: $2,255 (reported on 23.2% of returns )(% of AGI for various income ranges: 6.7% for AGIs below $25k , 1.0% for AGIs $25k-50k ) Percentage of individuals using paid preparers for their 2012 taxes: 49.0%(% for various income ranges: 49.1% for AGIs below $25k , 47.5% for AGIs $25k-50k , 48.6% for AGIs $50k-75k , 50.8% for AGIs $75k-100k , 54.8% for AGIs $100k-200k , 66.7% for AGIs over 200k )
Averages for the 2004 tax year for zip code 37412, filed in 2005:
Average Adjusted Gross Income (AGI) in 2004: $32,885 (Individual Income Tax Returns) Here:
$32,885State:
$44,088
Salary/wage: $31,321 (reported on 83.8% of returns )Here:
$31,321State:
$38,825
(% of AGI for various income ranges: 124.8% for AGIs below $10k , 77.7% for AGIs $10k-25k , 84.2% for AGIs $25k-50k , 84.7% for AGIs $50k-75k , 78.9% for AGIs $75k-100k , 59.0% for AGIs over 100k ) Taxable interest for individuals: $1,695 (reported on 32.7% of returns )This zip code:
$1,695Tennessee:
$1,802
(% of AGI for various income ranges: 5.0% for AGIs below $10k , 2.1% for AGIs $10k-25k , 1.1% for AGIs $25k-50k , 1.2% for AGIs $50k-75k , 1.5% for AGIs $75k-100k , 2.9% for AGIs over 100k ) Taxable dividends: $2,258 (reported on 14.6% of returns )(% of AGI for various income ranges: 3.7% for AGIs below $10k , 1.0% for AGIs $10k-25k , 0.6% for AGIs $25k-50k , 0.5% for AGIs $50k-75k , 1.3% for AGIs $75k-100k , 2.0% for AGIs over 100k ) Net capital gain/loss: +$4,965 (reported on 11.0% of returns )Here:
+$4,965State:
+$15,776
(% of AGI for various income ranges: -1.0% for AGIs below $10k , 0.1% for AGIs $10k-25k , 0.3% for AGIs $25k-50k , 0.5% for AGIs $50k-75k , 1.2% for AGIs $75k-100k , 8.6% for AGIs over 100k ) Profit/loss from business: +$7,958 (reported on 13.5% of returns )Here:
+$7,958State:
+$12,882
(% of AGI for various income ranges: 7.7% for AGIs below $10k , 5.0% for AGIs $10k-25k , 2.2% for AGIs $25k-50k , 1.7% for AGIs $50k-75k , 2.2% for AGIs $75k-100k , 6.1% for AGIs over 100k ) IRA payment deduction: $2,836 (reported on 1.7% of returns )37412:
$2,836Tennessee:
$2,934
(% of AGI for various income ranges: 0.1% for AGIs $10k-25k , 0.2% for AGIs $25k-50k , 0.1% for AGIs $50k-75k , 0.1% for AGIs $75k-100k , 0.2% for AGIs over 100k ) Self-employed pension: $12,833 (reported on 0.2% of returns )Here:
$12,833Tennessee:
$16,857
Total itemized deductions: $14,202 (24% of AGI, reported on 19.4% of returns )Here:
$14,202State:
$18,035
Here:
24.3% of AGIState:
19.9% of AGI
(% of AGI for various income ranges: 8.1% for AGIs below $10k , 6.1% for AGIs $10k-25k , 7.7% for AGIs $25k-50k , 9.1% for AGIs $50k-75k , 10.4% for AGIs $75k-100k , 9.8% for AGIs over 100k ) Charity contributions deductions: $4,245 (7% of AGI, reported on 16.4% of returns )Here:
6.9% of AGIState:
5.3% of AGI
(% of AGI for various income ranges: 0.8% for AGIs below $10k , 1.1% for AGIs $10k-25k , 1.5% for AGIs $25k-50k , 2.1% for AGIs $50k-75k , 3.0% for AGIs $75k-100k , 4.0% for AGIs over 100k ) Total tax: $4,134 (reported on 74.4% of returns )(% of AGI for various income ranges: 5.9% for AGIs below $10k , 4.4% for AGIs $10k-25k , 7.2% for AGIs $25k-50k , 9.4% for AGIs $50k-75k , 11.4% for AGIs $75k-100k , 18.0% for AGIs over 100k ) Earned income credit: $1,679 (reported on 18.0% of returns )Percentage of individuals using paid preparers for their 2004 taxes: 56.1%(% for various income ranges: 51.1% for AGIs below $10k , 57.8% for AGIs $10k-25k , 56.4% for AGIs $25k-50k , 57.4% for AGIs $50k-75k , 54.2% for AGIs $75k-100k , 66.2% for AGIs over 100k )
Estimated median household income in 2022: This zip code:
$54,426Tennessee:
$65,254
Nearest zip codes: 37411 ,
30742 ,
37404 ,
37407 ,
30741 ,
37406 .
East Ridge Zip Code Map
Percentage of family households: This zip code:
39.8%Tennessee:
46.2%
Percentage of households with unmarried partners: This zip code:
4.9%Tennessee:
47.1%
Likely homosexual households (counted as self-reported same-sex unmarried-partner households)
Lesbian couples: 0.0% of all households Gay men: 0.2% of all households
Household received Food Stamps/SNAP in the past 12 months: 1,194Household did not receive Food Stamps/SNAP in the past 12 months: 8,725
Women who had a birth in the past 12 months: 71 (39 now married , 31 unmarried) Women who did not have a birth in the past 12 months: 5,282 (2,009 now married , 3,271 unmarried)
Housing units in zip code 37412 with a mortgage: 4,090 (185
second mortgage , 43
home equity loan , 124
both second mortgage and home equity loan )
Houses without a mortgage: 20
Median monthly owner costs for units with a mortgage: $1,141
Median monthly owner costs for units without a mortgage: $438
Residents with income below the poverty level in 2022:
This zip code:
14.9%Whole state:
13.3%
Residents with income below 50% of the poverty level in 2022:
This zip code:
8.7%Whole state:
7.1%
Median number of rooms in houses and condos: Median number of rooms in apartments: Notable locations in this zip code not listed on our city pages
Click to draw/clear zip code borders Notable locations in zip code 37412: (A) , East Ridge City Hall (B) , Puckett EMS (C) . Display/hide their locations on the map
Shopping Centers: (1) , Osborne Shopping Center (2) , East Ridge Shopping Center (3) . Display/hide their locations on the map
Churches in zip code 37412 include: (A) , Duncan Park Church (B) , East Ridge Baptist Church (C) , East Ridge Christian Church (D) , East Ridge Church of Christ (E) , EAst Ridge Church of God (F) , East Ridge Presbyterian Church (G) , Fellowship Baptist Church (H) , Frawley Church (I) . Display/hide their locations on the map
Cemeteries: (1) , Mount Olivet Cemetery (2) . Display/hide their locations on the map
Park in zip code 37412: (1) . Display/hide its location on the map
Tourist attractions (not listed on the city page) : (1) , Ankar's Billiards & Bar Stools (Amusement & Theme Parks; 1426 South Moore Road) (2) , CHOO CHOO Express Tours & Travel (Tours & Charters; 6016 Ringgold Road Suite B) (3) . Display/hide their approximate locations on the map
Year house built (houses)
0 2020 or later319 2010 to 2019682 2000 to 2009432 1990 to 19991,068 1980 to 19891,703 1970 to 19791,631 1960 to 19692,917 1950 to 1959940 1940 to 1949400 1939 or earlier
Zip code 37412 household income distribution in 2022 306 Less than $10,000501 $10,000 to $14,999696 $15,000 to $19,999528 $20,000 to $24,999442 $25,000 to $29,999543 $30,000 to $34,999653 $35,000 to $39,999300 $40,000 to $44,999475 $45,000 to $49,999836 $50,000 to $59,9991,081 $60,000 to $74,9991,331 $75,000 to $99,999796 $100,000 to $124,999588 $125,000 to $149,999549 $150,000 to $199,999198 $200,000 or moreEstimate of home value of owner-occupied houses/condos in 2022 in zip code 37412 31 $10,000 to $14,9993 $15,000 to $19,9998 $20,000 to $24,99916 $25,000 to $29,99926 $40,000 to $49,99960 $60,000 to $69,999200 $70,000 to $79,99959 $80,000 to $89,99998 $90,000 to $99,999603 $100,000 to $124,999551 $125,000 to $149,999976 $150,000 to $174,999575 $175,000 to $199,999704 $200,000 to $249,999515 $250,000 to $299,999274 $300,000 to $399,99988 $400,000 to $499,99946 $500,000 to $749,99933 $750,000 to $999,99942 $1,000,000 to $1,499,999Rent paid by renters in 2022 in zip code 37412 35 $150 to $19910 $300 to $34931 $350 to $39943 $400 to $44958 $450 to $49985 $500 to $549108 $550 to $599171 $600 to $649286 $650 to $699285 $700 to $749164 $750 to $799835 $800 to $899314 $900 to $999546 $1,000 to $1,249319 $1,250 to $1,499110 $1,500 to $1,999207 $2,000 to $2,49921 $2,500 to $2,99985 $3,500 or more61 No cash rent
Median gross rent in 2022: $1,083.
Median price asked for vacant for-sale houses and condos in 2022: $196,090.
Estimated median house (or condo) value in 2022 for: White Non-Hispanic householders: $200,354American Indian or Alaska Native householders: $162,585Asian householders: $518,021Two or more races householders: $236,623Hispanic or Latino householders: $223,617Estimated median house or condo value in 2022: $201,606
37412:
$201,606Tennessee:
$284,800
Lower value quartile - upper value quartile: $154,836 - $252,504
Mean price in 2022: Detached houses: $236,261Here:
$236,261State:
$374,382
Townhouses or other attached units: $109,226Here:
$109,226State:
$354,101
In 2-unit structures: $71,394Here:
$71,394State:
$247,693
In 5-or-more-unit structures: $5,568,607Here:
$5,568,607State:
$317,434
Mobile homes: $123,387Here:
$123,387State:
$101,421
Housing units in structures:
One, detached: 7,300One, attached: 573Two: 1,1073 or 4: 1355 to 9: 38910 to 19: 28820 to 49: 42750 or more: 310Mobile homes: 71Unemployment : 4.3%
Means of transportation to work in zip code 37412 69.4% 8,087 Drove a car alone10.9% 1,267 Carpooled0.1% 15 Motorcycle2.6% 302 Walked1.8% 207 Other means16.5% 1,923 Worked at homeTravel time to work (commute) in zip code 37412 241 Less than 5 minutes685 5 to 9 minutes1,618 10 to 14 minutes2,899 15 to 19 minutes2,294 20 to 24 minutes509 25 to 29 minutes977 30 to 34 minutes119 35 to 39 minutes69 40 to 44 minutes289 45 to 59 minutes58 60 to 89 minutes74 90 or more minutes
Percentage of zip code residents living and working in this county: 92.1%
Household type by relationship:
Households: 22,242
Male householders: 4,689 (1,691 living alone ), Female householders: 5,237 (1,747 living alone )3,950 spouses (3,897 opposite-sex spouses ), 1,023 unmarried partners , (872 opposite-sex unmarried partners ), 5,071 children (4,460 natural , 119 adopted , 477 stepchildren ), 655 grandchildren , 101 brothers or sisters , 358 parents , 45 foster children , 338 other relatives , 697 non-relatives In group quarters: 168 (-1 institutionalized population )
Size of family households: 2,735 2-persons , 1,753 3-persons , 643 4-persons , 307 5-persons , 181 6-persons , 105 7-or-more-persons
Size of nonfamily households: 3,433 1-person , 655 2-persons , 92 3-persons , 17 4-persons
1,954 married couples with children. single-parent households (428 men , 1,149 women ).
86.3% of residents of 37412 zip code speak English at home. of residents speak Spanish at home (35% very well, 24% well, 29% not well, 12% not at all ).of residents speak other Indo-European language at home (77% very well, 13% well, 2% not well, 9% not at all ).of residents speak Asian or Pacific Island language at home (88% very well, 5% well, 7% not well ).of residents speak other language at home (32% very well, 44% well, 24% not well ).
Foreign born population: 2,118 (9.5%)
(36.8%
of them are naturalized citizens )
This zip code:
9.5%Whole state:
5.6%
34% Honduras 15% Belarus 11% El Salvador 9% Guatemala 6% Malaysia 6% France 5% Ukraine 17% American 14% English 10% Irish 8% German 6% Yugoslavian 2% Italian 2% European
Year of entry for the foreign-born population
1,195 2010 or later 751 2000 to 2009 370 1990 to 1999 181 Before 1990
Facilities with environmental interests located in this zip code:
ALLSTATE PRINTING COMPANY (4115 RINGGOLD ROAD in CHATTANOOGA, TN)
(Resource Conservation and Recovery Act (tracking hazardous waste)) Business NAICS classification: COMMERCIAL LITHOGRAPHIC PRINTING.
ANIMAL CLINIC OF EAST RIDGE (5812 RINGGOLD ROAD in CHATTANOOGA, TN)
(Resource Conservation and Recovery Act (tracking hazardous waste))
BROCK PRINTING CO (3534 BENNETT RD in CHATTANOOGA, TN)
(Resource Conservation and Recovery Act (tracking hazardous waste))
BUNDSCHU ENTERPRISES (5412 RINGGOLD in CHATTANOOGA, TN)
(Resource Conservation and Recovery Act (tracking hazardous waste))
CAUSEY BATTERY & METAL CO (1809 PALM BEACH AVE in CHATTANOOGA, TN)
(Resource Conservation and Recovery Act (tracking hazardous waste)) Business NAICS classification: OTHER COMMUNICATION AND ENERGY WIRE MANUFACTURING.
CHATTANOOGA BUTTON & BADGE CO (3748 RINGGOLD RD in CHATTANOOGA, TN)
(Resource Conservation and Recovery Act (tracking hazardous waste)) Business NAICS classification: ALL OTHER MISCELLANEOUS TEXTILE PRODUCT MILLS.
COBB ROBERT SIGNS (1409 ALTAMAHA STREET in CHATTANOOGA, TN)
(Resource Conservation and Recovery Act (tracking hazardous waste))
COLONIAL EXTERMINATING CO (MERCURY (SOLID) 2.6 LEACH in CHATTANOOGA, TN)
(Resource Conservation and Recovery Act (tracking hazardous waste))
CANNON'S TOWING SERVICE & AUTO REPAIR (4112 RINGGOLD ROAD in EAST RIDGE, TN)
Conditionally Exempt Small Quantity Generators, less than 100 kg/month of hazardous waste (Resource Conservation and Recovery Act (tracking hazardous waste)) Organizations: BOBBY CANNON (CONTACT/OWNER)
Housing units lacking complete plumbing facilities: 0.7%
Housing units lacking complete kitchen facilities: 1.6%
82.0% Electricity 16.1% Utility gas 1.0% Bottled, tank, or LP gas
Population in 1990: 20,711.
Place of birth for U.S.-born residents:
This state: 11,949Northeast: 1,016Midwest: 1,734South: 4,305West: 853
56% of the 37412 zip code residents lived in the same house 5 years ago.
Out of people who lived in different houses, 62% lived in this county.
Out of people who lived in different counties, 50% lived in Tennessee.
88% of the 37412 zip code residents lived in the same house 1 year ago.
Out of people who lived in different houses, 52% moved from this county.
Out of people who lived in different houses, 18% moved from different county within same state.
Out of people who lived in different houses, 18% moved from different state.
Out of people who lived in different houses, 12% moved from abroad.
Private vs. public school enrollment:
Students in private schools in grades 1 to 8 (elementary and middle school): 303
Here:
17.5%Tennessee:
15.0%
Students in private schools in grades 9 to 12 (high school): 192
Here:
18.0%Tennessee:
16.2%
Students in private undergraduate colleges: 72
Occupation by median earnings in the past 12 months ($)
107,897 Architecture and engineering occupations 81,049 Legal occupations 77,866 Computer and mathematical occupations 74,866 Health diagnosing and treating practitioners and other technical occupations 67,610 Management occupations 60,290 Business and financial operations occupations
Companies with federal contracts located in this zip code (CHATTANOOGA, TN):
CERTIFIED MAINTENANCE SERVICE (1504 MERRILL ST; small business) in 6 contracts from 2002 to 2006
Contracts for Custodial Janitorial Services by Navy, Defense Contract Management AgencySigned by year: 2000: $0; 2001: $0; 2002: $11,868; 2003: $11,868; 2004: $11,868; 2005: $11,840; 2006: $5,330.
Biggest contracts: with Navy for Custodial Janitorial Services. Signed on 2004-03-16. Completion date: 2009-04-06.
, same as above. Signed on 2003-04-01. Completion date: 2004-04-06.
, same as above. Signed on 2002-04-02. Completion date: 2003-04-06.
, same as above. Signed on 2005-03-28. Completion date: 2009-04-06.
EYE OF THE NEEDLE MANUFACTURIN (5512 RINGGOLD RD STE 116; small business) in 2 contracts in 2005
$16,620 with Army for Bags and Sacks. Taking place in AK. Signed on 2005-06-14. Completion date: 2005-07-22.
with Army for Hosiery, Handwear, and Clothing Accessories, Men's. Signed on 2005-08-17. Completion date: 2005-08-31.
CIABATTONE ENTERPRISES LLC OF (5309 RINGGOLD RD; small business) in 2 contracts from 2004 to 2005
$13,043 with Army for Fire Fighting Equipment. Signed on 2005-09-09. Completion date: 2005-10-09.
with Army for Clothing, Special Purpose. Signed on 2004-07-27. Completion date: 2004-09-10.
AMERICAN MANAGEMENT SERVICES, (6700 RINGGOLD RD; small business) in 4 contracts from 2003 to 2005
$3,517 with Army for Lodging - Hotel/Motel. Signed on 2005-04-22. Completion date: 2005-04-25.
, same as above. Signed on 2003-05-09. Completion date: 2003-05-09.
, same as above. Signed on 2005-05-02. Completion date: 2005-04-25.
, same as above. Signed on 2003-07-18. Completion date: 2003-05-09.
GOVERNMENT PACKAGING AND PROCU (910 BELVOIR HILLS CIRCLE; small business)
$4,542 with Defense Logistics Agency for Hand Tools, Edged, Nonpowered. Signed on 2006-04-28. Completion date: 2006-06-12.
ALDMOR MANAGEMENT INC (6739 RINGGOLD RD STE C; small business)
$2,700 with Army for Passenger Motor Charter Service. Taking place in FL. Signed on 2004-04-22. Completion date: 2004-05-02.
Top industries in this zip code by the number of employees in 2005:
Accommodation and Food Services: Limited-Service Restaurants (50-99 employees: 1 establishment, 20-49 employees: 9 establishments, 10-19 employees: 8 establishments, 5-9 employees: 5 establishments, 1-4 employees: 4 establishments)Accommodation and Food Services: Full-Service Restaurants (100-249: 1, 50-99: 1, 20-49: 6, 10-19: 3, 5-9: 3, 1-4: 6)Health Care and Social Assistance: Offices of Physicians (except Mental Health Specialists) (100-249: 1, 50-99: 1, 20-49: 2, 10-19: 2, 5-9: 4, 1-4: 9)Health Care and Social Assistance: General Medical and Surgical Hospitals (250-499: 1)Administrative and Support and Waste Management and Remediation Services: Temporary Help Services (100-249: 1, 20-49: 3)Other Services (except Public Administration): Religious Organizations (20-49: 4, 10-19: 3, 5-9: 5, 1-4: 13)Administrative and Support and Waste Management and Remediation Services: Janitorial Services (100-249: 1, 10-19: 2, 5-9: 1, 1-4: 3)Construction: All Other Specialty Trade Contractors (100-249: 1, 5-9: 1, 1-4: 1)
People in group quarters in 2010:
138 people in nursing facilities/skilled-nursing facilities
15 people in group homes intended for adults
11 people in workers' group living quarters and job corps centers
11 people in other noninstitutional facilities
People in group quarters in 2000:
115 people in nursing homes
72 people in other noninstitutional group quarters
27 people in other group homes
8 people in homes for the mentally retarded
3 people in religious group quarters
Fatal accident statistics in 2013:
Fatal accident count: 2Vehicles involved in fatal accidents: 3Fatal accidents caused by drunken drivers: 0Fatalities: 2Persons involved in fatal accidents: 3Pedestrians involved in fatal accidents: 1
Fatal accident statistics in 2012:
Fatal accident count: 2Vehicles involved in fatal accidents: 2Fatal accidents caused by drunken drivers: 0Fatalities: 2Persons involved in fatal accidents: 3Pedestrians involved in fatal accidents: 0
Home Mortgage Disclosure Act Aggregated Statistics For Year 2009(Based on 5 full and 6 partial tracts) A) FHA, FSA/RHS & VA B) Conventional C) Refinancings D) Home Improvement Loans E) Loans on Dwellings For 5+ Families F) Non-occupant Loans on Number Average Value Number Average Value Number Average Value Number Average Value Number Average Value Number Average Value
LOANS ORIGINATED 237 $95,898 132 $104,388 528 $100,420 36 $25,681 8 $383,530 136 $98,098 APPLICATIONS APPROVED, NOT ACCEPTED 8 $102,169 6 $60,927 44 $92,310 7 $18,153 0 $0 9 $83,380 APPLICATIONS DENIED 19 $94,418 36 $91,906 196 $111,568 31 $25,584 0 $0 17 $66,892 APPLICATIONS WITHDRAWN 38 $105,066 23 $99,160 179 $117,221 2 $103,625 0 $0 14 $71,472 FILES CLOSED FOR INCOMPLETENESS 8 $100,819 6 $127,658 41 $128,549 0 $0 0 $0 1 $117,530
Aggregated Statistics For Year 2008(Based on 5 full and 6 partial tracts) A) FHA, FSA/RHS & VA B) Conventional C) Refinancings D) Home Improvement Loans E) Loans on Dwellings For 5+ Families F) Non-occupant Loans on G) Loans On Manufactured Number Average Value Number Average Value Number Average Value Number Average Value Number Average Value Number Average Value Number Average Value
LOANS ORIGINATED 190 $105,964 166 $98,037 369 $104,095 72 $34,516 14 $1,183,857 149 $90,686 0 $0 APPLICATIONS APPROVED, NOT ACCEPTED 8 $100,969 15 $94,265 37 $106,696 18 $24,366 0 $0 4 $100,805 0 $0 APPLICATIONS DENIED 22 $110,504 42 $85,052 344 $112,025 53 $53,824 0 $0 32 $81,098 5 $75,340 APPLICATIONS WITHDRAWN 28 $106,438 33 $114,780 118 $114,146 8 $60,445 0 $0 21 $63,721 0 $0 FILES CLOSED FOR INCOMPLETENESS 5 $130,590 5 $162,538 60 $105,546 0 $0 0 $0 7 $94,684 0 $0
Aggregated Statistics For Year 2007(Based on 5 full and 6 partial tracts) A) FHA, FSA/RHS & VA B) Conventional C) Refinancings D) Home Improvement Loans E) Loans on Dwellings For 5+ Families F) Non-occupant Loans on G) Loans On Manufactured Number Average Value Number Average Value Number Average Value Number Average Value Number Average Value Number Average Value Number Average Value
LOANS ORIGINATED 126 $107,707 503 $104,484 532 $94,790 104 $46,126 8 $2,412,201 186 $89,100 4 $87,060 APPLICATIONS APPROVED, NOT ACCEPTED 0 $0 60 $92,650 97 $96,814 16 $32,264 0 $0 38 $96,011 2 $97,645 APPLICATIONS DENIED 29 $107,641 134 $94,960 527 $104,516 101 $49,559 2 $1,672,500 64 $94,516 1 $57,900 APPLICATIONS WITHDRAWN 9 $122,046 73 $115,752 189 $102,987 20 $54,532 2 $636,525 30 $80,706 0 $0 FILES CLOSED FOR INCOMPLETENESS 8 $115,031 57 $111,190 144 $107,807 4 $46,972 0 $0 21 $103,343 0 $0
Aggregated Statistics For Year 2006(Based on 5 full and 6 partial tracts) A) FHA, FSA/RHS & VA B) Conventional C) Refinancings D) Home Improvement Loans E) Loans on Dwellings For 5+ Families F) Non-occupant Loans on G) Loans On Manufactured Number Average Value Number Average Value Number Average Value Number Average Value Number Average Value Number Average Value Number Average Value
LOANS ORIGINATED 68 $111,351 678 $77,786 622 $84,325 119 $34,197 1 $942,890 246 $73,106 1 $69,000 APPLICATIONS APPROVED, NOT ACCEPTED 4 $91,308 143 $83,474 150 $87,449 19 $28,503 0 $0 33 $77,960 10 $65,588 APPLICATIONS DENIED 8 $70,331 197 $114,032 526 $95,541 136 $38,656 0 $0 86 $72,166 22 $57,524 APPLICATIONS WITHDRAWN 14 $111,429 99 $74,734 275 $100,631 19 $52,539 0 $0 32 $84,466 0 $0 FILES CLOSED FOR INCOMPLETENESS 0 $0 36 $70,498 101 $93,489 5 $10,000 0 $0 18 $66,251 0 $0
Aggregated Statistics For Year 2005(Based on 5 full and 6 partial tracts) A) FHA, FSA/RHS & VA B) Conventional C) Refinancings D) Home Improvement Loans E) Loans on Dwellings For 5+ Families F) Non-occupant Loans on G) Loans On Manufactured Number Average Value Number Average Value Number Average Value Number Average Value Number Average Value Number Average Value Number Average Value
LOANS ORIGINATED 83 $100,172 676 $76,178 682 $83,299 102 $32,684 2 $281,770 201 $84,355 2 $93,660 APPLICATIONS APPROVED, NOT ACCEPTED 6 $89,773 94 $76,313 115 $83,166 23 $34,611 0 $0 18 $70,085 11 $58,798 APPLICATIONS DENIED 17 $104,071 175 $66,323 466 $90,408 106 $28,342 0 $0 35 $57,926 38 $45,085 APPLICATIONS WITHDRAWN 6 $78,987 92 $87,585 397 $101,542 28 $84,648 0 $0 30 $100,780 0 $0 FILES CLOSED FOR INCOMPLETENESS 4 $106,052 29 $81,916 45 $107,338 2 $36,625 0 $0 4 $34,982 0 $0
Aggregated Statistics For Year 2004(Based on 5 full and 6 partial tracts) A) FHA, FSA/RHS & VA B) Conventional C) Refinancings D) Home Improvement Loans E) Loans on Dwellings For 5+ Families F) Non-occupant Loans on G) Loans On Manufactured Number Average Value Number Average Value Number Average Value Number Average Value Number Average Value Number Average Value Number Average Value
LOANS ORIGINATED 112 $97,046 520 $83,339 713 $80,903 96 $29,728 6 $2,213,333 231 $71,992 5 $14,406 APPLICATIONS APPROVED, NOT ACCEPTED 6 $109,720 108 $79,276 187 $76,319 15 $44,881 0 $0 29 $59,736 17 $27,364 APPLICATIONS DENIED 18 $91,877 152 $71,336 476 $85,654 108 $27,066 2 $320,000 40 $84,998 47 $43,452 APPLICATIONS WITHDRAWN 11 $88,314 79 $75,993 259 $85,200 18 $32,521 0 $0 23 $59,871 0 $0 FILES CLOSED FOR INCOMPLETENESS 2 $78,080 17 $78,159 56 $83,682 7 $33,780 0 $0 3 $59,877 0 $0
Aggregated Statistics For Year 2003(Based on 5 full and 6 partial tracts) A) FHA, FSA/RHS & VA B) Conventional C) Refinancings D) Home Improvement Loans E) Loans on Dwellings For 5+ Families F) Non-occupant Loans on Number Average Value Number Average Value Number Average Value Number Average Value Number Average Value Number Average Value
LOANS ORIGINATED 113 $85,337 465 $77,921 1,165 $75,650 69 $20,391 6 $1,129,870 225 $63,505 APPLICATIONS APPROVED, NOT ACCEPTED 7 $100,357 50 $78,981 203 $77,096 10 $20,088 0 $0 28 $74,189 APPLICATIONS DENIED 13 $85,878 76 $74,711 529 $79,139 83 $19,835 0 $0 45 $68,986 APPLICATIONS WITHDRAWN 11 $95,076 45 $83,825 257 $85,651 9 $27,433 0 $0 16 $63,644 FILES CLOSED FOR INCOMPLETENESS 2 $97,000 20 $66,656 29 $92,233 2 $100,000 0 $0 2 $94,365
Aggregated Statistics For Year 2002(Based on 5 full and 4 partial tracts) A) FHA, FSA/RHS & VA B) Conventional C) Refinancings D) Home Improvement Loans E) Loans on Dwellings For 5+ Families F) Non-occupant Loans on Number Average Value Number Average Value Number Average Value Number Average Value Number Average Value Number Average Value
LOANS ORIGINATED 109 $79,438 313 $70,462 754 $70,975 66 $17,774 1 $970,620 156 $59,063 APPLICATIONS APPROVED, NOT ACCEPTED 5 $64,432 92 $74,819 191 $67,059 10 $24,752 0 $0 15 $57,754 APPLICATIONS DENIED 13 $72,752 188 $55,940 368 $65,184 48 $13,599 0 $0 54 $52,000 APPLICATIONS WITHDRAWN 12 $88,301 60 $73,802 201 $72,891 7 $39,356 0 $0 11 $59,836 FILES CLOSED FOR INCOMPLETENESS 2 $57,790 10 $63,492 19 $65,886 1 $146,980 0 $0 5 $50,766
Aggregated Statistics For Year 2001(Based on 5 full and 4 partial tracts) A) FHA, FSA/RHS & VA B) Conventional C) Refinancings D) Home Improvement Loans E) Loans on Dwellings For 5+ Families F) Non-occupant Loans on Number Average Value Number Average Value Number Average Value Number Average Value Number Average Value Number Average Value
LOANS ORIGINATED 136 $79,956 315 $70,027 640 $70,844 78 $11,865 13 $728,410 139 $62,884 APPLICATIONS APPROVED, NOT ACCEPTED 0 $0 83 $69,549 119 $64,632 17 $14,137 0 $0 14 $48,534 APPLICATIONS DENIED 16 $77,916 151 $52,565 338 $73,602 51 $18,288 2 $2,192,080 33 $75,147 APPLICATIONS WITHDRAWN 16 $73,797 44 $53,885 193 $60,569 11 $17,337 0 $0 9 $47,001 FILES CLOSED FOR INCOMPLETENESS 1 $138,660 17 $60,104 51 $69,081 0 $0 0 $0 4 $45,020
Aggregated Statistics For Year 2000(Based on 5 full and 4 partial tracts) A) FHA, FSA/RHS & VA B) Conventional C) Refinancings D) Home Improvement Loans F) Non-occupant Loans on Number Average Value Number Average Value Number Average Value Number Average Value Number Average Value
LOANS ORIGINATED 151 $75,923 302 $61,940 318 $55,848 80 $17,440 102 $44,829 APPLICATIONS APPROVED, NOT ACCEPTED 18 $42,312 50 $51,441 75 $61,879 21 $13,547 11 $55,426 APPLICATIONS DENIED 27 $63,039 136 $53,225 259 $55,720 61 $13,244 21 $51,196 APPLICATIONS WITHDRAWN 21 $61,491 53 $69,895 149 $63,094 7 $17,674 1 $30,920 FILES CLOSED FOR INCOMPLETENESS 2 $78,385 27 $60,573 43 $61,768 0 $0 4 $67,465
Aggregated Statistics For Year 1999(Based on 4 full and 3 partial tracts) A) FHA, FSA/RHS & VA B) Conventional C) Refinancings D) Home Improvement Loans E) Loans on Dwellings For 5+ Families F) Non-occupant Loans on Number Average Value Number Average Value Number Average Value Number Average Value Number Average Value Number Average Value
LOANS ORIGINATED 83 $76,355 186 $74,969 281 $63,070 71 $19,228 1 $76,650 59 $56,982 APPLICATIONS APPROVED, NOT ACCEPTED 0 $0 49 $72,192 84 $67,931 15 $10,530 0 $0 3 $68,263 APPLICATIONS DENIED 13 $70,879 101 $58,472 153 $64,939 40 $11,142 0 $0 11 $62,468 APPLICATIONS WITHDRAWN 6 $61,370 36 $67,425 135 $62,658 9 $39,471 0 $0 1 $109,290 FILES CLOSED FOR INCOMPLETENESS 1 $71,050 20 $58,908 32 $56,948 0 $0 0 $0 3 $38,877
Private Mortgage Insurance Companies Aggregated Statistics For Year 2009(Based on 5 full and 4 partial tracts) A) Conventional B) Refinancings C) Non-occupant Loans on Number Average Value Number Average Value Number Average Value
LOANS ORIGINATED 22 $103,379 20 $115,488 2 $120,000 APPLICATIONS APPROVED, NOT ACCEPTED 4 $231,140 4 $244,750 2 $190,960 APPLICATIONS DENIED 2 $104,390 1 $99,840 0 $0 APPLICATIONS WITHDRAWN 3 $97,000 0 $0 0 $0 FILES CLOSED FOR INCOMPLETENESS 0 $0 2 $89,675 2 $89,675
Aggregated Statistics For Year 2008(Based on 5 full and 6 partial tracts) A) Conventional B) Refinancings C) Non-occupant Loans on Number Average Value Number Average Value Number Average Value
LOANS ORIGINATED 85 $105,771 34 $125,670 21 $94,648 APPLICATIONS APPROVED, NOT ACCEPTED 27 $132,890 11 $173,500 7 $107,269 APPLICATIONS DENIED 3 $152,397 8 $110,758 7 $94,099 APPLICATIONS WITHDRAWN 0 $0 2 $90,645 0 $0 FILES CLOSED FOR INCOMPLETENESS 9 $169,570 6 $84,892 9 $99,309
Aggregated Statistics For Year 2007(Based on 5 full and 6 partial tracts) A) Conventional B) Refinancings C) Non-occupant Loans on Number Average Value Number Average Value Number Average Value
LOANS ORIGINATED 246 $105,886 70 $106,484 23 $89,631 APPLICATIONS APPROVED, NOT ACCEPTED 34 $101,331 27 $113,089 8 $110,750 APPLICATIONS DENIED 8 $81,020 2 $122,000 1 $85,670 APPLICATIONS WITHDRAWN 6 $97,985 3 $125,000 3 $110,483 FILES CLOSED FOR INCOMPLETENESS 4 $79,600 2 $85,000 3 $77,800
Aggregated Statistics For Year 2006(Based on 5 full and 6 partial tracts) A) Conventional B) Refinancings C) Non-occupant Loans on Number Average Value Number Average Value Number Average Value
LOANS ORIGINATED 119 $95,432 47 $108,942 25 $84,314 APPLICATIONS APPROVED, NOT ACCEPTED 22 $100,177 13 $93,460 10 $104,268 APPLICATIONS DENIED 4 $109,290 4 $94,818 4 $98,290 APPLICATIONS WITHDRAWN 4 $91,275 8 $101,141 4 $84,300 FILES CLOSED FOR INCOMPLETENESS 0 $0 0 $0 0 $0
Aggregated Statistics For Year 2005(Based on 5 full and 6 partial tracts) A) Conventional B) Refinancings C) Non-occupant Loans on Number Average Value Number Average Value Number Average Value
LOANS ORIGINATED 115 $95,739 63 $96,927 25 $77,372 APPLICATIONS APPROVED, NOT ACCEPTED 23 $81,797 13 $102,322 4 $102,325 APPLICATIONS DENIED 2 $30,890 0 $0 0 $0 APPLICATIONS WITHDRAWN 4 $110,235 3 $82,250 2 $54,010 FILES CLOSED FOR INCOMPLETENESS 0 $0 0 $0 0 $0
Aggregated Statistics For Year 2004(Based on 5 full and 6 partial tracts) A) Conventional B) Refinancings C) Non-occupant Loans on Number Average Value Number Average Value Number Average Value
LOANS ORIGINATED 126 $89,410 68 $98,348 33 $84,283 APPLICATIONS APPROVED, NOT ACCEPTED 22 $85,276 26 $112,832 13 $80,665 APPLICATIONS DENIED 9 $63,838 5 $93,340 2 $108,000 APPLICATIONS WITHDRAWN 2 $61,105 8 $88,929 2 $60,780 FILES CLOSED FOR INCOMPLETENESS 2 $104,000 0 $0 2 $104,000
Aggregated Statistics For Year 2003(Based on 5 full and 6 partial tracts) A) Conventional B) Refinancings C) Non-occupant Loans on Number Average Value Number Average Value Number Average Value
LOANS ORIGINATED 179 $89,275 149 $87,509 20 $74,262 APPLICATIONS APPROVED, NOT ACCEPTED 8 $65,658 22 $81,243 6 $72,718 APPLICATIONS DENIED 1 $78,000 0 $0 0 $0 APPLICATIONS WITHDRAWN 7 $85,703 10 $81,090 2 $87,910 FILES CLOSED FOR INCOMPLETENESS 0 $0 0 $0 0 $0
Aggregated Statistics For Year 2002(Based on 5 full and 4 partial tracts) A) Conventional B) Refinancings C) Non-occupant Loans on Number Average Value Number Average Value Number Average Value
LOANS ORIGINATED 130 $80,844 122 $86,143 29 $73,151 APPLICATIONS APPROVED, NOT ACCEPTED 7 $70,259 30 $84,988 1 $77,050 APPLICATIONS DENIED 0 $0 0 $0 0 $0 APPLICATIONS WITHDRAWN 6 $69,218 5 $78,432 0 $0 FILES CLOSED FOR INCOMPLETENESS 2 $109,075 2 $69,500 0 $0
Aggregated Statistics For Year 2001(Based on 5 full and 4 partial tracts) A) Conventional B) Refinancings C) Non-occupant Loans on Number Average Value Number Average Value Number Average Value
LOANS ORIGINATED 108 $76,722 101 $82,428 25 $62,570 APPLICATIONS APPROVED, NOT ACCEPTED 19 $67,077 24 $94,317 8 $62,652 APPLICATIONS DENIED 0 $0 4 $165,000 1 $40,870 APPLICATIONS WITHDRAWN 1 $45,000 6 $54,802 1 $45,000 FILES CLOSED FOR INCOMPLETENESS 3 $67,163 4 $68,752 2 $70,745
Aggregated Statistics For Year 2000(Based on 5 full and 4 partial tracts) A) Conventional B) Refinancings C) Non-occupant Loans on Number Average Value Number Average Value Number Average Value
LOANS ORIGINATED 123 $74,382 34 $76,130 16 $51,187 APPLICATIONS APPROVED, NOT ACCEPTED 10 $71,142 0 $0 0 $0 APPLICATIONS DENIED 4 $82,855 2 $106,000 0 $0 APPLICATIONS WITHDRAWN 4 $87,110 1 $137,270 0 $0 FILES CLOSED FOR INCOMPLETENESS 2 $97,385 0 $0 1 $106,770
Aggregated Statistics For Year 1999(Based on 4 full and 3 partial tracts) A) Conventional B) Refinancings C) Non-occupant Loans on Number Average Value Number Average Value Number Average Value
LOANS ORIGINATED 70 $73,340 22 $80,050 7 $65,074 APPLICATIONS APPROVED, NOT ACCEPTED 2 $55,975 2 $76,190 0 $0 APPLICATIONS DENIED 1 $65,590 0 $0 0 $0 APPLICATIONS WITHDRAWN 3 $69,433 0 $0 0 $0 FILES CLOSED FOR INCOMPLETENESS 0 $0 0 $0 0 $0
2003 - 2018 National Fire Incident Reporting System (NFIRS) incidents See full 2006 National Fire Incident Reporting System statistics for zip code 37412, Tennessee
Most common first names in zip code 37412 among deceased individuals Name Count Lived (average)
William 235 72.4 years James 233 72.6 years Mary 210 78.3 years John 170 72.9 years Robert 140 70.4 years Charles 126 72.5 years George 89 72.4 years Margaret 81 76.3 years Ruth 65 79.9 years Dorothy 51 73.6 years
Most common last names in zip code 37412 among deceased individuals Last name Count Lived (average)
Smith 118 75.6 years Brown 56 75.1 years Davis 55 73.6 years Jones 52 76.7 years Johnson 52 73.8 years Williams 50 77.6 years Moore 41 74.2 years Martin 41 75.9 years Phillips 40 73.3 years Miller 36 75.2 years
Businesses in zip code 37412
Name Count Name Count
AMF Bowling 1 Knights Inn 1 Ace Hardware 1 Little Caesars Pizza 1 Advance Auto Parts 1 Long John Silver's 1 Arby's 1 Marriott 1 AutoZone 1 Motel 6 1 Blockbuster 1 Pizza Hut 1 Burger King 1 Quiznos 1 CVS 1 RadioShack 1 Clarion 1 Rite Aid 1 Comfort Inn 1 Ryan's Grill 1 Cracker Barrel 1 SONIC Drive-In 1 Cricket Wireless 1 Subway 2 Days Inn 1 Super 8 1 Econo Lodge 1 T-Mobile 1 FedEx 2 Taco Bell 1 H&R Block 2 U-Haul 2 Hardee's 1 UPS 1 Holiday Inn 1 Vans 1 Jones New York 1 Waffle House 1 KFC 1 Walgreens 2 Kmart 1 Wendy's 1
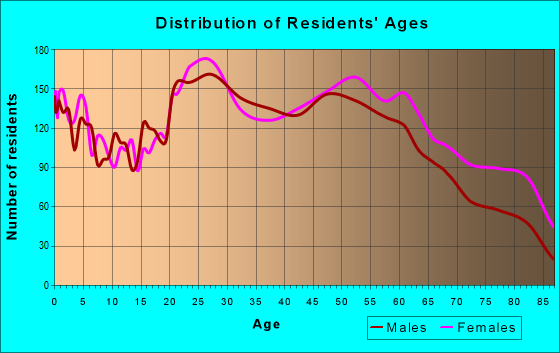
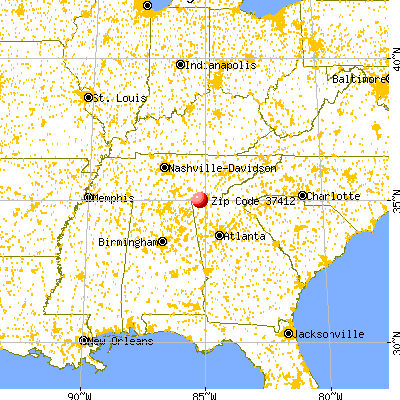


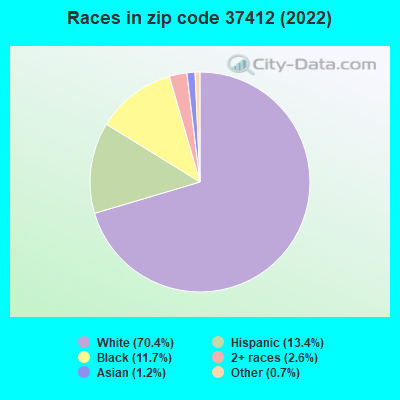


 Nearest zip codes: 37411, 30742, 37404, 37407, 30741, 37406.
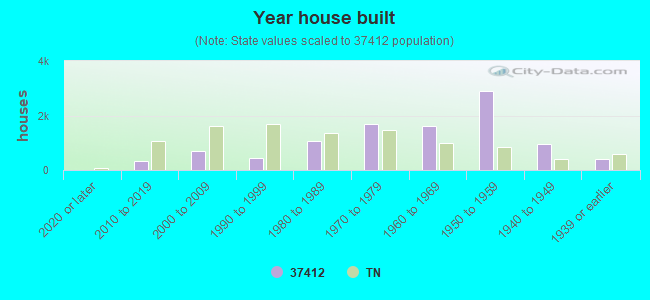

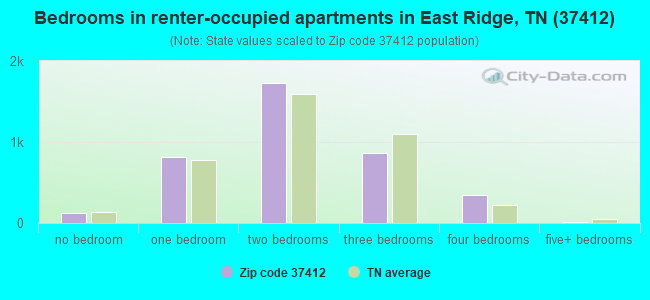
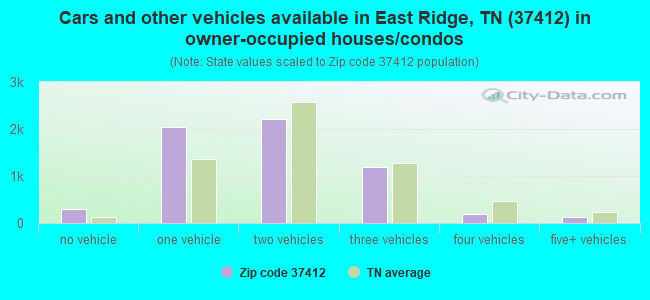
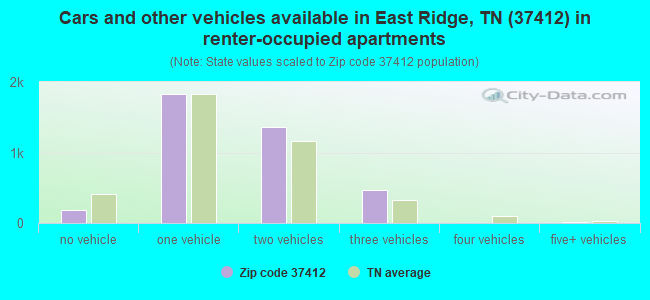


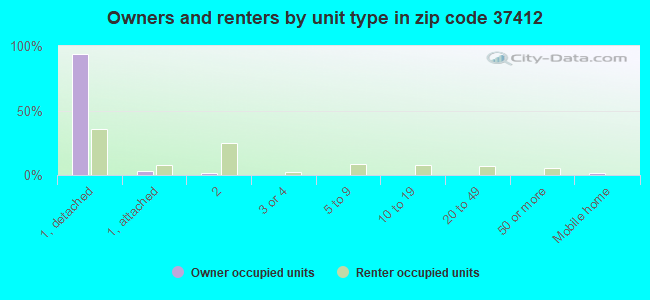
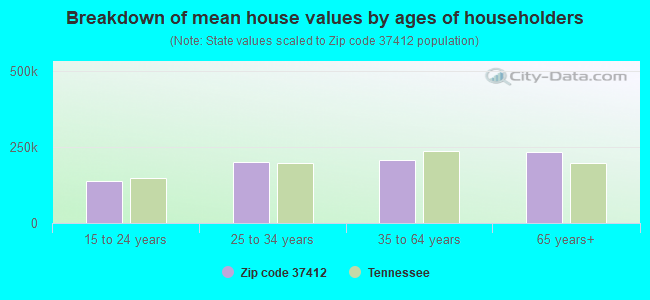


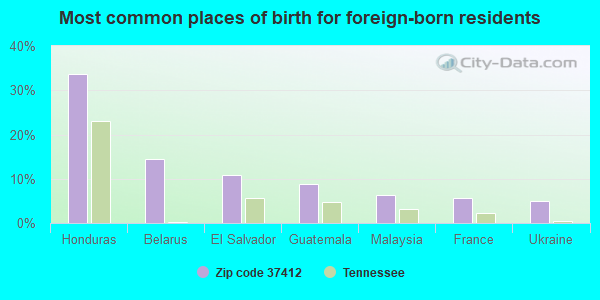

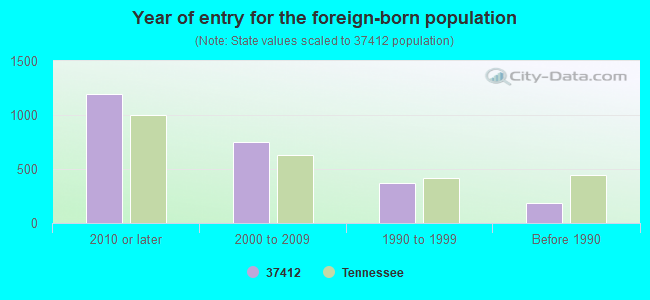


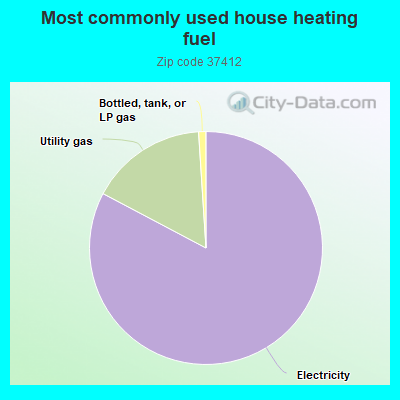
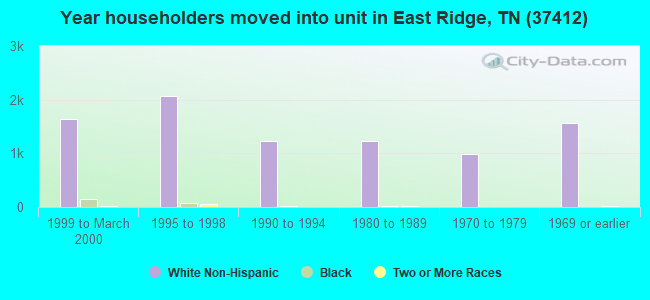
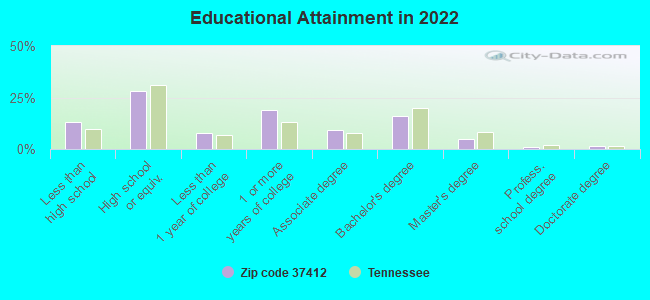
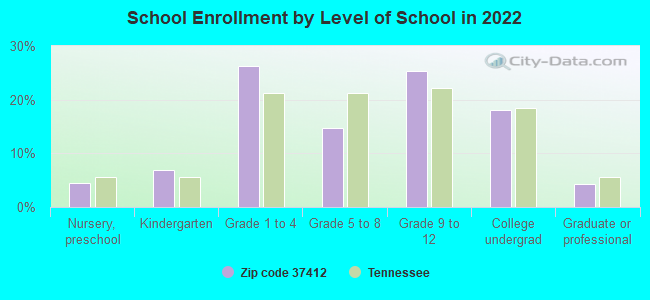
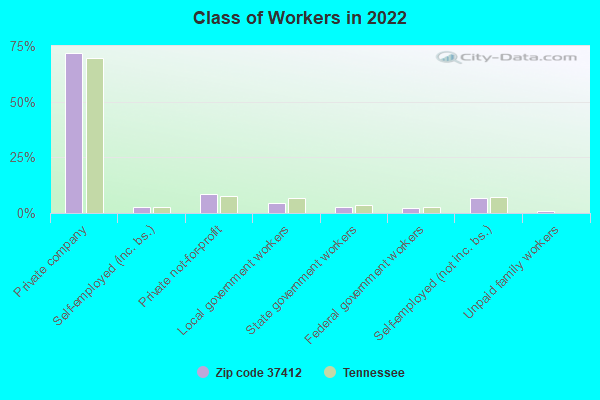
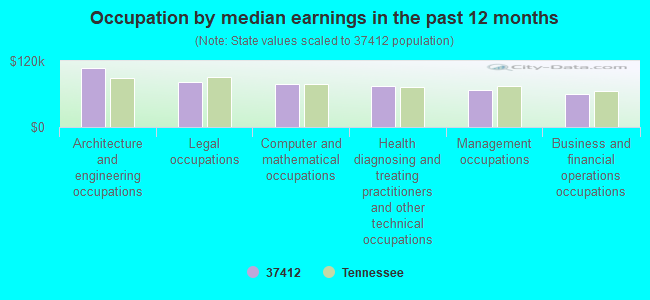
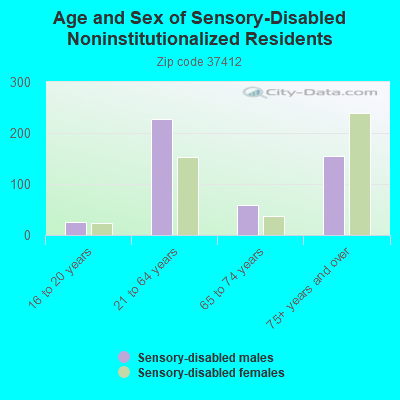

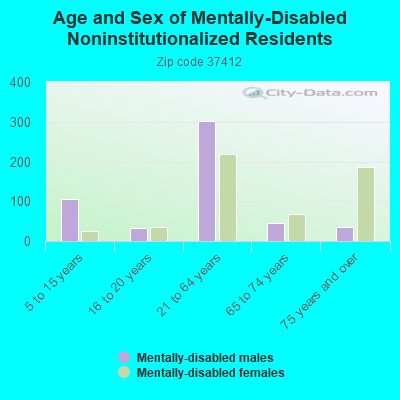
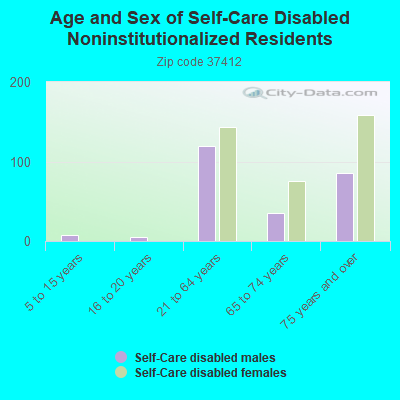
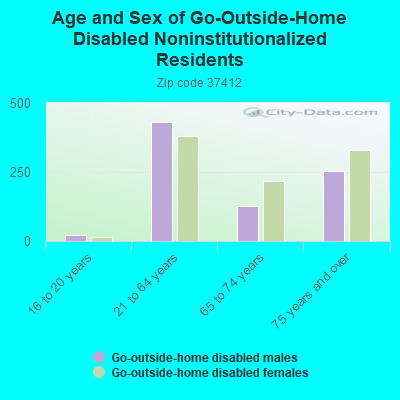
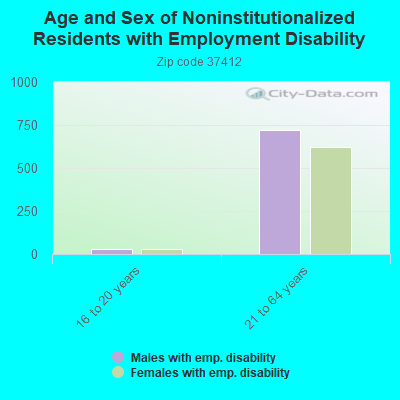

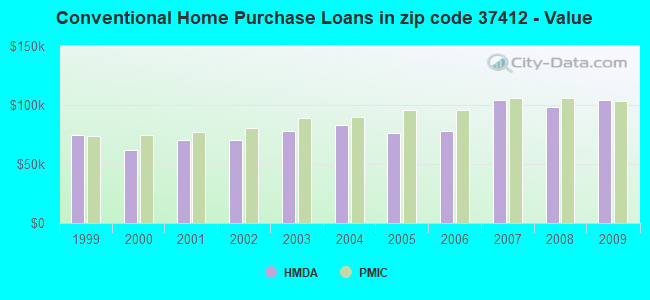
 Based on the data from the years 2003 - 2018 the average number of fire incidents per year is 117. The highest number of reported fire incidents - 155 took place in 2006, and the least - 83 in 2018. The data has a dropping trend.
 When looking into fire subcategories, the most incidents belonged to: Structure Fires (51.2%), and Outside Fires (33.7%).