East Ridge, TN (Tennessee) Houses and Residents
| East Ridge: | $197,924 |
| Tennessee: | $284,800 |
Mean price in 2022:
Detached houses: $258,020
Here: $258,020 State: $374,382 Townhouses or other attached units: $260,378
Here: $260,378 State: $354,101 In 2-unit structures: $155,362
Here: $155,362 State: $247,693 In 5-or-more-unit structures: $130,687
Here: $130,687 State: $317,434 Mobile homes: $311,770
Here: $311,770 State: $101,421
Total population: 21,317 (Urban population: 20,768, Rural population: 0)
Houses: 10,679 (9,830 occupied: 5,930 owner occupied, 3,881 renter occupied)
| % of renters here: | 40% |
| State: | 33% |
Housing density: 1,292 houses/condos per square mile
Median price asked for vacant for-sale houses and condos in 2022: $182,585.
Median contract rent in 2022: $960 (lower quartile is $768, upper quartile is $1,221)
Median rent asked for vacant for-rent units in 2022: $1,597
Median gross rent in East Ridge, TN in 2022: $1,123
Housing units in East Ridge with a mortgage: 3,968 (176 second mortgage, 43 home equity loan, 112 both second mortgage and home equity loan)
Houses without a mortgage: 26
Median household income for houses/condos with a mortgage: $74,278
Median household income for apartments without a mortgage: $42,291
Median monthly housing costs: $1,026
Compare current foreclosures near East Ridge, TN:
| Photo | Address | Area | Beds / Baths | Price | Details |
|---|---|---|---|---|---|

|
#1
Peavine Rd
Rock Spring, GA 30739
|
852 sq. feet
|
1 baths 2 beds |
$119,900
|
show details |

|
#2
Short Tail Springs Rd
Harrison, TN 37341
|
3,383 sq. feet
|
3 baths 4 beds |
$855,000
|
show details |

|
#3
Page Rd
Rossville, GA 30741
|
1,626 sq. feet
|
2 baths 3 beds |
show details | |

|
#4
Loblolly Ln
Tunnel Hill, GA 30755
|
3,528 sq. feet
|
4 baths 4 beds |
show details | |

|
#5
Dolores Dr
Hixson, TN 37343
|
1,671 sq. feet
|
2 baths 3 beds |
show details | |

|
#6
Everett Dr
Chattanooga, TN 37421
|
2,660 sq. feet
|
2 baths 5 beds |
show details | |

|
#7
Laura Ln
Ringgold, GA 30736
|
1,308 sq. feet
|
2 baths 3 beds |
show details | |

|
#8
Wiley Ave
Chattanooga, TN 37412
|
2,345 sq. feet
|
2 baths 4 beds |
show details | |

|
#9
Cuscowilla Trl
Chattanooga, TN 37415
|
1,608 sq. feet
|
2 baths 3 beds |
show details | |

|
#10
W Garden Farm Rd
Rossville, GA 30741
|
1,288 sq. feet
|
1 baths - beds |
show details |
| Photo | Address | Area | Beds / Baths | Price | Details |
|---|---|---|---|---|---|

|
#11
Courtland Dr
Hixson, TN 37343
|
2,376 sq. feet
|
2 baths - beds |
show details | |

|
#12
Love Ln
Hixson, TN 37343
|
912 sq. feet
|
1 baths - beds |
show details | |

|
#13
Long St
Cohutta, GA 30710
|
800 sq. feet
|
1 baths 2 beds |
show details | |

|
#14
Longview St
Hixson, TN 37343
|
1,710 sq. feet
|
2 baths - beds |
show details | |

|
#15
Eastview Ln
Ringgold, GA 30736
|
1,346 sq. feet
|
2 baths 3 beds |
show details | |

|
#16
Hickory Valley Rd
Chattanooga, TN 37421
|
1,189 sq. feet
|
1 baths - beds |
show details | |

|
#17
Flagstone Dr
Ooltewah, TN 37363
|
5,707 sq. feet
|
6 baths - beds |
show details | |

|
#18
Bernita Ln
Rocky Face, GA 30740
|
1,196 sq. feet
|
2 baths - beds |
show details | |

|
#19
Ruff Ln
Ringgold, GA 30736
|
- sq. feet
|
2 baths 3 beds |
show details | |

|
#20
Creek Rd
Wildwood, GA 30757
|
1,560 sq. feet
|
2 baths 3 beds |
show details |
| Photo | Address | Area | Beds / Baths | Price | Details |
|---|---|---|---|---|---|

|
#21
Ashmore Ave
Chattanooga, TN 37415
|
2,096 sq. feet
|
1 baths - beds |
show details | |

|
#22
Shirley Dr
Ringgold, GA 30736
|
1,560 sq. feet
|
2 baths - beds |
show details | |

|
#23
Old Mill Rd
Ringgold, GA 30736
|
1,622 sq. feet
|
1 baths - beds |
show details | |

|
#24
Robin Cir
Rossville, GA 30741
|
960 sq. feet
|
1 baths - beds |
show details | |

|
#25
Melody Ln
Ringgold, GA 30736
|
1,292 sq. feet
|
2 baths - beds |
show details | |

|
#26
Pin Oak Rd
Ringgold, GA 30736
|
1,832 sq. feet
|
4 baths - beds |
show details | |

|
#27
Castleview Dr
Ringgold, GA 30736
|
1,416 sq. feet
|
2 baths - beds |
show details | |

|
#28
Spencer St
Ringgold, GA 30736
|
2,548 sq. feet
|
4 baths - beds |
show details | |

|
#29
Dee Vue Ln
Rossville, GA 30741
|
1,150 sq. feet
|
1 baths - beds |
show details | |

|
#30
Williams Dr
Ringgold, GA 30736
|
1,748 sq. feet
|
2 baths - beds |
show details |
| Photo | Address | Area | Beds / Baths | Price | Details |
|---|---|---|---|---|---|

|
#31
Crabtree Rd
Rossville, GA 30741
|
1,570 sq. feet
|
2 baths - beds |
show details | |

|
#32
Virginia Ave
Rossville, GA 30741
|
1,254 sq. feet
|
1 baths - beds |
show details | |

|
#33
Salem Rd
Rossville, GA 30741
|
1,131 sq. feet
|
1 baths - beds |
show details | |

|
#34
Williams Ln
Rossville, GA 30741
|
1,140 sq. feet
|
1 baths - beds |
show details | |

|
#35
Joyce Ln
Rossville, GA 30741
|
1,080 sq. feet
|
1 baths - beds |
show details | |

|
#36
Daffron Rd
Ringgold, GA 30736
|
1,948 sq. feet
|
1 baths - beds |
show details | |

|
#37
Salem Rd
Rossville, GA 30741
|
672 sq. feet
|
1 baths - beds |
show details | |

|
#38
Vera Dr
Ringgold, GA 30736
|
984 sq. feet
|
1 baths - beds |
show details | |

|
#39
Debbie Ln
Ringgold, GA 30736
|
1,449 sq. feet
|
2 baths - beds |
show details | |

|
#40
Woodland Rd
Flintstone, GA 30725
|
1,116 sq. feet
|
1 baths - beds |
show details |
| Photo | Address | Area | Beds / Baths | Price | Details |
|---|---|---|---|---|---|

|
#41
Crest Cir
Ringgold, GA 30736
|
1,322 sq. feet
|
2 baths - beds |
show details | |

|
#42
Pine St
Rossville, GA 30741
|
1,144 sq. feet
|
1 baths - beds |
show details | |

|
#43
Osburn Rd
Chickamauga, GA 30707
|
1,092 sq. feet
|
2 baths - beds |
show details | |

|
#44
Brentwood Dr
Rossville, GA 30741
|
1,225 sq. feet
|
1 baths - beds |
show details | |

|
#45
Wilder St
Chickamauga, GA 30707
|
1,272 sq. feet
|
1 baths - beds |
show details | |

|
#46
W Circle Dr
Rossville, GA 30741
|
1,132 sq. feet
|
2 baths - beds |
show details | |

|
#47
Cody Dr
Ringgold, GA 30736
|
1,512 sq. feet
|
2 baths - beds |
show details | |

|
#48
Baggett Rd
Ringgold, GA 30736
|
1,196 sq. feet
|
2 baths - beds |
show details | |

|
#49
Wilder St
Chickamauga, GA 30707
|
906 sq. feet
|
1 baths - beds |
show details | |

|
Check over 1 million property listings on Foreclosure.com!
|
browse all offers | |||


 | Safe area to move to, but not too expensive to rent (5 replies) |
| EPB Fiber at Apartments? (4 replies) |
| Apartments or rentals in GOOD school areas- PLEASE give me some advice- DON'T HAVE MUCH TIME! (6 replies) |
| Moving to East Ridge...Teach me!!! (4 replies) |
| Property taxes- Hamilton county, Ooltewah address ? (2 replies) |
| 1 BR apartment options? (2 replies) |

Median year apartment built: 1975
Household type by relationship:
Households: 22,489- Male householders: 4,618 (1,645 living alone), Female householders: 5,134 (1,769 living alone)
3,922 spouses (3,876 opposite-sex spouses), 867 unmarried partners, (744 opposite-sex unmarried partners), 5,311 children (4,667 natural, 119 adopted, 524 stepchildren), 670 grandchildren, 90 brothers or sisters, 406 parents, 52 foster children, 345 other relatives, 881 non-relatives
- In group quarters: 188
Size of family households: 2,767 2-persons, 1,599 3-persons, 702 4-persons, 245 5-persons, 210 6-persons, 78 7-or-more-persons.
Size of nonfamily households: 3,271 1-person, 790 2-persons, 135 3-persons, 17 4-persons.
2,054 married couples with children.
1,450 single-parent households (254 men, 1,196 women).
86.6% of residents of East Ridge speak English at home.
9.9% of residents speak Spanish at home (35% speak English very well, 24% speak English well, 29% speak English not well, 12% don't speak English at all).
2.4% of residents speak other Indo-European language at home (78% speak English very well, 11% speak English well, 2% speak English not well, 9% don't speak English at all).
0.7% of residents speak Asian or Pacific Island language at home (88% speak English very well, 5% speak English well, 7% speak English not well).
0.2% of residents speak other language at home (32% speak English very well, 44% speak English well, 24% speak English not well).
Foreign born population: 1,943 (8.6%)
(37.9% of them are naturalized citizens)
| Here: | 6.2 |
| State: | 6.5 |
| Here: | 4.5 |
| State: | 4.4 |

- Bedrooms in owner-occupied houses and condos in East Ridge, Tennessee
- 38no bedroom
- 1511 bedroom
- 1,5572 bedrooms
- 3,1333 bedrooms
- 7754 bedrooms
- 2765+ bedrooms

- Bedrooms in renter-occupied apartments in East Ridge, Tennessee
- 113no bedroom
- 7841 bedroom
- 1,7702 bedrooms
- 8883 bedrooms
- 3194 bedrooms
- 75+ bedrooms

- Cars and other vehicles available in East Ridge in owner-occupied houses/condos
- 290no vehicle
- 2,0601 vehicle
- 2,0842 vehicles
- 1,1773 vehicles
- 2094 vehicles
- 1115+ vehicles

- Cars and other vehicles available in East Ridge in renter-occupied apartments
- 199no vehicle
- 1,8581 vehicle
- 1,3632 vehicles
- 4473 vehicles
- 04 vehicles
- 145+ vehicles

- Rooms in owner-occupied houses in East Ridge, Tennessee
- 381 room
- 1192 rooms
- 533 rooms
- 4804 rooms
- 1,5515 rooms
- 1,4516 rooms
- 1,0067 rooms
- 5568 rooms
- 6769+ rooms

- Rooms in renter-occupied apartments in East Ridge, Tennessee
- 1131 room
- 1982 rooms
- 6083 rooms
- 9314 rooms
- 6265 rooms
- 9586 rooms
- 2337 rooms
- 1108 rooms
- 1059+ rooms


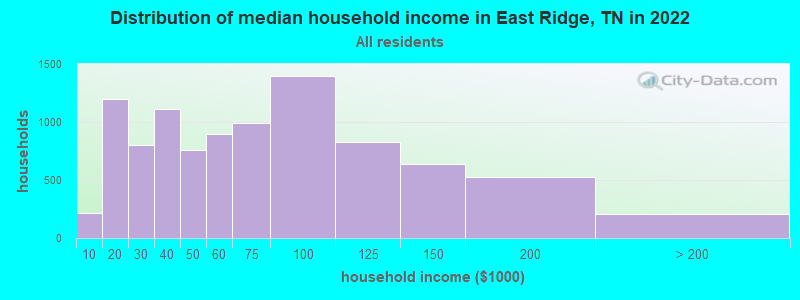
East Ridge, TN household income distribution

- 217Less than $10,000
- 1,199$10,000 to $19,999
- 801$20,000 to $29,999
- 1,110$30,000 to $39,999
- 759$40,000 to $49,999
- 896$50,000 to $59,999
- 994$60,000 to $74,999
- 1,399$75,000 to $99,999
- 828$100,000 to $124,999
- 637$125,000 to $149,999
- 527$150,000 to $199,999
- 208$200,000 or more
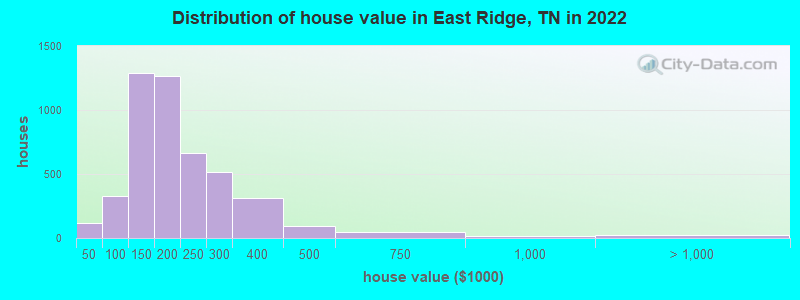
Home value of owner - occupied houses in 2022 in East Ridge, TN
-
- 58$10,000 to $14,999
- 2$15,000 to $19,999
- 7$20,000 to $24,999
- 32$25,000 to $29,999
- 18$40,000 to $49,999
- 28$60,000 to $69,999
- 117$70,000 to $79,999
- 66$80,000 to $89,999
- 101$90,000 to $99,999
- 690$100,000 to $124,999
- 596$125,000 to $149,999
- 769$150,000 to $174,999
- 493$175,000 to $199,999
- 665$200,000 to $249,999
- 513$250,000 to $299,999
- 313$300,000 to $399,999
- 96$400,000 to $499,999
- 45$500,000 to $749,999
- 17$750,000 to $999,999
- 27$1,000,000 to $1,499,999
Rent paid by renters in 2022 in East Ridge, TN
-
- 35$150 to $199
- 14$300 to $349
- 24$350 to $399
- 19$400 to $449
- 45$450 to $499
- 38$500 to $549
- 131$550 to $599
- 169$600 to $649
- 310$650 to $699
- 182$700 to $749
- 74$750 to $799
- 772$800 to $899
- 267$900 to $999
- 601$1,000 to $1,249
- 256$1,250 to $1,499
- 136$1,500 to $1,999
- 308$2,000 to $2,499
- 21$2,500 to $2,999
- 57$3,500 or more
- 69No cash rent


Percentage of workers working in this county: 90.2%
Number of people working at home: 1,979 (16.8% of all workers)
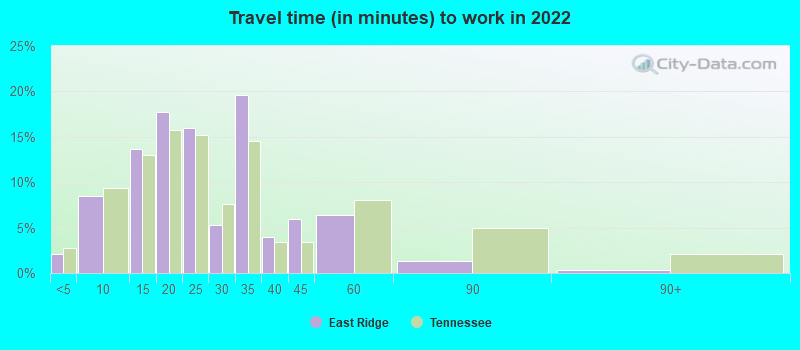
Travel time to work (commute)
- Less than 5 minutes: 198
- 5 to 9 minutes: 713
- 10 to 14 minutes: 1,649
- 15 to 19 minutes: 2,712
- 20 to 24 minutes: 2,386
- 25 to 29 minutes: 503
- 30 to 34 minutes: 1,044
- 35 to 39 minutes: 99
- 40 to 44 minutes: 55
- 45 to 59 minutes: 328
- 60 to 89 minutes: 47
- 90 or more minutes: 116
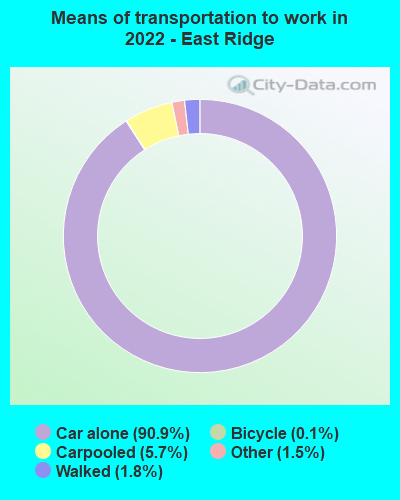
Means of transportation to work:
- Drove a car alone: 4,346 (67.9%)
- Carpooled: 287 (4.5%)
- Taxi: 81 (1.3%)
- Bicycle: 9 (0.1%)
- Walked: 74 (1.2%)
- Worked at home: 1,979 (30.9%)

- Unemployment by race in 2022
- Unemployment rate for White non-Hispanic residents
- 3.4%Males
- 4.7%Females
- Unemployment rate for Black residents
- 8.8%Females
- Unemployment rate for Asian residents
- 14.4%Females
- Unemployment rate for other race residents
- 15.3%Males
- Unemployment rate for two or more race residents
- 32.4%Females
- Unemployment rate for Hispanic or Latino residents
- 5.0%Males
- 1.7%Females

- Year of entry for the foreign-born population in East Ridge, Tennessee
- 9172010 or later
- 7362000 to 2009
- 3161990 to 1999
- 311980 to 1989
- 1141970 to 1979
- 97Before 1970

First ancestries reported:
- American: 1,939 (16.6%)
- English: 1,606 (13.7%)
- Irish: 1,198 (10.2%)
- German: 938 (8.0%)
- Yugoslavian: 711 (6.1%)
- Italian: 311 (2.7%)
- European: 274 (2.3%)
- Scottish: 160 (1.4%)
- Scotch-Irish: 117 (1.0%)
- Greek: 67 (0.6%)
- French: 55 (0.5%)
- African: 45 (0.4%)
- Maltese: 42 (0.4%)
- Scandinavian: 42 (0.4%)
- French Canadian: 41 (0.4%)
- Dutch: 33 (0.3%)
- Eastern European: 25 (0.2%)
- Luxembourger: 25 (0.2%)
- Swiss: 25 (0.2%)
- Egyptian: 19 (0.2%)
- Norwegian: 16 (0.1%)
- Iranian: 15 (0.1%)
- New Zealander: 12 (0.1%)
- Ugandan: 11 (0.09%)
- Welsh: 11 (0.09%)
- Syrian: 10 (0.09%)
- Swedish: 4 (0.03%)
- Australian: 3 (0.03%)
Most common places of birth for foreign-born residents (%):
| East Ridge: | 34.0% (715) |
| Tennessee: | 23.0% (86,435) |
| East Ridge: | 13.0% (273) |
| Tennessee: | 0.3% (1,183) |
| East Ridge: | 11.1% (234) |
| Tennessee: | 5.7% (21,286) |
| East Ridge: | 8.9% (186) |
| Tennessee: | 4.6% (17,433) |
| East Ridge: | 6.5% (136) |
| Tennessee: | 3.1% (11,640) |
| East Ridge: | 5.7% (120) |
| Tennessee: | 2.2% (8,261) |
| East Ridge: | 5.0% (106) |
| Tennessee: | 0.4% (1,462) |
| East Ridge: | 2.4% (50) |
| Tennessee: | 6.1% (23,079) |
| East Ridge: | 1.8% (38) |
| Tennessee: | 2.7% (10,313) |
| East Ridge: | 1.8% (37) |
| Tennessee: | 0.3% (1,137) |
| East Ridge: | 1.7% (36) |
| Tennessee: | 2.4% (8,894) |
Place of birth for U.S.-born residents:
- This state: 12,015
- Other state: 8,168
- Northeast: 1,123
- Midwest: 1,762
- South: 4,453
- West: 834
86.9% of East Ridge residents lived in the same house 1 years ago.
Out of people who lived in different houses, 34.9% lived in this county.
Out of people who lived in different counties, 35.1% lived in Tennessee.
| East Ridge: | 86.9% |
| State average: | 87.0% |
Education attainment for males 25 years and older:
- No schooling: 166
- Nursery to 4th grade: 0
- 5th and 6th grade: 98
- 7th and 8th grade: 106
- 9th grade: 146
- 10th grade: 125
- 11th grade: 43
- 12th grade, no diploma: 101
- High school graduate (or equivalency): 2,089
- Less than 1 year of college: 750
- Some college more than 1 year, no degree: 1,735
- Associate degree: 755
- Bachelor's degree: 1,225
- Master's degree: 395
- Professional school degree: 62
- Doctorate degree: 47

Education attainment for females 25 years and older:
- No schooling: 222
- Nursery to 4th grade: 148
- 5th and 6th grade: 169
- 7th and 8th grade: 72
- 9th grade: 131
- 10th grade: 112
- 11th grade: 117
- 12th grade, no diploma: 107
- High school graduate (or equivalency): 2,271
- Less than 1 year of college: 450
- Some college more than 1 year, no degree: 1,745
- Associate degree: 713
- Bachelor's degree: 1,346
- Master's degree: 444
- Professional school degree: 154
- Doctorate degree: 173


Housing units in structures:
- One, detached: 7,295
- One, attached: 533
- Two: 1,175
- 3 or 4: 162
- 5 to 9: 473
- 10 to 19: 300
- 20 to 49: 399
- 50 or more: 265
- Mobile homes: 74
Median worth of mobile homes: $83,373
Housing units lacking complete kitchen facilities in 2022: 1.9%
House/condo owner moved in on average 14 years ago
Renter moved in on average 3 years ago

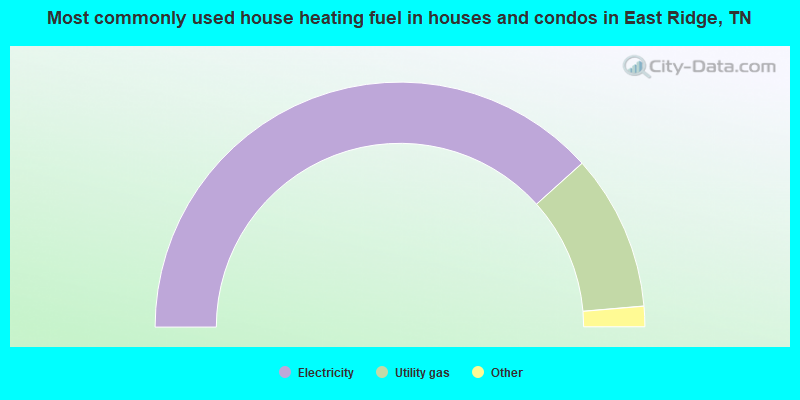
- 76.7%Electricity
- 20.6%Utility gas
- 1.3%Bottled, tank, or LP gas
- 0.6%No fuel used
- 0.6%Wood
- 0.1%Solar energy
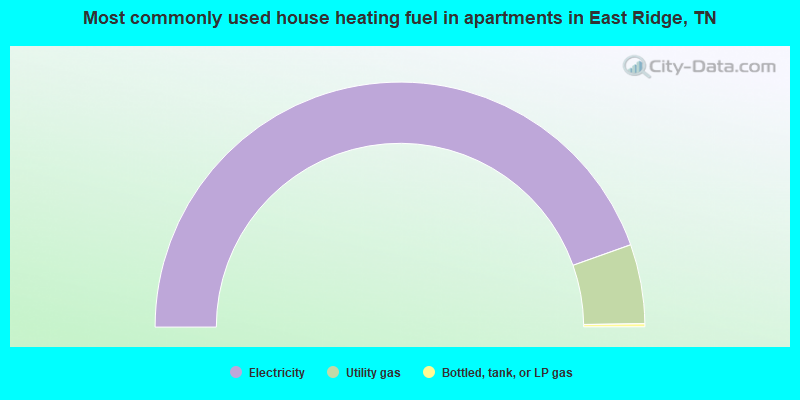
- 89.1%Electricity
- 10.5%Utility gas
- 0.4%Bottled, tank, or LP gas
Private vs. public school enrollment:
| Here: | 10.5% |
| Tennessee: | 15.0% |
| Here: | 15.6% |
| Tennessee: | 16.2% |
| Here: | 11.6% |
| Tennessee: | 23.5% |


