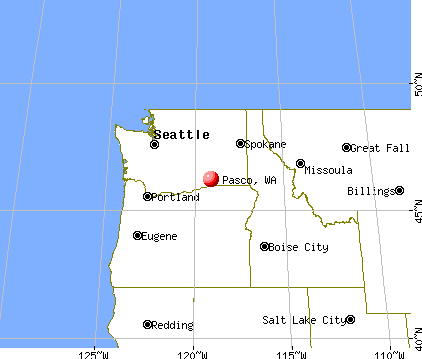
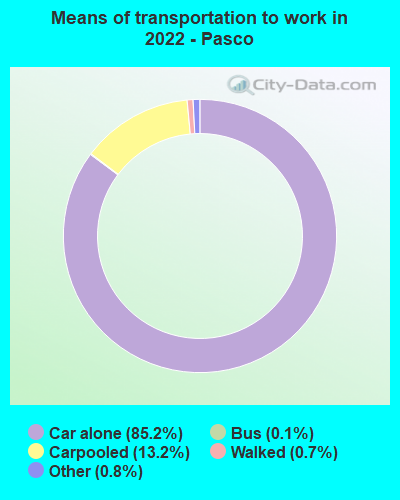
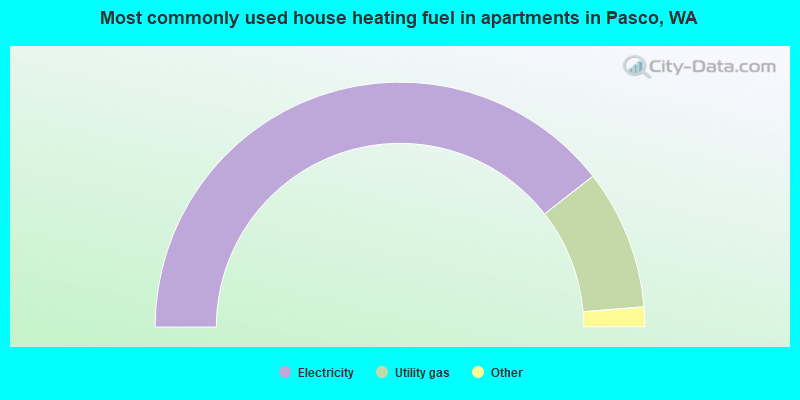
Pasco, Washington
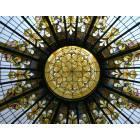
Pasco: Franklin County courthouse dome interior 2008

Pasco: Cable Bridge

Pasco: Franklin County courthouse dome exterior 2008
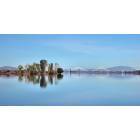
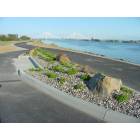
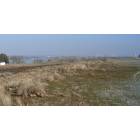
Pasco: Taken from Sacajewea Park
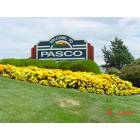
Pasco: Welcoming Sign to City of Pasco
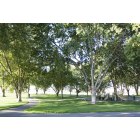
Pasco: Pasco's Chiawana Park
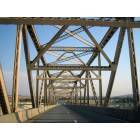
Pasco: bridge over the Columbia
Pasco: Heritage Trail, Pasco, Washington
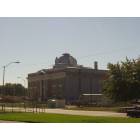
Pasco: Franklin County Courthouse - Pasco 9/04
Pasco: View from Kennewick Highlands of Bridges into Pasco
Pasco: Pasco "skyline" 9/04
- add
your
Submit your own pictures of this city and show them to the world
- OSM Map
- General Map
- Google Map
- MSN Map
Population change since 2000: +147.3%
| Males: 40,272 | |
| Females: 39,043 |
| Median resident age: | 30.5 years |
| Washington median age: | 38.4 years |
Zip codes: 99301.
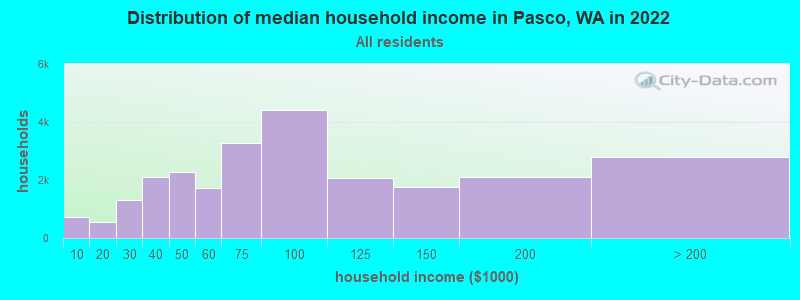
| Pasco: | $76,499 |
| WA: | $91,306 |
Estimated per capita income in 2022: $32,587 (it was $13,404 in 2000)
Pasco city income, earnings, and wages data
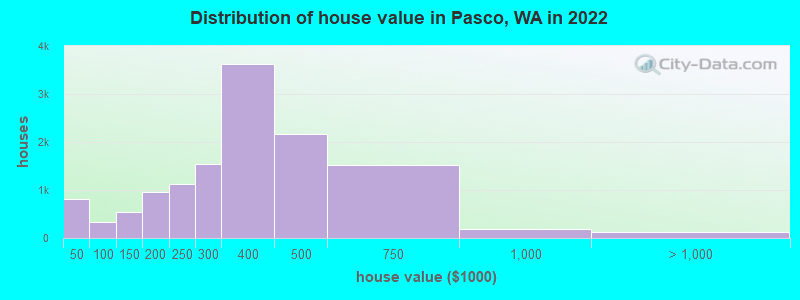
Estimated median house or condo value in 2022: $377,600 (it was $86,500 in 2000)
| Pasco: | $377,600 |
| WA: | $569,500 |
Median gross rent in 2022: $1,269.
(8.0% for White Non-Hispanic residents, 28.3% for Black residents, 10.9% for Hispanic or Latino residents, 23.3% for American Indian residents, 6.1% for Native Hawaiian and other Pacific Islander residents, 17.0% for other race residents, 12.8% for two or more races residents)
Detailed information about poverty and poor residents in Pasco, WA


Compare current foreclosures in Pasco, WA:
| Photo | Address | Area | Beds / Baths | Price | Details |
|---|---|---|---|---|---|

|
#1
W Ella St
Pasco, WA 99301
|
2,068 sq. feet
|
3 baths 3 beds |
show details | |

|
#2
W Margaret St
Pasco, WA 99301
|
1,072 sq. feet
|
1 baths 2 beds |
show details | |

|
#3
Ronan St
Pasco, WA 99301
|
- sq. feet
|
2 baths 3 beds |
show details | |

|
#4
E Foster Wells Rd
Pasco, WA 99301
|
- sq. feet
|
2 baths 3 beds |
show details | |

|
#5
Saguaro Dr
Pasco, WA 99301
|
1,429 sq. feet
|
2 baths 3 beds |
show details | |

|
#6
Quatsino Dr
Pasco, WA 99301
|
2,137 sq. feet
|
2 baths 4 beds |
show details | |

|
#7
Quadra Dr
Pasco, WA 99301
|
2,232 sq. feet
|
2 baths 4 beds |
show details | |

|
#8
W Margaret St
Pasco, WA 99301
|
1,127 sq. feet
|
1 baths 3 beds |
show details | |

|
#9
Galiano Dr
Pasco, WA 99301
|
2,501 sq. feet
|
2 baths 4 beds |
show details | |

|
#10
W Seabrook Ct
Pasco, WA 99301
|
1,348 sq. feet
|
3 baths 4 beds |
show details |
| Photo | Address | Area | Beds / Baths | Price | Details |
|---|---|---|---|---|---|

|
#11
W Brown St
Pasco, WA 99301
|
1,126 sq. feet
|
1 baths 3 beds |
show details | |

|
#12
W Nixon St
Pasco, WA 99301
|
1,264 sq. feet
|
2 baths 3 beds |
show details | |

|
#13
Quail Rd
Pasco, WA 99301
|
1,620 sq. feet
|
2 baths 2 beds |
show details | |

|
#14
Kau Trl
Pasco, WA 99301
|
1,568 sq. feet
|
2 baths 3 beds |
show details | |

|
#15
N Road 32
Pasco, WA 99301
|
1,300 sq. feet
|
2 baths 3 beds |
show details | |

|
#16
Mojave Dr
Pasco, WA 99301
|
1,717 sq. feet
|
2 baths 3 beds |
show details | |

|
#17
N Road 40
Pasco, WA 99301
|
1,412 sq. feet
|
1 baths 3 beds |
show details | |

|
#18
Hayes Ln
Pasco, WA 99301
|
1,930 sq. feet
|
2 baths 4 beds |
show details | |

|
#19
N 9th Ave
Pasco, WA 99301
|
836 sq. feet
|
1 baths 2 beds |
show details | |

|
#20
W Wernett Rd
Pasco, WA 99301
|
1,547 sq. feet
|
2 baths 3 beds |
show details |
| Photo | Address | Area | Beds / Baths | Price | Details |
|---|---|---|---|---|---|

|
#21
N Sycamore Ave
Pasco, WA 99301
|
1,320 sq. feet
|
2 baths 3 beds |
show details | |

|
#22
W Park St
Pasco, WA 99301
|
1,088 sq. feet
|
1 baths 2 beds |
show details | |

|
#23
Kalahari Dr
Pasco, WA 99301
|
1,144 sq. feet
|
2 baths 3 beds |
show details | |

|
#24
Desert Dr
Pasco, WA 99301
|
1,728 sq. feet
|
2 baths 3 beds |
show details | |

|
#25
Tottenham Ct
Pasco, WA 99301
|
960 sq. feet
|
2 baths 4 beds |
show details | |

|
#26
W Bonneville St
Pasco, WA 99301
|
1,400 sq. feet
|
2 baths 3 beds |
show details | |

|
#27
Maryhill Ln
Pasco, WA 99301
|
1,632 sq. feet
|
2 baths 3 beds |
show details | |

|
#28
W A St
Pasco, WA 99301
|
2,372 sq. feet
|
3 baths 5 beds |
show details | |

|
#29
Janet Rd
Pasco, WA 99301
|
1,207 sq. feet
|
1 baths 3 beds |
show details | |

|
#30
Quadra Dr
Pasco, WA 99301
|
2,232 sq. feet
|
2 baths 4 beds |
show details |
| Photo | Address | Area | Beds / Baths | Price | Details |
|---|---|---|---|---|---|

|
#31
Robert Wayne Dr
Pasco, WA 99301
|
1,556 sq. feet
|
2 baths 3 beds |
show details | |

|
#32
Clearview Rd
Pasco, WA 99301
|
1,803 sq. feet
|
2 baths 3 beds |
show details | |

|
#33
W Pearl St
Pasco, WA 99301
|
1,050 sq. feet
|
2 baths 3 beds |
show details | |

|
#34
N 15th Ave
Pasco, WA 99301
|
1,030 sq. feet
|
1 baths 3 beds |
show details | |

|
#35
W Nixon St
Pasco, WA 99301
|
1,264 sq. feet
|
2 baths 3 beds |
show details | |

|
#36
W Richardson Rd
Pasco, WA 99301
|
1,570 sq. feet
|
3 baths 3 beds |
show details | |

|
#37
Galiano Dr
Pasco, WA 99301
|
2,501 sq. feet
|
2 baths 4 beds |
show details | |

|
#38
W Marie St
Pasco, WA 99301
|
1,328 sq. feet
|
1 baths 3 beds |
show details | |

|
#39
S Railroad Ave
Pasco, WA 99301
|
1,200 sq. feet
|
1 baths 3 beds |
show details | |

|
#40
W Shoshone St
Pasco, WA 99301
|
1,092 sq. feet
|
2 baths 3 beds |
show details |
| Photo | Address | Area | Beds / Baths | Price | Details |
|---|---|---|---|---|---|

|
#41
Anza Borrego Ct
Pasco, WA 99301
|
1,818 sq. feet
|
2 baths 3 beds |
show details | |

|
#42
Messara Ln
Pasco, WA 99301
|
1,092 sq. feet
|
2 baths 3 beds |
show details | |

|
#43
N 16th Ave
Pasco, WA 99301
|
912 sq. feet
|
1 baths 3 beds |
show details | |

|
#44
N Elm Ave
Pasco, WA 99301
|
2,169 sq. feet
|
2 baths 4 beds |
show details | |

|
#45
N Douglas Ave
Pasco, WA 99301
|
1,140 sq. feet
|
2 baths 4 beds |
show details | |

|
#46
Montgomery Ln
Pasco, WA 99301
|
- sq. feet
|
- baths - beds |
show details | |

|
#47
Salmon Dr
Pasco, WA 99301
|
- sq. feet
|
- baths - beds |
show details | |

|
#48
Chapel Hill Blvd Apt R102
Pasco, WA 99301
|
- sq. feet
|
- baths - beds |
show details | |

|
#49
Providence Ln
Pasco, WA 99301
|
- sq. feet
|
- baths - beds |
show details | |

|
Check over 1 million property listings on Foreclosure.com!
|
browse all offers | |||


- 46,35657.8%Hispanic
- 27,95534.9%White alone
- 2,2572.8%Two or more races
- 1,4971.9%Asian alone
- 1,2181.5%Other race alone
- 5270.7%Black alone
- 3950.5%American Indian alone
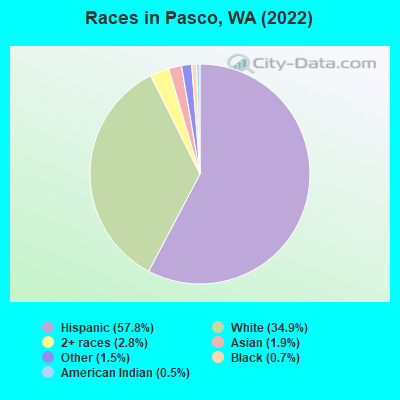
Races in Pasco detailed stats: ancestries, foreign born residents, place of birth
According to our research of Washington and other state lists, there were 40 registered sex offenders living in Pasco, Washington as of June 10, 2024.
The ratio of all residents to sex offenders in Pasco is 1,798 to 1.
The ratio of registered sex offenders to all residents in this city is lower than the state average.
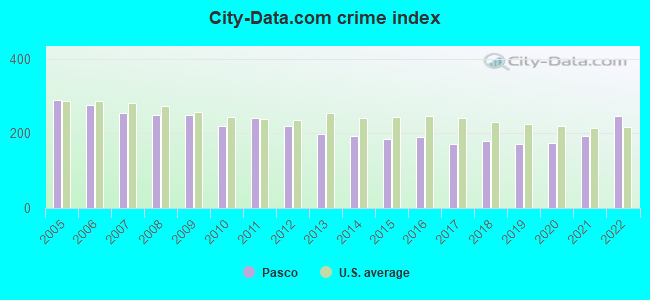
The City-Data.com crime index weighs serious crimes and violent crimes more heavily. Higher means more crime, U.S. average is 246.1. It adjusts for the number of visitors and daily workers commuting into cities.
- means the value is smaller than the state average.- means the value is about the same as the state average.
- means the value is bigger than the state average.
- means the value is much bigger than the state average.
Crime rate in Pasco detailed stats: murders, rapes, robberies, assaults, burglaries, thefts, arson
Full-time law enforcement employees in 2021, including police officers: 92 (82 officers - 79 male; 3 female).
| Officers per 1,000 residents here: | 1.04 |
| Washington average: | 1.35 |
 Recent articles from our blog. Our writers, many of them Ph.D. graduates or candidates, create easy-to-read articles on a wide variety of topics.

 | 8,000+ new homes in West Pasco? (13 replies) |
| Tri-Cities approaching 300K (78 replies) |
| Do the Tri-cities trend liberal or conservative? (57 replies) |
| Villages at Chapel Hill apartments - Pasco (0 replies) |
| What is going in here... (43 replies) |
| Is East Pasco more dangerous today or back in the 20th Century? (2 replies) |
Latest news from Pasco, WA collected exclusively by city-data.com from local newspapers, TV, and radio stations
Ancestries: German (3.8%), American (3.5%), English (3.1%), Ukrainian (2.5%), European (2.5%), Irish (1.9%).
Current Local Time: PST time zone
Incorporated in 1891
Elevation: 383 feet
Land area: 28.1 square miles.
Population density: 2,824 people per square mile (average).
17,693 residents are foreign born (18.4% Latin America).
| This city: | 22.4% |
| Washington: | 14.9% |
Median real estate property taxes paid for housing units with mortgages in 2022: $2,552 (0.6%)
Median real estate property taxes paid for housing units with no mortgage in 2022: $2,687 (0.8%)
Nearest city with pop. 50,000+: Kennewick, WA  (3.4 miles , pop. 54,693).
Nearest city with pop. 200,000+: East Seattle, WA (173.0 miles , pop. 480,100).
Nearest city with pop. 1,000,000+: Los Angeles, CA (841.4 miles , pop. 3,694,820).
Nearest cities:
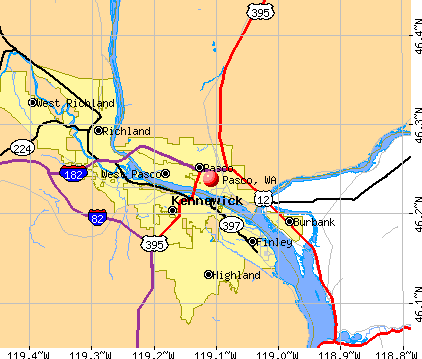
), Latitude: 46.24 N, Longitude: 119.11 W
Daytime population change due to commuting: -8,239 (-10.3%)
Workers who live and work in this city: 14,269 (38.8%)
Area code: 509

Pasco tourist attractions:
Pasco, Washington accommodation & food services, waste management - Economy and Business Data
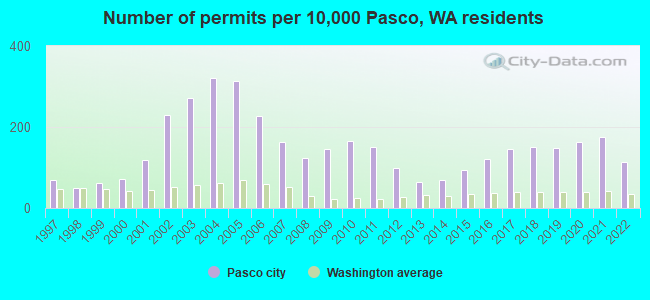
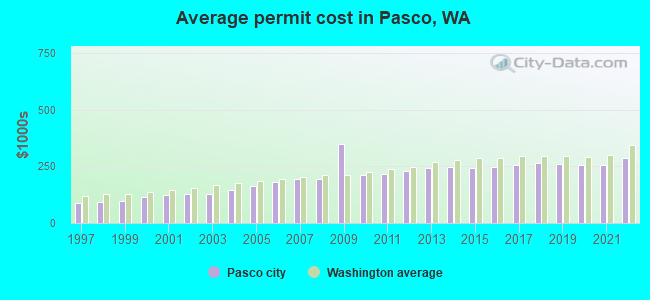
Single-family new house construction building permits:
- 2022: 363 buildings, average cost: $286,800
- 2021: 563 buildings, average cost: $256,700
- 2020: 525 buildings, average cost: $255,400
- 2019: 477 buildings, average cost: $260,500
- 2018: 485 buildings, average cost: $264,200
- 2017: 468 buildings, average cost: $255,100
- 2016: 387 buildings, average cost: $245,100
- 2015: 305 buildings, average cost: $240,500
- 2014: 219 buildings, average cost: $246,100
- 2013: 205 buildings, average cost: $244,400
- 2012: 314 buildings, average cost: $231,000
- 2011: 483 buildings, average cost: $218,200
- 2010: 530 buildings, average cost: $209,900
- 2009: 467 buildings, average cost: $347,100
- 2008: 398 buildings, average cost: $195,600
- 2007: 518 buildings, average cost: $194,600
- 2006: 729 buildings, average cost: $182,500
- 2005: 1008 buildings, average cost: $163,400
- 2004: 1031 buildings, average cost: $144,400
- 2003: 871 buildings, average cost: $128,900
- 2002: 738 buildings, average cost: $126,300
- 2001: 380 buildings, average cost: $122,000
- 2000: 228 buildings, average cost: $113,000
- 1999: 194 buildings, average cost: $97,900
- 1998: 160 buildings, average cost: $92,400
- 1997: 217 buildings, average cost: $90,100
| Here: | 7.1% |
| Washington: | 4.6% |
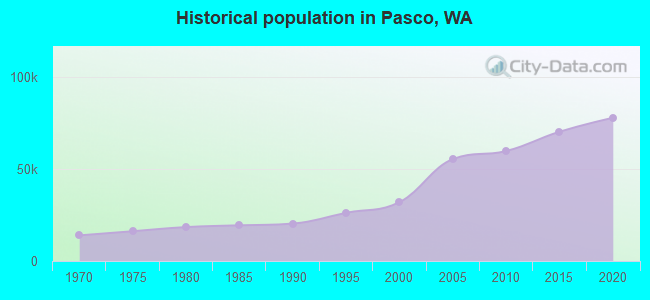
Population change in the 1990s: +8,359 (+35.3%).
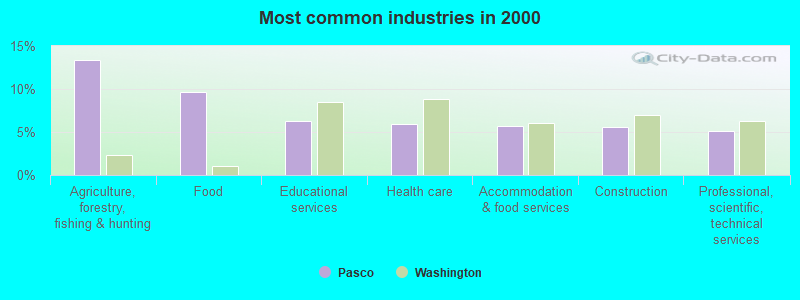
- Agriculture, forestry, fishing & hunting (13.3%)
- Food (9.7%)
- Educational services (6.3%)
- Health care (5.9%)
- Accommodation & food services (5.7%)
- Construction (5.6%)
- Professional, scientific, technical services (5.1%)
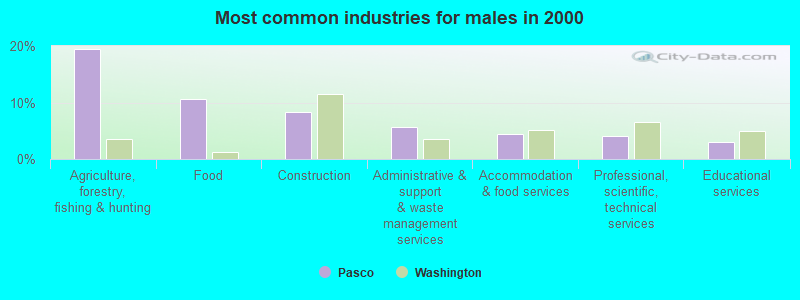
- Agriculture, forestry, fishing & hunting (19.5%)
- Food (10.7%)
- Construction (8.4%)
- Administrative & support & waste management services (5.7%)
- Accommodation & food services (4.4%)
- Professional, scientific, technical services (4.2%)
- Educational services (3.1%)
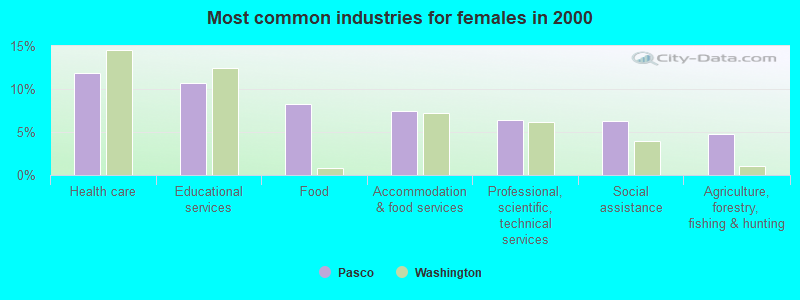
- Health care (11.8%)
- Educational services (10.6%)
- Food (8.3%)
- Accommodation & food services (7.5%)
- Professional, scientific, technical services (6.5%)
- Social assistance (6.3%)
- Agriculture, forestry, fishing & hunting (4.8%)
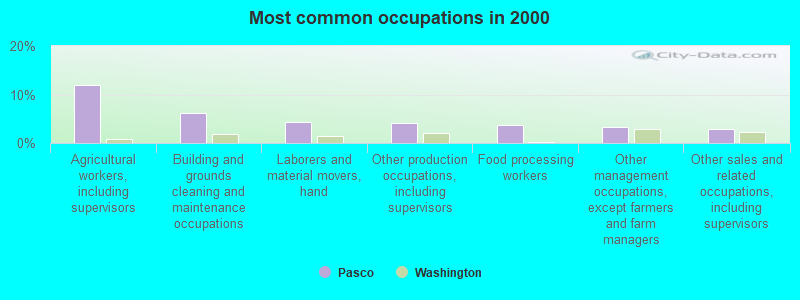
- Agricultural workers, including supervisors (12.0%)
- Building and grounds cleaning and maintenance occupations (6.2%)
- Laborers and material movers, hand (4.2%)
- Other production occupations, including supervisors (4.1%)
- Food processing workers (3.8%)
- Other management occupations, except farmers and farm managers (3.3%)
- Other sales and related occupations, including supervisors (2.9%)

- Agricultural workers, including supervisors (15.8%)
- Building and grounds cleaning and maintenance occupations (6.9%)
- Driver/sales workers and truck drivers (4.9%)
- Other production occupations, including supervisors (4.9%)
- Laborers and material movers, hand (4.8%)
- Electrical equipment mechanics and other installation, maintenance, and repair workers, including supervisors (4.1%)
- Food processing workers (4.0%)
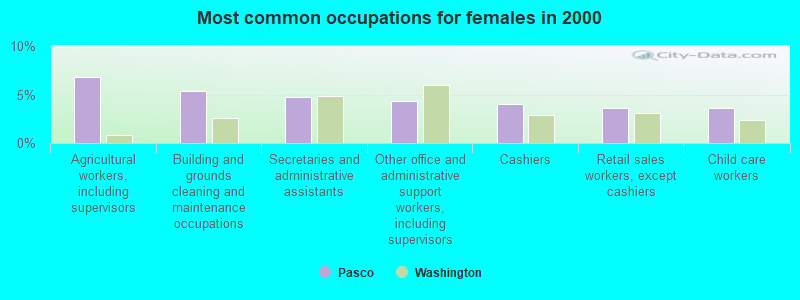
- Agricultural workers, including supervisors (6.8%)
- Building and grounds cleaning and maintenance occupations (5.3%)
- Secretaries and administrative assistants (4.7%)
- Other office and administrative support workers, including supervisors (4.3%)
- Cashiers (4.0%)
- Retail sales workers, except cashiers (3.6%)
- Child care workers (3.6%)
Average climate in Pasco, Washington
Based on data reported by over 4,000 weather stations


|
|


(lower is better)
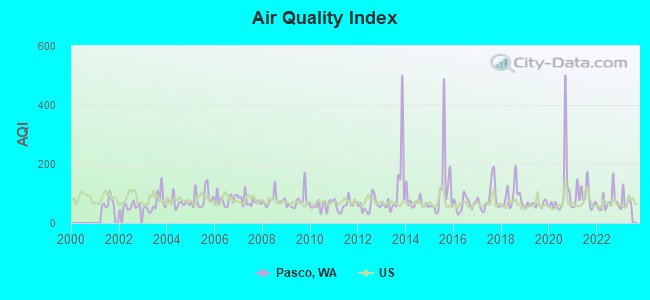
Air Quality Index (AQI) level in 2022 was 70.9. This is about average.
| City: | 70.9 |
| U.S.: | 72.6 |
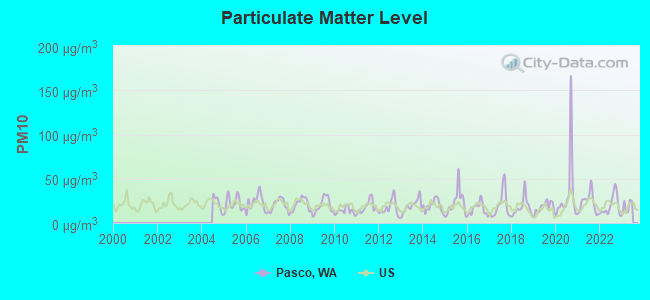
Particulate Matter (PM10) [µg/m3] level in 2022 was 19.5. This is about average. Closest monitor was 4.8 miles away from the city center.
| City: | 19.5 |
| U.S.: | 19.2 |
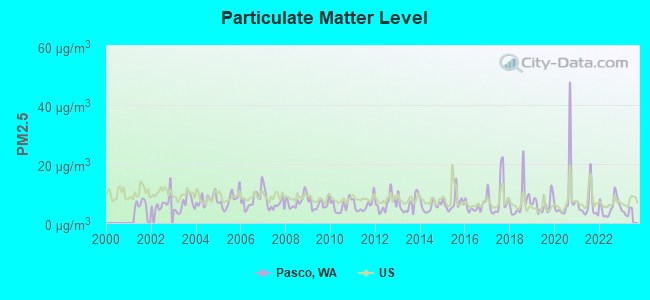
Particulate Matter (PM2.5) [µg/m3] level in 2022 was 5.62. This is significantly better than average. Closest monitor was 4.8 miles away from the city center.
| City: | 5.62 |
| U.S.: | 8.11 |
Earthquake activity:
Pasco-area historical earthquake activity is significantly above Washington state average. It is 1301% greater than the overall U.S. average.On 4/13/1949 at 19:55:42, a magnitude 7.0 (7.0 UK, Class: Major, Intensity: VIII - XII) earthquake occurred 175.3 miles away from Pasco center, causing $80,000,000 total damage
On 2/28/2001 at 18:54:32, a magnitude 6.8 (6.5 MB, 6.6 MS, 6.8 MW, Class: Strong, Intensity: VII - IX) earthquake occurred 175.0 miles away from the city center, causing $2,000,000,000 total damage and $305,000,000 insured losses
On 2/28/2001 at 18:54:32, a magnitude 6.8 (6.8 MD, Depth: 32.2 mi) earthquake occurred 182.8 miles away from Pasco center
On 10/28/1983 at 14:06:06, a magnitude 7.3 (6.2 MB, 7.3 MS, 7.0 MW) earthquake occurred 298.8 miles away from the city center, causing 2 deaths (2 shaking deaths) and 3 injuries, causing $15,000,000 total damage
On 4/29/1965 at 15:28:43, a magnitude 6.6 (6.6 UK) earthquake occurred 170.0 miles away from Pasco center, causing $28,000,000 total damage
On 10/3/1915 at 06:52:48, a magnitude 7.6 (7.6 UK) earthquake occurred 405.0 miles away from the city center
Magnitude types: body-wave magnitude (MB), duration magnitude (MD), surface-wave magnitude (MS), moment magnitude (MW)
Natural disasters:
The number of natural disasters in Franklin County (6) is a lot smaller than the US average (15).Major Disasters (Presidential) Declared: 3
Emergencies Declared: 2
Causes of natural disasters: Floods: 2, Winter Storms: 2, Drought: 1, Hurricane: 1, Landslide: 1, Mudslide: 1, Volcanic Eruption: 1, Other: 1 (Note: some incidents may be assigned to more than one category).
Hospitals and medical centers in Pasco:
Airports and heliports located in Pasco:
- Tri-Cities Airport (PSC) (Runways: 3, Commercial Ops: 6,983, Air Taxi Ops: 4,707, Itinerant Ops: 14,968, Local Ops: 17,432, Military Ops: 2,914)
- Carr Airport (6WA6) (Runways: 1)
- Columbia Ag Airport (53WA) (Runways: 1)
- Columbia Ag 2 Airport (WN33) (Runways: 1)
- Pfister's Airport (WA24) (Runways: 1)
- Ice Harbor Dam Heliport (WN81)
- Pasco Heliport (18WA)
Operable nuclear power plant near Pasco:
- 9 miles: WNP 2 in Richland, WA.
College/University in Pasco:
Other colleges/universities with over 2000 students near Pasco:
- Walla Walla Community College (about 42 miles; Walla Walla, WA; Full-time enrollment: 4,263)
- Yakima Valley Community College (about 72 miles; Yakima, WA; FT enrollment: 3,632)
- Eastern Oregon University (about 81 miles; La Grande, OR; FT enrollment: 3,127)
- Central Washington University (about 87 miles; Ellensburg, WA; FT enrollment: 10,960)
- Washington State University (about 99 miles; Pullman, WA; FT enrollment: 25,055)
- Lewis-Clark State College (about 101 miles; Lewiston, ID; FT enrollment: 3,199)
- Wenatchee Valley College (about 101 miles; Wenatchee, WA; FT enrollment: 2,951)
Public high schools in Pasco:
- NEW HORIZONS HIGH SCHOOL (Location: 3110 ARGENT ROAD, Grades: 6-12)
- PASCO SENIOR HIGH SCHOOL (Location: 1108 N 10TH AVENUE, Grades: 9-12)
- CHIAWANA HIGH SCHOOL (Location: 8125 W ARGENT RD, Grades: 9-12)
Private high schools in Pasco:
- TRI-CITY JUNIOR ACADEMY (Students: 179, Location: 4115 W HENRY ST, Grades: PK-10)
- KINGSPOINT CHRISTIAN SCHOOL (Students: 174, Location: 7900 W COURT ST, Grades: KG-12)
- TRI-CITIES PREP (Students: 162, Location: 9612 SAINT THOMAS DR, Grades: 9-12)
- RIVERVIEW BAPTIST CHRISTIAN SCHOOLS (Students: 145, Location: 4921 W WERNETT RD, Grades: PK-12)
Biggest public elementary/middle schools in Pasco:
- EDWIN MARKHAM ELEMENTARY (Location: 4031 ELM ROAD, Grades: KG-5)
- EMERSON ELEMENTARY (Location: 1616 W OCTAVE ST, Grades: KG-5)
- LONGFELLOW ELEMENTARY (Location: 301 NORTH 10TH AVENUE, Grades: KG-5)
- MARK TWAIN ELEMENTARY (Location: 1801 N ROAD 40, Grades: KG-5)
- MCLOUGHLIN MIDDLE SCHOOL (Location: 2803 N ROAD 88, Grades: 6-8)
- ROBERT FROST ELEMENTARY (Location: 1915 NORTH 22ND AVENUE, Grades: KG-5)
- RUTH LIVINGSTON ELEMENTARY (Location: 2515 ROAD 84, Grades: KG-5)
- STEVENS MIDDLE SCHOOL (Location: 1120 N 22ND AVENUE, Grades: 6-8)
- JAMES MCGEE ELEMENTARY (Location: 4601 N HORIZON DRIVE, Grades: KG-5)
- WHITTIER ELEMENTARY (Location: 616 N WEHE AVENUE, Grades: KG-5)
Private elementary/middle school in Pasco:
User-submitted facts and corrections:
- Birth place of Washington State Benchpress Champion Chad Anderson
Points of interest:
Notable locations in Pasco: Port of Pasco (A), Port of Pasco Industrial Park (B), Court Street Plaza (C), American Medical Response (D), Pasco Fire Department / Ambulance Service Station 82 Airport (E), Pasco Fire Department / Ambulance Service Station 83 (F), Franklin County Fire District 3 Station 32 (G), Pasco Fire Department / Ambulance Service Station 81 (H). Display/hide their locations on the map
Shopping Centers: West Side Shopping Center (1), Griggs Shopping Center (2). Display/hide their locations on the map
Cemeteries: City View Cemetery (1), Columbia Memorial Gardens (2). Display/hide their locations on the map
Parks in Pasco include: Martin Luther King Jr Community Center (1), Edgar Brown Memorial Stadium (2), Sylvester Park (3), Sacajawea State Park (4). Display/hide their locations on the map
Tourist attractions: Franklin County Historical Museum (305 North 4th Avenue) (1), Pasco City - Public Works Department- Water Treatment Plant (Cultural Attractions- Events- & Facilities; 1306 West B) (2), Jenkins Carriage (4212 W Roberta Rd) (3), Adventure Tours (Tours & Charters; 5381 Columbia River Road) (4). Display/hide their approximate locations on the map
Hotels: AMC Internet Consultants (912 West Margaret) (1), Amerisuites Pasco at Trac (4525 Convention Place) (2), Tahitian Motor Inn (2724 West Lewis Street) (3), Airport Motel & Restaurant (2532 North 4th Avenue) (4), King City Truck Stop - Motel Mart (2100 East Hillsboro Street) (5), Doubletree Hotel (2525 North 20th Avenue) (6), Budget Inn (1520 North Oregon Avenue) (7). Display/hide their approximate locations on the map
Courts: Congress - Representatives- Washington- Hastings Doc (2715 Saint Andrews Loop Suite D) (1), Franklin County - District Court (1016 North 4th Avenue) (2), Pasco City - Municipal Court County Courthouse (1015 North 5th Avenue) (3), Franklin County - Superior Court Clerk- Jury Call In (1016 North 4th Avenue) (4), Franklin County - Superior Court Judges (1016 North 4th Avenue) (5). Display/hide their approximate locations on the map
Birthplace of: Chuck Palahniuk - Novelist, Ron Silliman - Poet, Brian Urlacher - 2005 NFL player (Chicago Bears, born: May 25, 1978), Bruce Kison - Baseball player and coach, Ray Washburn - Baseball player, Michael Jackson (linebacker) - Football player, Jeannie Russell - Actor, Kathy Brock - Television personality, Maris Wrixon - Actor, Rich Beck - Baseball player.
Drinking water stations with addresses in Pasco and their reported violations in the past:
GENERAL STORE (Population served: 1,104, Groundwater):Past monitoring violations:BURBANK IRRIGATION DISTRICT 4 (Population served: 527, Groundwater):
- One routine major monitoring violation
- 2 regular monitoring violations
Past health violations:CANYON VILLAGE WATER SYSTEM INC (Population served: 310, Groundwater):Past monitoring violations:
- MCL, Single Sample - Between JUL-2010 and SEP-2010, Contaminant: Nitrate. Follow-up actions: St Compliance achieved (JAN-01-2011)
- One routine major monitoring violation
- One regular monitoring violation
Past monitoring violations:CLARK ADDITION WATER SYSTEM (Population served: 189, Groundwater):
- Follow-up Or Routine LCR Tap M/R - In JAN-01-2004, Contaminant: Lead and Copper Rule. Follow-up actions: St Compliance achieved (DEC-31-2005)
- 2 routine major monitoring violations
- 104 regular monitoring violations
Past monitoring violations:CONAGRA FOODS LAMB WESTON - FARM (Population served: 107, Groundwater):
- One regular monitoring violation
Past monitoring violations:
- One routine major monitoring violation
- 43 regular monitoring violations
Drinking water stations with addresses in Pasco that have no violations reported:
- BURBANK HEIGHTS (Population served: 177, Primary Water Source Type: Groundwater)
- CLEARWATER DOMESTIC WATER ASSN (Population served: 78, Primary Water Source Type: Groundwater)
| This city: | 3.3 people |
| Washington: | 2.5 people |
| This city: | 77.1% |
| Whole state: | 64.4% |
| This city: | 8.1% |
| Whole state: | 7.7% |
Likely homosexual households (counted as self-reported same-sex unmarried-partner households)
- Lesbian couples: 0.3% of all households
- Gay men: 0.3% of all households
People in group quarters in Pasco in 2010:
- 178 people in local jails and other municipal confinement facilities
- 98 people in nursing facilities/skilled-nursing facilities
- 55 people in emergency and transitional shelters (with sleeping facilities) for people experiencing homelessness
- 26 people in other noninstitutional facilities
- 19 people in group homes intended for adults
- 9 people in residential treatment centers for adults
People in group quarters in Pasco in 2000:
- 134 people in local jails and other confinement facilities (including police lockups)
- 116 people in nursing homes
- 35 people in other noninstitutional group quarters
- 34 people in other nonhousehold living situations
- 18 people in homes for the mentally ill
- 9 people in homes or halfway houses for drug/alcohol abuse
- 6 people in hospitals/wards and hospices for chronically ill
- 6 people in other hospitals or wards for chronically ill
Banks with most branches in Pasco (2011 data):
- Bank Reale: at 5205 Road 68, branch established on 2006/09/18; Courier Branch at 5205 Road 68, branch established on 2006/10/13. Info updated 2010/02/23: Bank assets: $47.1 mil, Deposits: $42.9 mil, local headquarters, positive income, Agricultural Specialization, 2 total offices
- U.S. Bank National Association: Westside Branch at 1840 West Court, branch established on 1964/05/14; Pasco Branch at 215 North 10th Avenue, branch established on 1962/04/16. Info updated 2012/01/30: Bank assets: $330,470.8 mil, Deposits: $236,091.5 mil, headquarters in Cincinnati, OH, positive income, 3121 total offices, Holding Company: U.S. Bancorp
- Bank of the West: Pasco Branch at 1115 West Clark Street, branch established on 1954/01/01; Riverview Branch at 3525 West Court Street, branch established on 1979/12/27. Info updated 2009/11/16: Bank assets: $62,408.3 mil, Deposits: $43,995.2 mil, headquarters in San Francisco, CA, positive income, 647 total offices, Holding Company: Bnp Paribas
- Sterling Savings Bank: Pasco Branch at 1204 North 20th, branch established on 1977/01/01. Info updated 2012/03/21: Bank assets: $9,207.8 mil, Deposits: $6,454.1 mil, headquarters in Spokane, WA, positive income, Commercial Lending Specialization, 192 total offices, Holding Company: Sterling Financial Corporation
- Banner Bank: Pasco Branch at 3211 W. Court St., branch established on 2002/08/05. Info updated 2011/05/03: Bank assets: $4,048.2 mil, Deposits: $3,348.4 mil, headquarters in Walla Walla, WA, positive income, Commercial Lending Specialization, 87 total offices, Holding Company: Banner Corporation
- Bank of America, National Association: Pasco Branch at 350 West Lewis Street, branch established on 1937/10/15. Info updated 2009/11/18: Bank assets: $1,451,969.3 mil, Deposits: $1,077,176.8 mil, headquarters in Charlotte, NC, positive income, 5782 total offices, Holding Company: Bank Of America Corporation
- Community First Bank: West Pasco Branch at 4720 Broadmoor Blvd., branch established on 2008/07/25. Info updated 2007/05/31: Bank assets: $199.8 mil, Deposits: $179.7 mil, headquarters in Kennewick, WA, positive income, Commercial Lending Specialization, 5 total offices, Holding Company: Community First Bancorporation, Inc.
- JPMorgan Chase Bank, National Association: Pasco Branch at 2701 West Court Street Suite B, branch established on 1996/09/11. Info updated 2011/11/10: Bank assets: $1,811,678.0 mil, Deposits: $1,190,738.0 mil, headquarters in Columbus, OH, positive income, International Specialization, 5577 total offices, Holding Company: Jpmorgan Chase & Co.
- Columbia State Bank: Pasco Branch at 4725 Road 68, branch established on 2006/05/08. Info updated 2011/08/09: Bank assets: $4,785.2 mil, Deposits: $3,892.8 mil, headquarters in Tacoma, WA, positive income, Commercial Lending Specialization, 104 total offices, Holding Company: Columbia Banking System, Inc.
- 2 other banks with 2 local branches
For population 15 years and over in Pasco:
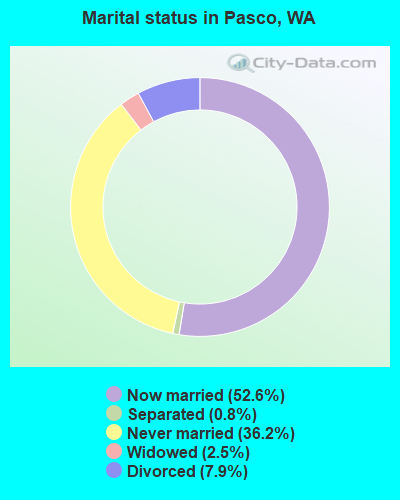
- Never married: 36.2%
- Now married: 52.6%
- Separated: 0.8%
- Widowed: 2.5%
- Divorced: 7.9%
For population 25 years and over in Pasco:
- High school or higher: 73.5%
- Bachelor's degree or higher: 16.7%
- Graduate or professional degree: 7.2%
- Unemployed: 12.3%
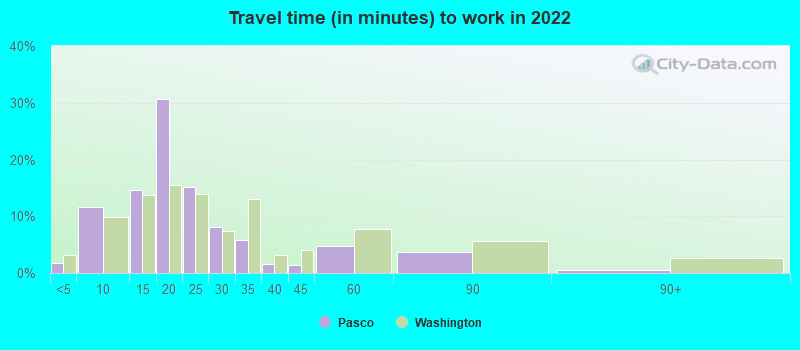
- Mean travel time to work (commute): 25.3 minutes

| Here: | 19.4 |
| Washington average: | 11.6 |
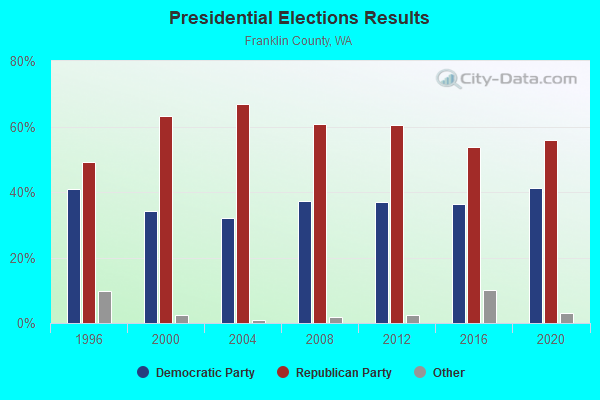
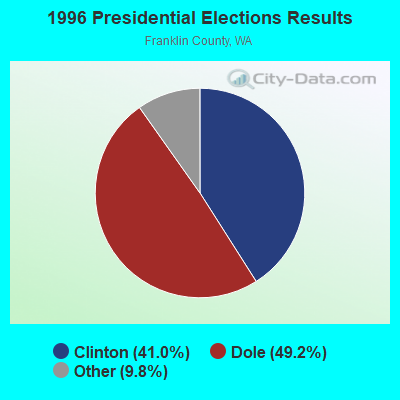
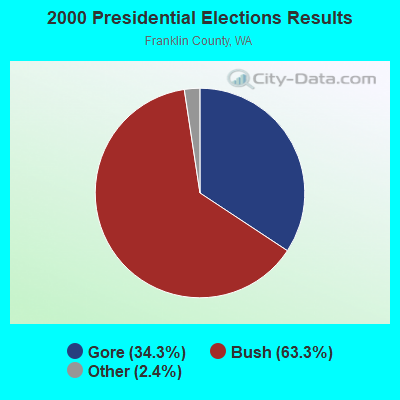

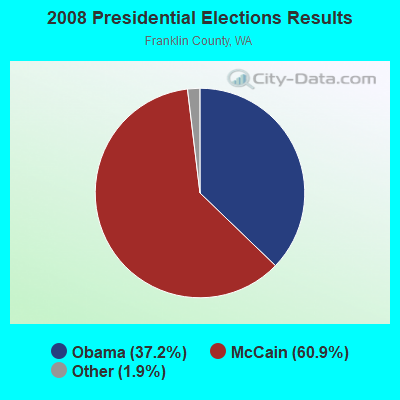
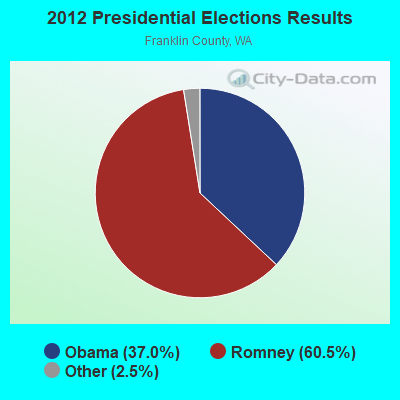

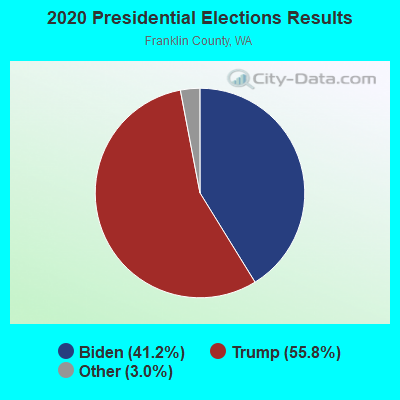
Graphs represent county-level data. Detailed 2008 Election Results
Religion statistics for Pasco, WA (based on Franklin County data)
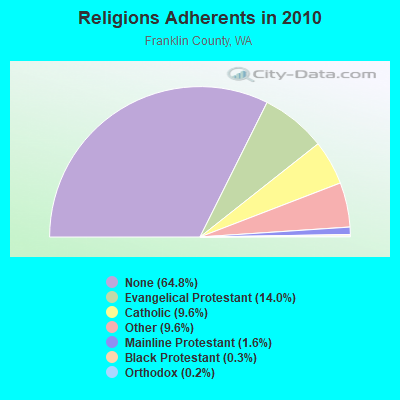
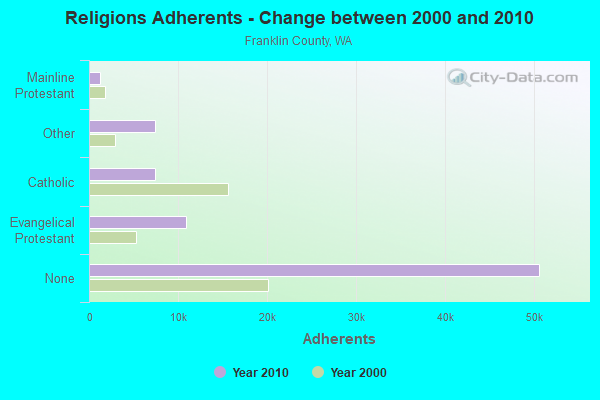
| Religion | Adherents | Congregations |
|---|---|---|
| Evangelical Protestant | 10,938 | 44 |
| Catholic | 7,478 | 3 |
| Other | 7,465 | 23 |
| Mainline Protestant | 1,259 | 10 |
| Black Protestant | 207 | 1 |
| Orthodox | 162 | 1 |
| None | 50,654 | - |
Food Environment Statistics:
| Franklin County: | 1.74 / 10,000 pop. |
| Washington: | 2.06 / 10,000 pop. |
| Here: | 1.16 / 10,000 pop. |
| State: | 1.18 / 10,000 pop. |
| This county: | 3.76 / 10,000 pop. |
| Washington: | 2.67 / 10,000 pop. |
| Franklin County: | 4.48 / 10,000 pop. |
| State: | 8.26 / 10,000 pop. |
| Here: | 6.2% |
| Washington: | 7.7% |
| Franklin County: | 26.7% |
| Washington: | 25.7% |
| Franklin County: | 18.4% |
| Washington: | 13.9% |
Health and Nutrition:
| This city: | 45.7% |
| Washington: | 49.9% |
| Pasco: | 44.9% |
| Washington: | 47.2% |
| This city: | 28.1 |
| Washington: | 28.4 |
| Here: | 23.7% |
| Washington: | 20.9% |
| Pasco: | 9.1% |
| Washington: | 10.5% |
| Pasco: | 6.7 |
| Washington: | 6.8 |
| Pasco: | 29.5% |
| Washington: | 32.8% |
| Here: | 54.1% |
| Washington: | 56.8% |
| Pasco: | 80.4% |
| Washington: | 79.4% |
More about Health and Nutrition of Pasco, WA Residents
| Local government employment and payroll (March 2022) | |||||
| Function | Full-time employees | Monthly full-time payroll | Average yearly full-time wage | Part-time employees | Monthly part-time payroll |
|---|---|---|---|---|---|
| Firefighters | 81 | $795,520 | $117,855 | 0 | $0 |
| Police Protection - Officers | 74 | $835,477 | $135,483 | 0 | $0 |
| Parks and Recreation | 30 | $167,803 | $67,121 | 12 | $9,541 |
| Financial Administration | 30 | $217,742 | $87,097 | 0 | $0 |
| Other Government Administration | 27 | $230,295 | $102,353 | 7 | $8,319 |
| Other and Unallocable | 26 | $173,629 | $80,136 | 0 | $0 |
| Streets and Highways | 23 | $153,822 | $80,255 | 0 | $0 |
| Sewerage | 22 | $142,339 | $77,639 | 0 | $0 |
| Police - Other | 13 | $47,227 | $43,594 | 0 | $0 |
| Water Supply | 12 | $85,232 | $85,232 | 0 | $0 |
| Judicial and Legal | 12 | $67,611 | $67,611 | 0 | $0 |
| Natural Resources | 8 | $56,471 | $84,707 | 0 | $0 |
| Fire - Other | 4 | $21,285 | $63,855 | 0 | $0 |
| Correction | 3 | $15,478 | $61,912 | 0 | $0 |
| Totals for Government | 365 | $3,009,929 | $98,957 | 19 | $17,860 |
Pasco government finances - Expenditure in 2021 (per resident):
- Construction - Local Fire Protection: $10,082,000 ($127.11)
Regular Highways: $1,066,000 ($13.44)
Parks and Recreation: $1,049,000 ($13.23)
General - Other: $447,000 ($5.64)
- Current Operations - Police Protection: $16,772,000 ($211.46)
Sewerage: $11,498,000 ($144.97)
Local Fire Protection: $9,459,000 ($119.26)
Water Utilities: $8,218,000 ($103.61)
Health - Other: $7,857,000 ($99.06)
Parks and Recreation: $5,503,000 ($69.38)
Financial Administration: $5,456,000 ($68.79)
Regular Highways: $4,760,000 ($60.01)
General - Other: $3,205,000 ($40.41)
Central Staff Services: $2,498,000 ($31.49)
Judicial and Legal Services: $2,198,000 ($27.71)
Natural Resources - Other: $2,146,000 ($27.06)
Housing and Community Development: $2,009,000 ($25.33)
Libraries: $1,454,000 ($18.33)
Correctional Institutions: $1,171,000 ($14.76)
Miscellaneous Commercial Activities - Other: $373,000 ($4.70)
Corrections - Other: $254,000 ($3.20)
Transit Utilities: $74,000 ($0.93)
- General - Interest on Debt: $2,954,000 ($37.24)
- Intergovernmental to Local - Other - General - Other: $2,669,000 ($33.65)
- Other Capital Outlay - General - Other: $461,000 ($5.81)
Police Protection: $112,000 ($1.41)
Local Fire Protection: $45,000 ($0.57)
Judicial and Legal Services: $21,000 ($0.26)
- Total Salaries and Wages: $32,686,000 ($412.10)
- Water Utilities - Interest on Debt: $649,000 ($8.18)
Pasco government finances - Revenue in 2021 (per resident):
- Charges - Sewerage: $18,420,000 ($232.24)
Other: $18,107,000 ($228.29)
Natural Resources - Other: $1,915,000 ($24.14)
Parks and Recreation: $1,066,000 ($13.44)
Regular Highways: $477,000 ($6.01)
Miscellaneous Commercial Activities: $467,000 ($5.89)
- Federal Intergovernmental - Housing and Community Development: $623,000 ($7.85)
Other: $241,000 ($3.04)
Health and Hospitals: $40,000 ($0.50)
Natural Resources: $4,000 ($0.05)
- Local Intergovernmental - Other: $542,000 ($6.83)
- Miscellaneous - Rents: $1,657,000 ($20.89)
Special Assessments: $1,226,000 ($15.46)
Fines and Forfeits: $1,221,000 ($15.39)
Sale of Property: $977,000 ($12.32)
General Revenue - Other: $930,000 ($11.73)
Interest Earnings: $548,000 ($6.91)
Donations From Private Sources: $130,000 ($1.64)
- Revenue - Water Utilities: $12,321,000 ($155.34)
- State Intergovernmental - Other: $5,962,000 ($75.17)
Health and Hospitals: $3,969,000 ($50.04)
Highways: $1,476,000 ($18.61)
General Local Government Support: $1,212,000 ($15.28)
Housing and Community Development: $34,000 ($0.43)
- Tax - General Sales and Gross Receipts: $18,266,000 ($230.30)
Public Utilities Sales: $11,475,000 ($144.68)
Property: $11,066,000 ($139.52)
Other License: $2,908,000 ($36.66)
Documentary and Stock Transfer: $2,318,000 ($29.23)
Occupation and Business License - Other: $736,000 ($9.28)
Other Selective Sales: $634,000 ($7.99)
Amusements Sales: $226,000 ($2.85)
Public Utility License: $203,000 ($2.56)
Pasco government finances - Debt in 2021 (per resident):
- Long Term Debt - Outstanding Unspecified Public Purpose: $104,945,000 ($1323.14)
Beginning Outstanding - Unspecified Public Purpose: $93,002,000 ($1172.57)
Issue, Unspecified Public Purpose: $27,729,000 ($349.61)
Retired Unspecified Public Purpose: $15,785,000 ($199.02)
| Businesses in Pasco, WA | ||||
| Name | Count | Name | Count | |
|---|---|---|---|---|
| 7-Eleven | 2 | KFC | 1 | |
| AT&T | 1 | Little Caesars Pizza | 1 | |
| Ace Hardware | 1 | Lowe's | 1 | |
| Albertsons | 1 | MasterBrand Cabinets | 1 | |
| Applebee's | 1 | Mazda | 1 | |
| Arby's | 1 | McDonald's | 2 | |
| AutoZone | 1 | Motel 6 | 1 | |
| Baskin-Robbins | 1 | Nike | 4 | |
| Best Western | 1 | Nissan | 1 | |
| Blockbuster | 1 | Panda Express | 1 | |
| Budget Car Rental | 1 | Payless | 1 | |
| Burger King | 2 | Penske | 1 | |
| Chevrolet | 1 | Pizza Hut | 1 | |
| Circle K | 5 | Quiznos | 1 | |
| ColorTyme | 1 | Rite Aid | 2 | |
| Curves | 1 | SONIC Drive-In | 1 | |
| Dairy Queen | 1 | Sleep Inn | 1 | |
| Discount Tire | 1 | Sprint Nextel | 2 | |
| Domino's Pizza | 1 | Starbucks | 1 | |
| DressBarn | 1 | Subaru | 1 | |
| Dressbarn | 1 | Subway | 4 | |
| FedEx | 5 | Super 8 | 1 | |
| Firestone Complete Auto Care | 1 | T-Mobile | 1 | |
| Ford | 1 | Taco Bell | 2 | |
| GNC | 3 | U-Haul | 3 | |
| GameStop | 1 | U.S. Cellular | 2 | |
| Goodwill | 1 | UPS | 3 | |
| H&R Block | 2 | Walgreens | 3 | |
| Holiday Inn | 1 | Walmart | 1 | |
| IHOP | 1 | Wendy's | 1 | |
| Jack In The Box | 2 | |||
Strongest AM radio stations in Pasco:
- KFLD (870 AM; 10 kW; PASCO, WA; Owner: CAPSTAR TX LIMITED PARTNERSHIP)
- KALE (960 AM; 5 kW; RICHLAND, WA; Owner: NEW NORTHWEST BROADCASTERS, LLC)
- KONA (610 AM; 5 kW; KENNEWICK-RICHLAND-P, WA; Owner: COMMONWEALTH LICENSE SUBSIDIARY, LLC)
- KTCR (1340 AM; 1 kW; KENNEWICK, WA; Owner: NEW NORTHWEST BROADCASTERS, LLC)
- KTBI (810 AM; daytime; 50 kW; EPHRATA, WA; Owner: TACOMA BROADCASTERS, INCORPORATED)
- KOHU (1360 AM; 4 kW; HERMISTON, OR; Owner: WESTEND RADIO, LLC)
- KZTS (1210 AM; 10 kW; SUNNYSIDE, WA; Owner: BUTTERFIELD BROADCASTING CORPORATION)
- KZXR (1310 AM; 5 kW; PROSSER, WA; Owner: MOON BROADCASTING PROSSER LLC)
- KLWJ (1090 AM; daytime; 2 kW; UMATILLA, OR; Owner: UMATILLA BROADCASTING, INC.)
- KUJ (1420 AM; 5 kW; WALLA WALLA, WA; Owner: ALEXANDRA COMMUNICATIONS)
- KPOJ (620 AM; 50 kW; PORTLAND, OR; Owner: CITICASTERS LICENSES, L.P.)
- KGA (1510 AM; 50 kW; SPOKANE, WA; Owner: CITADEL BROADCASTING COMPANY)
- KQQQ (1150 AM; 25 kW; PULLMAN, WA; Owner: RADIO PALOUSE, INC.)
Strongest FM radio stations in Pasco:
- KXRX (97.1 FM; WALLA WALLA, WA; Owner: CAPSTAR TX LIMITED PARTNERSHIP)
- KIOK (94.9 FM; RICHLAND, WA; Owner: NEW NORTHWEST BROADCASTERS, LLC)
- KONA-FM (105.3 FM; KENNEWICK, WA; Owner: COMMONWEALTH LICENSE SUBSIDIARY, LLC)
- KEYW (98.3 FM; PASCO, WA; Owner: CAPSTAR TX LIMITED PARTNERSHIP)
- K261CG (100.1 FM; PASCO, WA; Owner: NORTHWEST CHICANO RADIO NETWORK)
- KFAE-FM (89.1 FM; RICHLAND, WA; Owner: WASHINGTON STATE UNIVERSITY)
- KORD-FM (102.7 FM; RICHLAND, WA; Owner: CAPSTAR TX LIMITED PARTNERSHIP)
- KEGX (106.5 FM; RICHLAND, WA; Owner: NEW NORTHWEST BROADCASTERS, LLC)
- KGDN (101.3 FM; PASCO, WA; Owner: WEST PASCO FINE ARTS RADIO)
- KOLU (90.1 FM; PASCO, WA; Owner: RIVERVIEW BAPTIST CHRISTIAN SCHOOLS)
- KBLD (91.7 FM; KENNEWICK, WA; Owner: CSN INTERNATIONAL)
- KGSG (93.7 FM; PASCO, WA; Owner: GOSPEL MUSIC BROADCASTING CORP.)
- K204CZ (88.7 FM; KENNEWICK, WA; Owner: CALVARY CHAPEL OF TWIN FALLS, INC.)
- K204DH (88.7 FM; HANFORD, WA; Owner: CALVARY CHAPEL OF TWIN FALLS, INC.)
- KUJ-FM (99.1 FM; WALLA WALLA, WA; Owner: ALEXANDRA COMMUNICATIONS)
- KOLW (97.9 FM; MILTON-FREEWATER, OR; Owner: CAPSTAR TX LIMITED PARTNERSHIP)
- KHSS (100.7 FM; WALLA WALLA, WA; Owner: TWO HEARTS COMMUNICATIONS, LLC)
- KRCW (96.3 FM; ROYAL CITY, WA; Owner: FARMWORKER EDUCATIONAL RADIO NETWORK, INC.)
- KRKL (93.3 FM; WALLA WALLA, WA; Owner: EDUCATIONAL MEDIA FOUNDATION)
- KMNA (101.7 FM; PROSSER, WA; Owner: MOON BROADCASTING PROSSER LLC)
TV broadcast stations around Pasco:
- KEPR-TV (Channel 19; PASCO, WA; Owner: FISHER BROADCASTING - WASHINGTON TV, L.L.C.)
- KNDU (Channel 25; RICHLAND, WA; Owner: KHQ, INCORPORATED)
- KVEW (Channel 42; KENNEWICK, WA; Owner: APPLE VALLEY BROADCASTING, INC.)
- KTNW (Channel 31; RICHLAND, WA; Owner: WASHINGTON STATE UNIVERSITY)
- KBWU-LP (Channel 66; RICHLAND, ET AL, WA; Owner: MOUNTAIN LICENSES, L.P.)
- KRLB-LP (Channel 49; RICHLAND, ETC., WA; Owner: RADIANT LIGHT BROADCASTING)
- KVVK-CA (Channel 60; KENNEWICK, ETC., WA; Owner: WATCHTV, INC.)
- K54DU (Channel 54; RICHLAND, WA; Owner: THREE ANGELS BROADCASTING NETWORK)
- National Bridge Inventory (NBI) Statistics
- 41Number of bridges
- 889ft / 271mTotal length
- $171,109,000Total costs
- 895,263Total average daily traffic
- 86,487Total average daily truck traffic
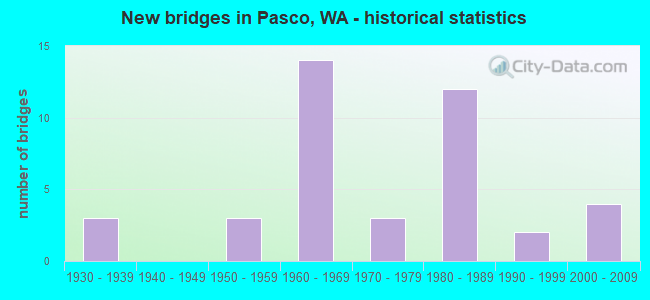
- New bridges - historical statistics
- 31930-1939
- 31950-1959
- 141960-1969
- 31970-1979
- 121980-1989
- 21990-1999
- 42000-2009
FCC Registered Antenna Towers: 291 (See the full list of FCC Registered Antenna Towers)
FCC Registered Commercial Land Mobile Towers: 5 (See the full list of FCC Registered Commercial Land Mobile Towers in Pasco, WA)
FCC Registered Private Land Mobile Towers: 2 (See the full list of FCC Registered Private Land Mobile Towers)
FCC Registered Broadcast Land Mobile Towers: 96 (See the full list of FCC Registered Broadcast Land Mobile Towers)
FCC Registered Microwave Towers: 84 (See the full list of FCC Registered Microwave Towers in this town)
FCC Registered Paging Towers: 3 (See the full list of FCC Registered Paging Towers)
FCC Registered Maritime Coast & Aviation Ground Towers: 16 (See the full list of FCC Registered Maritime Coast & Aviation Ground Towers)
FCC Registered Amateur Radio Licenses: 358 (See the full list of FCC Registered Amateur Radio Licenses in Pasco)
FAA Registered Aircraft Manufacturers and Dealers: 2 (See the full list of FAA Registered Manufacturers and Dealers in Pasco)
FAA Registered Aircraft: 135 (See the full list of FAA Registered Aircraft)
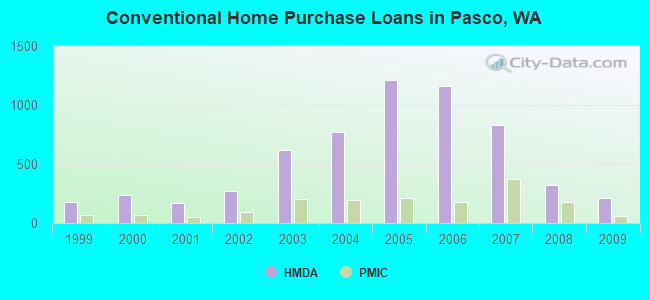
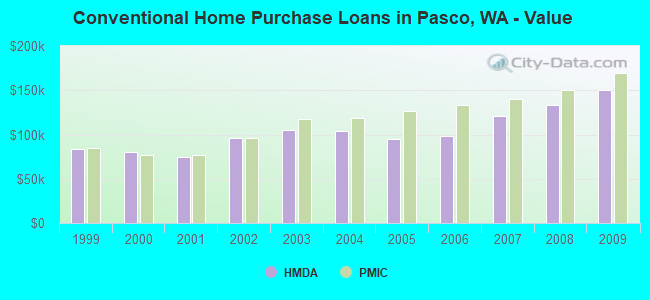
| Home Mortgage Disclosure Act Aggregated Statistics For Year 2009 (Based on 3 full and 3 partial tracts) | ||||||||||||||
| A) FHA, FSA/RHS & VA Home Purchase Loans | B) Conventional Home Purchase Loans | C) Refinancings | D) Home Improvement Loans | E) Loans on Dwellings For 5+ Families | F) Non-occupant Loans on < 5 Family Dwellings (A B C & D) | G) Loans On Manufactured Home Dwelling (A B C & D) | ||||||||
|---|---|---|---|---|---|---|---|---|---|---|---|---|---|---|
| Number | Average Value | Number | Average Value | Number | Average Value | Number | Average Value | Number | Average Value | Number | Average Value | Number | Average Value | |
| LOANS ORIGINATED | 495 | $145,768 | 216 | $150,840 | 667 | $141,528 | 37 | $84,706 | 1 | $1,238,000 | 46 | $103,296 | 37 | $83,772 |
| APPLICATIONS APPROVED, NOT ACCEPTED | 22 | $144,362 | 16 | $132,474 | 101 | $134,987 | 11 | $69,594 | 0 | $0 | 5 | $78,502 | 4 | $67,438 |
| APPLICATIONS DENIED | 66 | $129,391 | 30 | $119,291 | 357 | $127,290 | 36 | $56,980 | 1 | $11,488,000 | 20 | $117,565 | 18 | $73,350 |
| APPLICATIONS WITHDRAWN | 40 | $143,358 | 24 | $128,745 | 230 | $135,683 | 15 | $82,125 | 0 | $0 | 10 | $128,154 | 7 | $86,751 |
| FILES CLOSED FOR INCOMPLETENESS | 9 | $144,868 | 4 | $150,038 | 59 | $127,010 | 3 | $61,753 | 0 | $0 | 5 | $125,582 | 2 | $115,940 |
Detailed HMDA statistics for the following Tracts: 0201.00 , 0202.00, 0203.00, 0204.00, 0205.02, 0206.02
| Private Mortgage Insurance Companies Aggregated Statistics For Year 2009 (Based on 3 full and 3 partial tracts) | ||||||
| A) Conventional Home Purchase Loans | B) Refinancings | C) Non-occupant Loans on < 5 Family Dwellings (A & B) | ||||
|---|---|---|---|---|---|---|
| Number | Average Value | Number | Average Value | Number | Average Value | |
| LOANS ORIGINATED | 59 | $169,491 | 81 | $167,769 | 3 | $150,043 |
| APPLICATIONS APPROVED, NOT ACCEPTED | 9 | $150,866 | 19 | $177,745 | 2 | $126,970 |
| APPLICATIONS DENIED | 12 | $142,313 | 10 | $140,933 | 1 | $145,230 |
| APPLICATIONS WITHDRAWN | 1 | $316,820 | 4 | $225,310 | 1 | $145,230 |
| FILES CLOSED FOR INCOMPLETENESS | 1 | $303,510 | 1 | $151,870 | 1 | $159,670 |
Detailed PMIC statistics for the following Tracts: 0201.00 , 0202.00, 0203.00, 0204.00, 0205.02, 0206.02
2002 - 2018 National Fire Incident Reporting System (NFIRS) incidents
- Fire incident types reported to NFIRS in Pasco, WA
- 1,79938.7%Outside Fires
- 1,73137.2%Structure Fires
- 81617.6%Mobile Property/Vehicle Fires
- 3016.5%Other
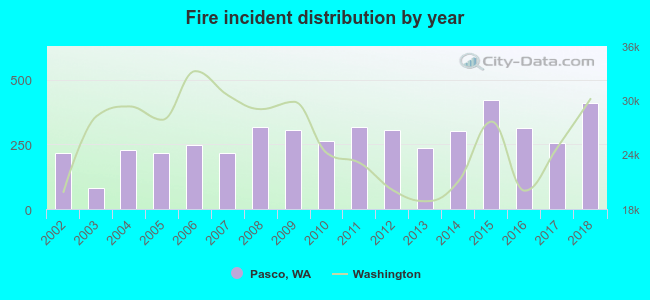 According to the data from the years 2002 - 2018 the average number of fires per year is 273. The highest number of reported fires - 420 took place in 2015, and the least - 81 in 2003. The data has a growing trend.
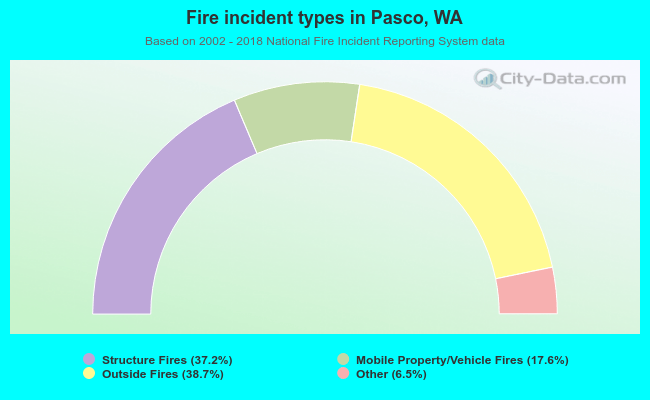 When looking into fire subcategories, the most reports belonged to: Outside Fires (38.7%), and Structure Fires (37.2%).
Fire-safe hotels and motels in Pasco, Washington:
- Rodeway Inn, 1520 N Oregon St, Pasco, Washington 99301 , Phone: (509) 546-2010
- Red Lion Hotel Pasco, 2525 N 20TH, Pasco, Washington 99301 , Phone: (509) 547-0701, Fax: (509) 547-4278
- Sleep Inn, 9930 Bedford St, Pasco, Washington 99301 , Phone: (509) 545-9554, Fax: (509) 544-9548
- Holiday Inn Express Hotel & Suites Pasco/Tri Citie, 4525 Convention Pl, Pasco, Washington 99301 , Phone: (509) 543-7000, Fax: (509) 542-9315
- Best Western Pasco Inn And Suites, 2811 N 20th Ave, Pasco, Washington 99301 , Phone: (509) 543-7722, Fax: (509) 547-1144
- Loyalty Inn, 1801 W Lewis St, Pasco, Washington 99301 , Phone: (509) 547-0791, Fax: (509) 547-8632
- My Place Hotel, 6830 Rodeo Dr, Pasco, Washington 99301 , Phone: (509) 545-2186
- Hampton Inn and Suites, Pasco/Tri-Cities, WA, 6826 Burden Blvd, Pasco, Washington 99301 , Phone: (509) 792-1660, Fax: (509) 792-1661
| Most common first names in Pasco, WA among deceased individuals | ||
| Name | Count | Lived (average) |
|---|---|---|
| John | 151 | 73.7 years |
| William | 132 | 74.6 years |
| Mary | 130 | 78.7 years |
| James | 118 | 71.6 years |
| Robert | 114 | 71.5 years |
| George | 94 | 75.1 years |
| Charles | 80 | 72.6 years |
| Dorothy | 60 | 77.9 years |
| Helen | 59 | 74.4 years |
| Donald | 58 | 70.3 years |
| Most common last names in Pasco, WA among deceased individuals | ||
| Last name | Count | Lived (average) |
|---|---|---|
| Smith | 61 | 72.8 years |
| Johnson | 53 | 73.7 years |
| Brown | 46 | 73.7 years |
| Miller | 43 | 77.2 years |
| Jones | 32 | 74.2 years |
| Davis | 31 | 72.2 years |
| Anderson | 31 | 77.2 years |
| Clark | 25 | 74.2 years |
| Thompson | 24 | 75.1 years |
| Williams | 23 | 76.1 years |
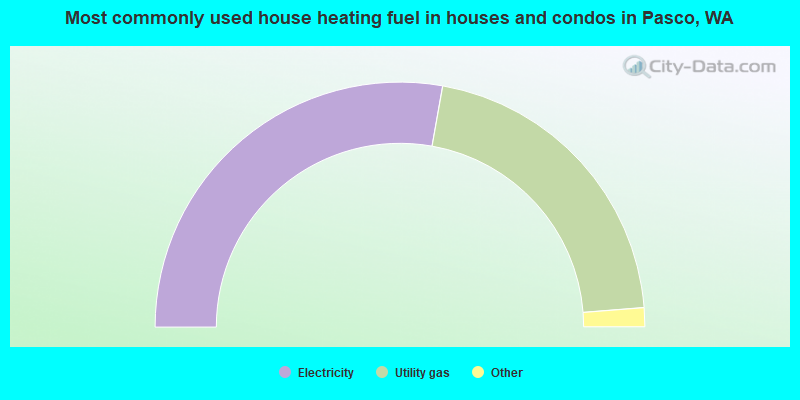
- 55.6%Electricity
- 41.9%Utility gas
- 0.8%Bottled, tank, or LP gas
- 0.7%No fuel used
- 0.4%Fuel oil, kerosene, etc.
- 0.3%Wood
- 0.2%Other fuel
- 0.2%Solar energy
- 78.9%Electricity
- 18.5%Utility gas
- 0.7%Fuel oil, kerosene, etc.
- 0.7%Bottled, tank, or LP gas
- 0.6%Other fuel
- 0.4%No fuel used
- 0.1%Wood
Pasco compared to Washington state average:
- Median house value below state average.
- Black race population percentage below state average.
- Hispanic race population percentage significantly above state average.
- Median age below state average.
- Foreign-born population percentage significantly above state average.
- Length of stay since moving in below state average.
- House age below state average.
- Percentage of population with a bachelor's degree or higher below state average.
Pasco on our top lists:
- #3 on the list of "Top 101 cities with the most people below 50% of the poverty level, excluding cities with 15% or more of residents in college and with the median age below 28 (population 50,000+)"
- #3 on the list of "Top 101 cities with the largest sunshine amount differences during a year (population 50,000+)"
- #5 on the list of "Top 101 cities with largest percentage of females in occupations: material moving occupations (population 50,000+)"
- #7 on the list of "Top 101 cities with largest percentage of females in industries: agriculture, forestry, fishing and hunting (population 50,000+)"
- #8 on the list of "Top 101 cities with largest percentage of females in occupations: farming, fishing, and forestry occupations (population 50,000+)"
- #10 on the list of "Top 101 cities with largest percentage of males in occupations: farming, fishing, and forestry occupations (population 50,000+)"
- #10 on the list of "Top 101 larger cities with the highest increase in household income from 2000 (population 50,000+)"
- #11 on the list of "Top 101 cities with largest percentage of males in industries: agriculture, forestry, fishing and hunting (population 50,000+)"
- #12 on the list of "Top 101 cities with the most people below the poverty level, excluding cities with 15% or more of residents in college and with the median age below 28 (population 50,000+)"
- #18 on the list of "Top 101 cities with the smallest precipitation differences during a year (population 50,000+)"
- #19 on the list of "Top 101 cities with the largest percentage population increase from 2000 (population 50,000+)"
- #22 on the list of "Top 101 cities with the smallest percentage of elementary and middle school students in private schools (5,000+ students)"
- #25 on the list of "Top 101 cities with the lowest average yearly precipitation (population 50,000+)"
- #27 on the list of "Top 100 low-educated but high-earning cities (pop. 50,000+)"
- #32 on the list of "Top 100 fastest growing cities from 2000 to 2014 (pop. 50,000+)"
- #35 on the list of "Top 101 cities with most building permits per 10,000 residents (population 50,000+)"
- #35 on the list of "Top 100 cities with youngest residents (pop. 50,000+)"
- #41 on the list of "Top 101 cities with largest percentage of males in occupations: health technologists and technicians (population 50,000+)"
- #42 on the list of "Top 101 cities with the lowest minimum monthly sunshine amount (population 50,000+)"
- #44 on the list of "Top 101 cities with the most cars per house, population 50,000+"
- #7 on the list of "Top 101 counties with the highest average weight of females"
- #21 on the list of "Top 101 counties with the lowest percentage of residents that smoked 100+ cigarettes in their lives"
- #25 on the list of "Top 101 counties with the lowest percentage of residents that visited a dentist within the past year"
- #50 on the list of "Top 101 counties with the lowest percentage of residents that drank alcohol in the past 30 days"
- #63 on the list of "Top 101 counties with the worst general health status score of residents (1-5), 3 years of data"

|
|
Total of 169 patent applications in 2008-2024.