Races in Harker Heights, Texas (TX) Detailed Stats
Data:
Races - White alone (%)
Races - White alone (% change since 2000)
Races - Black alone (%)
Races - Black alone (% change since 2000)
Races - American Indian alone (%)
Races - American Indian alone (% change since 2000)
Races - Asian alone (%)
Races - Asian alone (% change since 2000)
Races - Hispanic (%)
Races - Hispanic (% change since 2000)
Races - Native Hawaiian and Other Pacific Islander alone (%)
Races - Native Hawaiian and Other Pacific Islander alone (% change since 2000)
Races - Two or more races(%)
Races - Two or more races(% change since 2000)
Races - Other race alone (%)
Races - Other race alone (% change since 2000)
Racial diversity
Place of birth - Born in state of residence (%)
Place of birth - Born in state of residence (%) - White
Place of birth - Born in state of residence (%) - Black or African American
Place of birth - Born in state of residence (%) - Asian
Place of birth - Born in state of residence (%) - Hispanic or Latino
Place of birth - Born in state of residence (%) - American Indian and Alaska Native
Place of birth - Born in state of residence (%) - Multirace
Place of birth - Born in state of residence (%) - Other Race
Place of birth - Born in other state (%)
Place of birth - Born in other state (%) - White
Place of birth - Born in other state (%) - Black or African American
Place of birth - Born in other state (%) - Asian
Place of birth - Born in other state (%) - Hispanic or Latino
Place of birth - Born in other state (%) - American Indian and Alaska Native
Place of birth - Born in other state (%) - Multirace
Place of birth - Born in other state (%) - Other Race
Place of birth - Native, outside of US (%)
Place of birth - Native, outside of US (%) - White
Place of birth - Native, outside of US (%) - Black or African American
Place of birth - Native, outside of US (%) - Asian
Place of birth - Native, outside of US (%) - Hispanic or Latino
Place of birth - Native, outside of US (%) - American Indian and Alaska Native
Place of birth - Native, outside of US (%) - Multirace
Place of birth - Native, outside of US (%) - Other Race
Place of birth - Foreign born (%)
Place of birth - Foreign born (%) - White
Place of birth - Foreign born (%) - Black or African American
Place of birth - Foreign born (%) - Asian
Place of birth - Foreign born (%) - Hispanic or Latino
Place of birth - Foreign born (%) - American Indian and Alaska Native
Place of birth - Foreign born (%) - Multirace
Place of birth - Foreign born (%) - Other Race
Residents speaking English at home (%)
Residents speaking English at home - Born in the United States (%)
Residents speaking English at home - Native, born elsewhere (%)
Residents speaking English at home - Foreign born (%)
Residents speaking Spanish at home (%)
Residents speaking Spanish at home - Born in the United States (%)
Residents speaking Spanish at home - Native, born elsewhere (%)
Residents speaking Spanish at home - Foreign born (%)
Residents speaking other language at home (%)
Residents speaking other language at home - Born in the United States (%)
Residents speaking other language at home - Native, born elsewhere (%)
Residents speaking other language at home - Foreign born (%)
Marital status - Never married (%)
Marital status - Now married (%)
Marital status - Separated (%)
Marital status - Widowed (%)
Marital status - Divorced (%)
Ancestries Reported - Arab (%)
Ancestries Reported - Czech (%)
Ancestries Reported - Danish (%)
Ancestries Reported - Dutch (%)
Ancestries Reported - English (%)
Ancestries Reported - French (%)
Ancestries Reported - French Canadian (%)
Ancestries Reported - German (%)
Ancestries Reported - Greek (%)
Ancestries Reported - Hungarian (%)
Ancestries Reported - Irish (%)
Ancestries Reported - Italian (%)
Ancestries Reported - Lithuanian (%)
Ancestries Reported - Norwegian (%)
Ancestries Reported - Polish (%)
Ancestries Reported - Portuguese (%)
Ancestries Reported - Russian (%)
Ancestries Reported - Scotch-Irish (%)
Ancestries Reported - Scottish (%)
Ancestries Reported - Slovak (%)
Ancestries Reported - Subsaharan African (%)
Ancestries Reported - Swedish (%)
Ancestries Reported - Swiss (%)
Ancestries Reported - Ukrainian (%)
Ancestries Reported - United States (%)
Ancestries Reported - Welsh (%)
Ancestries Reported - West Indian (%)
Ancestries Reported - Other (%)
Geographical mobility - Same house 1 year ago (%)
Geographical mobility - Same house 1 year ago (%) - White
Geographical mobility - Same house 1 year ago (%) - Black or African American
Geographical mobility - Same house 1 year ago (%) - Asian
Geographical mobility - Same house 1 year ago (%) - Hispanic or Latino
Geographical mobility - Same house 1 year ago (%) - American Indian and Alaska Native
Geographical mobility - Same house 1 year ago (%) - Multirace
Geographical mobility - Same house 1 year ago (%) - Other Race
Geographical mobility - Moved within same county (%)
Geographical mobility - Moved within same county (%) - White
Geographical mobility - Moved within same county (%) - Black or African American
Geographical mobility - Moved within same county (%) - Asian
Geographical mobility - Moved within same county (%) - Hispanic or Latino
Geographical mobility - Moved within same county (%) - American Indian and Alaska Native
Geographical mobility - Moved within same county (%) - Multirace
Geographical mobility - Moved within same county (%) - Other Race
Geographical mobility - Moved from different county within same state (%)
Geographical mobility - Moved from different county within same state (%) - White
Geographical mobility - Moved from different county within same state (%) - Black or African American
Geographical mobility - Moved from different county within same state (%) - Asian
Geographical mobility - Moved from different county within same state (%) - Hispanic or Latino
Geographical mobility - Moved from different county within same state (%) - American Indian and Alaska Native
Geographical mobility - Moved from different county within same state (%) - Multirace
Geographical mobility - Moved from different county within same state (%) - Other Race
Geographical mobility - Moved from different state (%)
Geographical mobility - Moved from different state (%) - White
Geographical mobility - Moved from different state (%) - Black or African American
Geographical mobility - Moved from different state (%) - Asian
Geographical mobility - Moved from different state (%) - Hispanic or Latino
Geographical mobility - Moved from different state (%) - American Indian and Alaska Native
Geographical mobility - Moved from different state (%) - Multirace
Geographical mobility - Moved from different state (%) - Other Race
Geographical mobility - Moved from abroad (%)
Geographical mobility - Moved from abroad (%) - White
Geographical mobility - Moved from abroad (%) - Black or African American
Geographical mobility - Moved from abroad (%) - Asian
Geographical mobility - Moved from abroad (%) - Hispanic or Latino
Geographical mobility - Moved from abroad (%) - American Indian and Alaska Native
Geographical mobility - Moved from abroad (%) - Multirace
Geographical mobility - Moved from abroad (%) - Other Race
Place of birth for the foreign-born population - Ireland (%)
Place of birth for the foreign-born population - Denmark (%)
Place of birth for the foreign-born population - Norway (%)
Place of birth for the foreign-born population - Sweden (%)
Place of birth for the foreign-born population - United Kingdom (%)
Place of birth for the foreign-born population - England (%)
Place of birth for the foreign-born population - Scotland (%)
Place of birth for the foreign-born population - Other Northern Europe (%)
Place of birth for the foreign-born population - Austria (%)
Place of birth for the foreign-born population - Belgium (%)
Place of birth for the foreign-born population - France (%)
Place of birth for the foreign-born population - Germany (%)
Place of birth for the foreign-born population - Netherlands (%)
Place of birth for the foreign-born population - Switzerland (%)
Place of birth for the foreign-born population - Other Western Europe (%)
Place of birth for the foreign-born population - Greece (%)
Place of birth for the foreign-born population - Italy (%)
Place of birth for the foreign-born population - Portugal (%)
Place of birth for the foreign-born population - Spain (%)
Place of birth for the foreign-born population - Other Southern Europe (%)
Place of birth for the foreign-born population - Albania (%)
Place of birth for the foreign-born population - Belarus (%)
Place of birth for the foreign-born population - Bosnia and Herzegovina (%)
Place of birth for the foreign-born population - Bulgaria (%)
Place of birth for the foreign-born population - Croatia (%)
Place of birth for the foreign-born population - Czechoslovakia (%)
Place of birth for the foreign-born population - Hungary (%)
Place of birth for the foreign-born population - Latvia (%)
Place of birth for the foreign-born population - Lithuania (%)
Place of birth for the foreign-born population - North Macedonia (Macedonia) (%)
Place of birth for the foreign-born population - Moldova (%)
Place of birth for the foreign-born population - Poland (%)
Place of birth for the foreign-born population - Romania (%)
Place of birth for the foreign-born population - Russia (%)
Place of birth for the foreign-born population - Serbia (%)
Place of birth for the foreign-born population - Ukraine (%)
Place of birth for the foreign-born population - Other Eastern Europe (%)
Place of birth for the foreign-born population - China (%)
Place of birth for the foreign-born population - Hong Kong (%)
Place of birth for the foreign-born population - Taiwan (%)
Place of birth for the foreign-born population - Japan (%)
Place of birth for the foreign-born population - Korea (%)
Place of birth for the foreign-born population - Other Eastern Asia (%)
Place of birth for the foreign-born population - Afghanistan (%)
Place of birth for the foreign-born population - Bangladesh (%)
Place of birth for the foreign-born population - India (%)
Place of birth for the foreign-born population - Iran (%)
Place of birth for the foreign-born population - Kazakhstan (%)
Place of birth for the foreign-born population - Nepal (%)
Place of birth for the foreign-born population - Pakistan (%)
Place of birth for the foreign-born population - Sri Lanka (%)
Place of birth for the foreign-born population - Uzbekistan (%)
Place of birth for the foreign-born population - Other South Central Asia (%)
Place of birth for the foreign-born population - Burma (%)
Place of birth for the foreign-born population - Cambodia (%)
Place of birth for the foreign-born population - Indonesia (%)
Place of birth for the foreign-born population - Laos (%)
Place of birth for the foreign-born population - Malaysia (%)
Place of birth for the foreign-born population - Philippines (%)
Place of birth for the foreign-born population - Singapore (%)
Place of birth for the foreign-born population - Thailand (%)
Place of birth for the foreign-born population - Vietnam (%)
Place of birth for the foreign-born population - Other South Eastern Asia (%)
Place of birth for the foreign-born population - Armenia (%)
Place of birth for the foreign-born population - Iraq (%)
Place of birth for the foreign-born population - Israel (%)
Place of birth for the foreign-born population - Jordan (%)
Place of birth for the foreign-born population - Kuwait (%)
Place of birth for the foreign-born population - Lebanon (%)
Place of birth for the foreign-born population - Saudi Arabia (%)
Place of birth for the foreign-born population - Syria (%)
Place of birth for the foreign-born population - Turkey (%)
Place of birth for the foreign-born population - Yemen (%)
Place of birth for the foreign-born population - Other Western Asia (%)
Place of birth for the foreign-born population - Eritrea (%)
Place of birth for the foreign-born population - Ethiopia (%)
Place of birth for the foreign-born population - Kenya (%)
Place of birth for the foreign-born population - Somalia (%)
Place of birth for the foreign-born population - Uganda (%)
Place of birth for the foreign-born population - Zimbabwe (%)
Place of birth for the foreign-born population - Other Eastern Africa (%)
Place of birth for the foreign-born population - Cameroon (%)
Place of birth for the foreign-born population - Congo (%)
Place of birth for the foreign-born population - Democratic Republic of Congo (Zaire) (%)
Place of birth for the foreign-born population - Other Middle Africa (%)
Place of birth for the foreign-born population - Egypt (%)
Place of birth for the foreign-born population - Morocco (%)
Place of birth for the foreign-born population - Sudan (%)
Place of birth for the foreign-born population - Other Northern Africa (%)
Place of birth for the foreign-born population - South Africa (%)
Place of birth for the foreign-born population - Other Southern Africa (%)
Place of birth for the foreign-born population - Cabo Verde (%)
Place of birth for the foreign-born population - Ghana (%)
Place of birth for the foreign-born population - Liberia (%)
Place of birth for the foreign-born population - Nigeria (%)
Place of birth for the foreign-born population - Senegal (%)
Place of birth for the foreign-born population - Sierra Leone (%)
Place of birth for the foreign-born population - Other Western Africa (%)
Place of birth for the foreign-born population - Australia (%)
Place of birth for the foreign-born population - New Zealand (%)
Place of birth for the foreign-born population - Fiji (%)
Place of birth for the foreign-born population - Micronesia (%)
Place of birth for the foreign-born population - Bahamas (%)
Place of birth for the foreign-born population - Barbados (%)
Place of birth for the foreign-born population - Cuba (%)
Place of birth for the foreign-born population - Dominica (%)
Place of birth for the foreign-born population - Dominican Republic (%)
Place of birth for the foreign-born population - Grenada (%)
Place of birth for the foreign-born population - Haiti (%)
Place of birth for the foreign-born population - Jamaica (%)
Place of birth for the foreign-born population - St. Vincent and the Grenadines (%)
Place of birth for the foreign-born population - Trinidad and Tobago (%)
Place of birth for the foreign-born population - West Indies (%)
Place of birth for the foreign-born population - Other Caribbean (%)
Place of birth for the foreign-born population - Belize (%)
Place of birth for the foreign-born population - Costa Rica (%)
Place of birth for the foreign-born population - El Salvador (%)
Place of birth for the foreign-born population - Guatemala (%)
Place of birth for the foreign-born population - Honduras (%)
Place of birth for the foreign-born population - Mexico (%)
Place of birth for the foreign-born population - Nicaragua (%)
Place of birth for the foreign-born population - Panama (%)
Place of birth for the foreign-born population - Other Central America (%)
Place of birth for the foreign-born population - Argentina (%)
Place of birth for the foreign-born population - Bolivia (%)
Place of birth for the foreign-born population - Brazil (%)
Place of birth for the foreign-born population - Chile (%)
Place of birth for the foreign-born population - Colombia (%)
Place of birth for the foreign-born population - Ecuador (%)
Place of birth for the foreign-born population - Guyana (%)
Place of birth for the foreign-born population - Peru (%)
Place of birth for the foreign-born population - Uruguay (%)
Place of birth for the foreign-born population - Venezuela (%)
Place of birth for the foreign-born population - Other South America (%)
Place of birth for the foreign-born population - Canada (%)
Place of birth for the foreign-born population - Other Northern America (%)
Place of birth for the foreign-born population - Other (%)
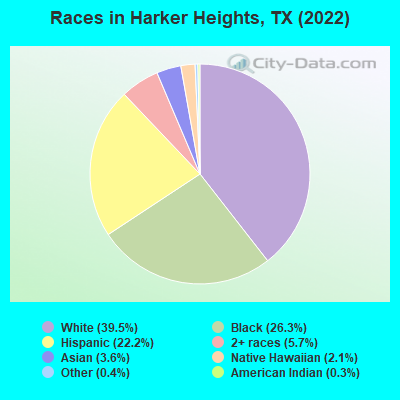
According to 2022 data, the most numerous races in Harker Heights, TX are Hispanic (7,632 residents), White alone (13,610 residents), and Black alone (9,065 residents). 78.2% of Harker Heights residents speak English at home. 10.1% of Harker Heights, TX residents are foreign-born (3.7% born in Latin America, 2.9% born in Asia, 2.2% born in Europe), which is 67.8% less than the foreign-born rate of 17.0% across the entire state of Texas.
Race distribution in Harker Heights
2000 2022
10,933,313 52.4% White alone 6,669,666 32.0% Hispanic 2,364,255 11.3% Black alone 554,445 2.7% Asian alone 230,567 1.1% Two or more races 68,859 0.3% American Indian alone 19,958 0.10% Other race alone 10,757 0.05% Native Hawaiian and Other
12,070,642 40.2% Hispanic 11,683,430 38.9% White alone 3,508,706 11.7% Black alone 1,608,173 5.4% Asian alone 956,560 3.2% Two or more races 125,763 0.4% Other race alone 47,023 0.2% American Indian alone 29,275 0.10% Native Hawaiian and Other
Income and house value in Harker Heights Median household income in 2022 $81,207 White non-Hispanic householders$74,015 Black householders$38,460 American Indian and Alaska Native householders$63,848 Asian householders$66,039 Some other race householders$52,648 Two or more races householders$52,733 Hispanic or Latino race householdersMedian 2022 house value $333,617 White Non-Hispanic householders$332,728 Black or African American householders $287,100 Asian householders$175,104 Native Hawaiian and other Pacific Islander householders$225,769 Some other race householders$318,507 Two or more races householders$277,619 Hispanic or Latino householders
Median age by race in Harker Heights
37.8 Median age for White residents36.9 40.1 31.2 Median age for Black or African American residents31.7 31.9 44.4 Median age for American Indian / Alaska Native residents30.7 54.3 45.1 Median age for Asian residents38.8 47.6 45.9 Median age for Native Hawaiian / Pacific Islander residents20.4 72.6 38.6 Median age for Other race residents38.8 38.8 24.3 Median age for Two or more races residents16.6 26.1 38.1 Median age for White alone residents36.3 41.9 30.2 Median age for Hispanic or Latino residents22.3 30.4
Owner/renter occupied households by race in Harker Heights
House owners and renters - White residents 3,699 67.4% Owner occupied1,791 32.6% Renter occupiedHouse owners and renters - Black or African American residents 1,665 42.9% Owner occupied2,217 57.1% Renter occupiedHouse owners and renters - American Indian / Alaska Native residents 188 60.9% Owner occupied121 39.1% Renter occupiedHouse owners and renters - Asian residents 235 50.5% Owner occupied230 49.5% Renter occupiedHouse owners and renters - Native Hawaiian / Pacific Islander residents 248 100.0% Owner occupiedHouse owners and renters - Other race residents 375 53.6% Owner occupied325 46.4% Renter occupiedHouse owners and renters - Two or more races residents 845 53.4% Owner occupied737 46.6% Renter occupiedHouse owners and renters - White alone residents 3,470 67.7% Owner occupied1,654 32.3% Renter occupiedHouse owners and renters - Hispanic or Latino residents 1,292 52.7% Owner occupied1,159 47.3% Renter occupied
Language usage in Harker Heights
English speakers - Total 78.2% of residents of Harker Heights speak English at home.
12.0% of residents speak Spanish at home 2,885 74.1% Speak English very well1,007 25.9% Speak English less than very well9.2% of residents speak other language at home 2,428 81.2% Speak English very well563 18.8% Speak English less than very well
English speakers - Born in the United States 90.5% of residents of Harker Heights speak English at home.
6.0% of residents speak Spanish at home 886 94.4% Speak English very well53 5.6% Speak English less than very well2.9% of residents speak other language at home 432 94.9% Speak English very well23 5.1% Speak English less than very well
English speakers - Native, born elsewhere 40.2% of residents of Harker Heights speak English at home.
31.8% of residents speak Spanish at home 548 76.3% Speak English very well170 23.7% Speak English less than very well11.6% of residents speak other language at home 251 95.4% Speak English very well12 4.6% Speak English less than very well
English speakers - Foreign-born 23.5% of residents of Harker Heights speak English at home.
26.6% of residents speak Spanish at home 432 41.3% Speak English very well613 58.7% Speak English less than very well49.4% of residents speak other language at home 1,456 75.1% Speak English very well482 24.9% Speak English less than very well
White (Caucasian) - Speak only English Native:
96.1% (12,764)Foreign-born:
26.5% (262)
White (Caucasian) - Speak another language Native:
4.8% (635)Foreign-born:
70.9% (702)
Black or African American - Speak only English Native:
92.1% (7,904)Foreign-born:
54.2% (298)
Black or African American - Speak another language Native:
7.5% (642)Foreign-born:
40.1% (220)
American Indian / Alaska Native - Speak another language Native:
56.3% (216)Foreign-born:
98.9% (27)
Asian - Speak only English Native:
85.5% (224)Foreign-born:
9.1% (88)
Asian - Speak another language Native:
17.0% (44)Foreign-born:
92.4% (901)
Native Hawaiian / Pacific Islander - Speak only English Native:
69.0% (322)Foreign-born:
19.8% (69)
Native Hawaiian / Pacific Islander - Speak another language Native:
31.3% (146)Foreign-born:
72.3% (251)
Other race - Speak another language Native:
84.5% (1,338)Foreign-born:
100.0% (388)
Two or more races - Speak only English Native:
71.3% (2,953)Foreign-born:
79.3% (155)
Two or more races - Speak another language Native:
27.7% (1,150)Foreign-born:
29.2% (57)
White alone - Speak only English Native:
94.6% (11,529)Foreign-born:
26.9% (255)
White alone - Speak another language Native:
4.8% (581)Foreign-born:
72.3% (685)
Hispanic or Latino - Speak only English Native:
58.1% (3,588)Foreign-born:
10.4% (104)
Hispanic or Latino - Speak another language Native:
36.8% (2,271)Foreign-born:
89.3% (889)
Foreign-born residents in Harker Heights 3,486 residents are foreign born (3.7% Latin America , 2.9% Asia , 2.2% Europe ).
This city:
10.1%Texas:
17.1%
Marital status for residents in Harker Heights Marital status - White (Caucasian) population 15 years and over
Males 39.2% Never married47.1% Now married1.2% Separated2.4% Widowed10.3% DivorcedFemales 31.4% Never married43.3% Now married2.6% Separated7.2% Widowed15.6% DivorcedWomen who gave birth in the past 12 months Now married:
79.8% (138)Unmarried:
20.2% (35)
Women who did not give birth in the past 12 months Now married:
40.6% (1,541)Unmarried:
59.4% (2,250)
Marital status - Black or African American population 15 years and over
Males 25.3% Never married56.9% Now married1.0% Separated0.0% Widowed16.7% DivorcedFemales 40.2% Never married43.5% Now married0.7% Separated1.6% Widowed14.0% DivorcedWomen who gave birth in the past 12 months Now married:
100.0% (173)Unmarried:
0.0% (0)
Women who did not give birth in the past 12 months Now married:
32.4% (842)Unmarried:
67.6% (1,759)
Marital status - American Indian / Alaska Native population 15 years and over
Males 49.6% Never married38.6% Now married0.0% Separated0.0% Widowed11.8% DivorcedFemales 24.1% Never married23.4% Now married49.6% Separated0.0% Widowed2.9% DivorcedWomen who gave birth in the past 12 months Now married:
100.0% (16)Unmarried:
0.0% (0)
Women who did not give birth in the past 12 months Now married:
70.2% (125)Unmarried:
29.8% (53)
Marital status - Asian population 15 years and over
Males 33.0% Never married66.7% Now married0.0% Separated0.0% Widowed0.2% DivorcedFemales 0.7% Never married70.5% Now married0.0% Separated24.7% Widowed4.1% DivorcedWomen who did not give birth in the past 12 months Now married:
80.3% (227)Unmarried:
19.7% (55)
Marital status - Native Hawaiian / Pacific Islander population 15 years and over
Males 21.3% Never married78.7% Now married0.0% Separated0.0% Widowed0.0% DivorcedFemales 0.0% Never married100.0% Now married0.0% Separated0.0% Widowed0.0% DivorcedWomen who did not give birth in the past 12 months Now married:
100.0% (124)Unmarried:
0.0% (0)
Marital status - Other race population 15 years and over
Males 35.8% Never married49.5% Now married3.0% Separated0.0% Widowed11.6% DivorcedFemales 31.2% Never married50.8% Now married0.0% Separated7.3% Widowed10.7% DivorcedWomen who did not give birth in the past 12 months Now married:
52.2% (331)Unmarried:
47.8% (303)
Marital status - Two or more races population 15 years and over
Males 34.6% Never married43.8% Now married4.9% Separated0.0% Widowed16.7% DivorcedFemales 52.7% Never married36.7% Now married0.0% Separated6.1% Widowed4.5% DivorcedWomen who gave birth in the past 12 months Now married:
100.0% (22)Unmarried:
0.0% (0)
Women who did not give birth in the past 12 months Now married:
21.9% (314)Unmarried:
78.1% (1,119)
Marital status - White alone, not Hispanic / Latino population 15 years and over
Males 30.9% Never married52.0% Now married1.5% Separated2.6% Widowed13.0% DivorcedFemales 29.6% Never married44.1% Now married2.8% Separated7.1% Widowed16.5% DivorcedWomen who gave birth in the past 12 months Now married:
79.8% (150)Unmarried:
20.2% (38)
Women who did not give birth in the past 12 months Now married:
40.3% (1,449)Unmarried:
59.7% (2,144)
Marital status - Hispanic or Latino population 15 years and over
Males 50.7% Never married41.7% Now married1.9% Separated1.1% Widowed4.7% DivorcedFemales 43.8% Never married40.9% Now married2.9% Separated6.1% Widowed6.3% DivorcedWomen who did not give birth in the past 12 months Now married:
40.0% (824)Unmarried:
60.0% (1,236)
Ancestries in Harker Heights
2,898 14.8% American1,262 6.5% German515 2.6% Dutch468 2.4% Irish375 1.9% Jamaican331 1.7% English311 1.6% European276 1.4% Nigerian251 1.3% Polish186 1.0% Norwegian170 0.9% Italian108 0.6% Scottish100 0.5% British87 0.4% African85 0.4% Syrian58 0.3% Hungarian39 0.2% Swiss39 0.2% Scotch-Irish38 0.2% Egyptian37 0.2% West Indian36 0.2% Guyanese33 0.2% Austrian32 0.2% Russian31 0.2% Albanian29 0.1% Ukrainian27 0.1% Portuguese27 0.1% Canadian19 0.10% Latvian16 0.08% Scandinavian14 0.07% Eastern European13 0.07% Northern European13 0.07% French12 0.06% Arab8 0.04% Welsh7 0.04% Greek6 0.03% Czech5 0.03% Swedish
Geographical mobility in Harker Heights Same house 1 year ago 11,510 77.2% White (Caucasian)8,189 84.0% Black or African American359 82.6% American Indian / Alaska Native986 74.4% Asian818 98.2% Native Hawaiian / Pacific Islander1,677 77.5% Other race3,761 82.9% Two or more races10,989 81.4% White alone, not Hispanic / Latino5,387 71.0% Hispanic or LatinoMoved within same county 1,025 6.9% White / Caucasian914 9.4% Black or African American441 20.4% Other race612 13.5% Two or more races956 7.1% White alone, not Hispanic / Latino1,064 14.0% Hispanic or LatinoMoved within same state 667 4.5% White / Caucasian360 3.7% Black or African American151 11.4% Asian375 2.8% White alone, not Hispanic / Latino183 2.4% Hispanic or LatinoMoved from different state 1,260 8.5% White / Caucasian325 3.3% Black or African American92 21.1% American Indian / Alaska Native12 0.9% Asian289 6.4% Two or more races557 4.1% White alone, not Hispanic / Latino998 13.2% Hispanic or LatinoMoved from abroad 293 2.0% White216 16.3% Asian25 1.2% Other race17 0.4% Two or more races154 1.1% White alone, not Hispanic / Latino16 0.2% Hispanic or Latino
Children Nativity (place of birth) in Harker Heights
Children under 6 years - Living with two parents Both parents native 965 100.0% NativeBoth parents foreign-born 294 74.0% Native103 26.0% Foreign-bornOne native, one foreign-born parent 293 100.0% NativeChildren under 6 years - Living with one parent Native parent 590 100.0% NativeForeign-born parent 167 100.0% NativeChildren 6 to 17 years - Living with two parents Both parents native 3,587 100.0% NativeBoth parents foreign-born 373 46.0% Native438 54.0% Foreign-bornOne native, one foreign-born parent 236 100.0% NativeChildren 6 to 17 years - Living with one parent Native parent 2,492 100.0% NativeForeign-born parent 136 51.9% Native126 48.1% Foreign-born
Grandparents responsible for own grandchildren in Harker Heights
Grandparents (30 to 59 years) White / Caucasian 59 85.1% Responsible for grandchildren10 14.9% Not responsible for grandchildrenBlack or African American 30 21.7% Responsible for grandchildren109 78.3% Not responsible for grandchildrenWhite alone, not Hispanic / Latino 65 88.7% Responsible for grandchildren8 11.3% Not responsible for grandchildrenGrandparents (60 years and over) White / Caucasian 153 63.1% Responsible for grandchildren89 36.9% Not responsible for grandchildrenBlack or African American 112 100.0% Not responsible for grandchildrenWhite alone, not Hispanic / Latino 179 81.1% Responsible for grandchildren42 18.9% Not responsible for grandchildren