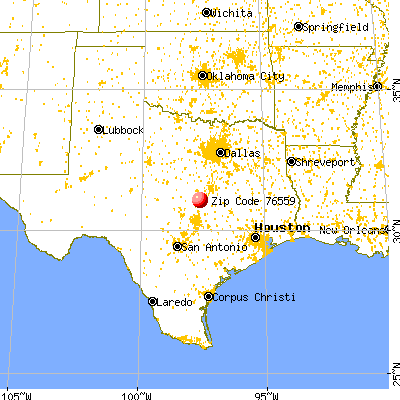
Averages for the 2020 tax year for zip code 76559, filed in 2021:
Average Adjusted Gross Income (AGI) in 2020: $61,214 (Individual Income Tax Returns)
Here:
$61,214
State:
$77,054
Salary/wage: $52,748 (reported on 86.9% of returns)
Here:
$52,748
State:
$62,766
(% of AGI for various income ranges: 1183.2% for AGIs below $25k, 3621.0% for AGIs $25k-50k, 6297.1% for AGIs $50k-75k, 8785.0% for AGIs $75k-100k, 16615.8% for AGIs $100k-200k, 83835.0% for AGIs over 200k)
Taxable interest for individuals: $731 (reported on 21.6% of returns)
This zip code:
$731
Texas:
$2,665
(% of AGI for various income ranges: 3.3% for AGIs below $25k, 10.9% for AGIs $25k-50k, 12.3% for AGIs $50k-75k, 26.5% for AGIs $75k-100k, 46.7% for AGIs $100k-200k, 695.0% for AGIs over 200k)
Ordinary dividends: $1,915 (reported on 9.5% of returns)
Here:
$1,915
State:
$10,044
(% of AGI for various income ranges: 7.6% for AGIs below $25k, 1.6% for AGIs $25k-50k, 14.3% for AGIs $50k-75k, 52.0% for AGIs $75k-100k, 78.3% for AGIs $100k-200k, 545.0% for AGIs over 200k)
Net capital gain/loss in AGI: +$8,310 (reported on 11.0% of returns)
Here:
+$8,310
State:
+$39,590
(% of AGI for various income ranges: 1.7% for AGIs below $25k, 8.4% for AGIs $25k-50k, 32.0% for AGIs $50k-75k, 74.5% for AGIs $75k-100k, 300.0% for AGIs $100k-200k, 7625.0% for AGIs over 200k)
Profit/loss from business: +$5,627 (reported on 14.5% of returns)
Here:
+$5,627
State:
+$10,888
(% of AGI for various income ranges: 71.7% for AGIs below $25k, 44.3% for AGIs $25k-50k, 35.4% for AGIs $50k-75k, 123.5% for AGIs $75k-100k, 119.6% for AGIs $100k-200k, 4135.0% for AGIs over 200k)
Taxable individual retirement arrangement distribution: $15,438 (reported on 4.6% of returns)
76559:
$15,438
Texas:
$24,740
(% of AGI for various income ranges: 24.2% for AGIs below $25k, 52.0% for AGIs $25k-50k, 174.0% for AGIs $75k-100k, 469.2% for AGIs $100k-200k)
Total itemized deductions: $32,076 (reported on 6.0% of returns)
Here:
$32,076
State:
$40,428
(% of AGI for various income ranges: 276.9% for AGIs $50k-75k, 428.5% for AGIs $75k-100k, 955.8% for AGIs $100k-200k, 6665.0% for AGIs over 200k)
Charity contributions: $15,246 (reported on 4.6% of returns)
Here:
$15,246
State:
$18,201
(% of AGI for various income ranges: 47.2% for AGIs $25k-50k, 148.0% for AGIs $75k-100k, 377.1% for AGIs $100k-200k, 2275.0% for AGIs over 200k)
Taxes paid: $7,587 (reported on 5.3% of returns)
76559:
$7,587
State:
$7,821
(% of AGI for various income ranges: 46.9% for AGIs $50k-75k, 103.5% for AGIs $75k-100k, 190.8% for AGIs $100k-200k, 1545.0% for AGIs over 200k)
Earned income credit: $2,600 (reported on 21.6% of returns)
Here:
$2,600
State:
$2,584
(% of AGI for various income ranges: 121.2% for AGIs below $25k, 103.3% for AGIs $25k-50k)
Percentage of individuals using paid preparers for their 2020 taxes: 96.1%
Here:
96%
State:
92%
(% for various income ranges: 95.3% for AGIs below $25k, 96.3% for AGIs $25k-50k, 95.3% for AGIs $50k-75k, 96.3% for AGIs $75k-100k, 97.4% for AGIs $100k-200k, 100.0% for AGIs over 200k)
Averages for the 2012 tax year for zip code 76559, filed in 2013:
Average Adjusted Gross Income (AGI) in 2012: $51,849 (Individual Income Tax Returns)
Here:
$51,849
State:
$65,384
Salary/wage: $45,076 (reported on 90.7% of returns)
Here:
$45,076
State:
$52,524
(% of AGI for various income ranges: 89.0% for AGIs below $25k, 89.1% for AGIs $25k-50k, 86.2% for AGIs $50k-75k, 84.5% for AGIs $75k-100k, 83.0% for AGIs $100k-200k, 44.2% for AGIs over 200k)
Taxable interest for individuals: $782 (reported on 22.0% of returns)
This zip code:
$782
Texas:
$2,372
(% of AGI for various income ranges: 0.5% for AGIs below $25k, 0.1% for AGIs $25k-50k, 0.3% for AGIs $50k-75k, 0.1% for AGIs $100k-200k, 1.0% for AGIs over 200k)
Ordinary dividends: $1,368 (reported on 10.7% of returns)
Here:
$1,368
State:
$9,721
(% of AGI for various income ranges: 0.3% for AGIs below $25k, 0.2% for AGIs $25k-50k, 0.1% for AGIs $50k-75k, 0.1% for AGIs $75k-100k, 0.2% for AGIs $100k-200k, 0.8% for AGIs over 200k)
Net capital gain/loss in AGI: +$2,207 (reported on 7.3% of returns)
Here:
+$2,207
State:
+$35,319
(% of AGI for various income ranges: 1.9% for AGIs over 200k)
Profit/loss from business: +$10,587 (reported on 11.2% of returns)
Here:
+$10,587
State:
+$13,732
(% of AGI for various income ranges: 4.8% for AGIs below $25k, 0.6% for AGIs $25k-50k, 0.6% for AGIs $50k-75k, 0.9% for AGIs $75k-100k, 6.8% for AGIs $100k-200k)
Taxable individual retirement arrangement distribution: $11,656 (reported on 4.4% of returns)
76559:
$11,656
Texas:
$19,511
(% of AGI for various income ranges: 1.2% for AGIs $25k-50k, 1.2% for AGIs $50k-75k, 2.4% for AGIs $100k-200k)
Total itemized deductions: $19,546 (18% of AGI, reported on 22.4% of returns)
Here:
$19,546
State:
$24,724
Here:
18.0% of AGI
State:
15.9% of AGI
(% of AGI for various income ranges: 5.1% for AGIs below $25k, 4.3% for AGIs $25k-50k, 9.1% for AGIs $50k-75k, 10.3% for AGIs $75k-100k, 13.1% for AGIs $100k-200k, 6.9% for AGIs over 200k)
Charity contributions: $4,676 (reported on 16.6% of returns)
Here:
$4,676
State:
$6,808
(% of AGI for various income ranges: 0.6% for AGIs $25k-50k, 1.5% for AGIs $50k-75k, 2.0% for AGIs $75k-100k, 2.6% for AGIs $100k-200k, 1.6% for AGIs over 200k)
Taxes paid: $5,554 (reported on 22.4% of returns)
76559:
$5,554
State:
$6,921
(% of AGI for various income ranges: 1.2% for AGIs below $25k, 1.1% for AGIs $25k-50k, 2.4% for AGIs $50k-75k, 2.8% for AGIs $75k-100k, 3.9% for AGIs $100k-200k, 2.3% for AGIs over 200k)
Earned income credit: $2,436 (reported on 25.9% of returns)
Here:
$2,436
State:
$2,570
(% of AGI for various income ranges: 9.0% for AGIs below $25k, 2.1% for AGIs $25k-50k)
Percentage of individuals using paid preparers for their 2012 taxes: 43.4%
Here:
43%
State:
51%
(% for various income ranges: 40.8% for AGIs below $25k, 43.1% for AGIs $25k-50k, 46.9% for AGIs $50k-75k, 41.2% for AGIs $75k-100k, 41.2% for AGIs $100k-200k, 80.0% for AGIs over 200k)
Averages for the 2004 tax year for zip code 76559, filed in 2005:
Average Adjusted Gross Income (AGI) in 2004: $33,218 (Individual Income Tax Returns)
Here:
$33,218
State:
$47,881
Salary/wage: $32,096 (reported on 89.8% of returns)
Here:
$32,096
State:
$41,947
(% of AGI for various income ranges: 121.7% for AGIs below $10k, 86.3% for AGIs $10k-25k, 90.2% for AGIs $25k-50k, 91.1% for AGIs $50k-75k, 88.1% for AGIs $75k-100k, 63.9% for AGIs over 100k)
Taxable interest for individuals: $606 (reported on 22.7% of returns)
This zip code:
$606
Texas:
$2,255
(% of AGI for various income ranges: 1.7% for AGIs below $10k, 0.9% for AGIs $10k-25k, 0.4% for AGIs $25k-50k, 0.2% for AGIs $50k-75k, 0.1% for AGIs $75k-100k, 0.4% for AGIs over 100k)
Taxable dividends: $488 (reported on 9.4% of returns)
Here:
$488
State:
$4,261
(% of AGI for various income ranges: 0.4% for AGIs below $10k, 0.1% for AGIs $10k-25k, 0.1% for AGIs $25k-50k, 0.1% for AGIs $50k-75k, 0.0% for AGIs $75k-100k, 0.5% for AGIs over 100k)
Net capital gain/loss: +$320 (reported on 7.5% of returns)
Here:
+$320
State:
+$16,110
(% of AGI for various income ranges: 0.3% for AGIs below $10k, -0.2% for AGIs $10k-25k, -0.0% for AGIs $25k-50k, 0.1% for AGIs $50k-75k, 0.2% for AGIs $75k-100k, 0.4% for AGIs over 100k)
Profit/loss from business: +$3,645 (reported on 11.7% of returns)
Here:
+$3,645
State:
+$11,013
(% of AGI for various income ranges: 12.0% for AGIs below $10k, 2.9% for AGIs $10k-25k, 1.6% for AGIs $25k-50k, 0.3% for AGIs $50k-75k)
IRA payment deduction: $2,846 (reported on 1.0% of returns)
76559:
$2,846
Texas:
$3,120
Total itemized deductions: $15,889 (24% of AGI, reported on 16.3% of returns)
Here:
$15,889
State:
$19,631
Here:
24.4% of AGI
State:
18.9% of AGI
(% of AGI for various income ranges: 4.0% for AGIs $10k-25k, 5.7% for AGIs $25k-50k, 10.1% for AGIs $50k-75k, 10.6% for AGIs $75k-100k, 11.2% for AGIs over 100k)
Charity contributions deductions: $3,542 (5% of AGI, reported on 12.7% of returns)
Here:
$3,542
State:
$4,753
Here:
5.1% of AGI
State:
4.2% of AGI
(% of AGI for various income ranges: 0.6% for AGIs $10k-25k, 0.7% for AGIs $25k-50k, 2.1% for AGIs $50k-75k, 1.5% for AGIs $75k-100k, 2.4% for AGIs over 100k)
Total tax: $4,067 (reported on 66.1% of returns)
76559:
$4,067
State:
$9,058
(% of AGI for various income ranges: 2.6% for AGIs below $10k, 3.3% for AGIs $10k-25k, 5.6% for AGIs $25k-50k, 8.3% for AGIs $50k-75k, 10.5% for AGIs $75k-100k, 17.1% for AGIs over 100k)
Earned income credit: $1,844 (reported on 27.0% of returns)
Here:
$1,844
State:
$2,024
Percentage of individuals using paid preparers for their 2004 taxes: 53.6%
Here:
54%
State:
57%
(% for various income ranges: 49.8% for AGIs below $10k, 57.1% for AGIs $10k-25k, 56.5% for AGIs $25k-50k, 48.1% for AGIs $50k-75k, 54.3% for AGIs $75k-100k, 42.9% for AGIs over 100k)
Likely homosexual households (counted as self-reported same-sex unmarried-partner households)
Lesbian couples: 0.0% of all households
Gay men: 0.5% of all households
Household received Food Stamps/SNAP in the past 12 months: 176 Household did not receive Food Stamps/SNAP in the past 12 months: 2,268
Women who had a birth in the past 12 months: 158 (13 now married, 138 unmarried) Women who did not have a birth in the past 12 months: 1,243 (785 now married, 450 unmarried)
Housing units in zip code 76559 with a mortgage: 1,249 (18 second mortgage, 20 both second mortgage and home equity loan) Median monthly owner costs for units with a mortgage: $1,491 Median monthly owner costs for units without a mortgage: $352
Residents with income below the poverty level in 2022:
This zip code:
18.3%
Whole state:
14.0%
Residents with income below 50% of the poverty level in 2022:
This zip code:
12.4%
Whole state:
7.4%
Median number of rooms in houses and condos:
Here:
5.6
State:
6.3
Median number of rooms in apartments:
Here:
4.1
State:
4.0
Notable locations in this zip code not listed on our city pages
Notable locations in zip code 76559: Church of Christ Campground (A), Nolanville Fire Department and Emergency Medical Service (B), J W Sims Community Center (C). Display/hide their locations on the map
Churches in zip code 76559 include: United Methodist Church (A), Highway of Holiness Church (B), Harvest Center Church (C), First Baptist Church (D), Church of Christ (E). Display/hide their locations on the map
Size of family households: 809 2-persons, 386 3-persons, 350 4-persons, 261 5-persons, 39 6-persons, 9 7-or-more-persons
Size of nonfamily households: 467 1-person, 119 2-persons
657 married couples with children.
1,063 single-parent households (368 men, 695 women).
89.7% of residents of 76559 zip code speak English at home.
9.0% of residents speak Spanish at home (88% very well, 7% well, 3% not well, 2% not at all).
0.3% of residents speak other Indo-European language at home (100% very well).
0.7% of residents speak Asian or Pacific Island language at home (27% very well, 73% well).
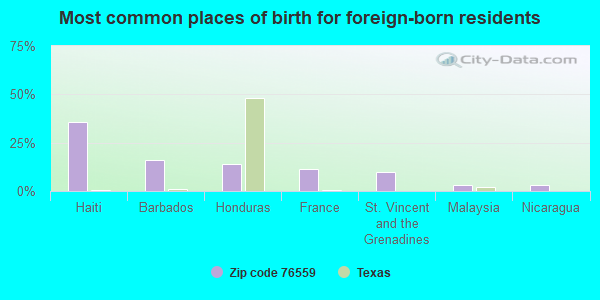
Foreign born population: 318 (4.8%) (87.2% of them are naturalized citizens)
This zip code:
4.8%
Whole state:
17.2%
36%Haiti
16%Barbados
14%Honduras
12%France
10%St. Vincent and the Grenadines
3%Malaysia
3%Nicaragua
15%American
13%Jamaican
7%English
3%Arab
3%European
3%German
1%Austrian
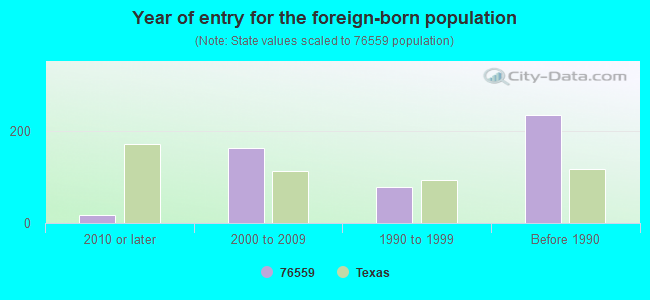
Year of entry for the foreign-born population
182010 or later
1632000 to 2009
791990 to 1999
236Before 1990
Facilities with environmental interests located in this zip code:
AMERROCK PRODUCTS LP (NO. 1 JACKRABBIT ROAD in NOLANVILLE, TX)
AIR MAJOR (AIRS/AFS) CRITERIA AND HAZARDOUS AIR POLLUTANT INVENTORY (Inventory of air pollution sources) (Resource Conservation and Recovery Act (tracking hazardous waste)) TRI REPORTER (Tracking of toxic chemicals releasing facilities) Business SIC and NAICS classification: MINERAL WOOL Alternative names: AMERICAN ROCKWOOL INC., AMERICAN ROCKWOOL INC. (DBA THERMAFIBER), THERMAFIBER
Housing units lacking complete plumbing facilities: 1.5% Housing units lacking complete kitchen facilities: 2.9%
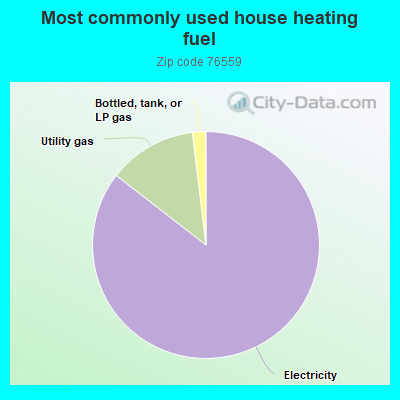
85.5%Electricity
12.6%Utility gas
1.9%Bottled, tank, or LP gas
Population in 1990: 1,820. Population change in the 1990s: +540 (+29.7%).
Place of birth for U.S.-born residents:
This state: 3,636
Northeast: 293
Midwest: 528
South: 1,066
West: 567
50% of the 76559 zip code residents lived in the same house 5 years ago. Out of people who lived in different houses, 56% lived in this county. Out of people who lived in different counties, 50% lived in Texas.
77% of the 76559 zip code residents lived in the same house 1 year ago. Out of people who lived in different houses, 50% moved from this county. Out of people who lived in different houses, 32% moved from different county within same state. Out of people who lived in different houses, 16% moved from different state.
Private vs. public school enrollment:
Students in private schools in grades 1 to 8 (elementary and middle school): 124
Here:
12.2%
Texas:
8.8%
Students in private schools in grades 9 to 12 (high school): 77
Here:
25.0%
Texas:
8.0%
Students in private undergraduate colleges:
Here:
0.0%
Texas:
16.2%
Occupation by median earnings in the past 12 months ($)
74,953Transportation occupations
67,851Management occupations
64,598Health diagnosing and treating practitioners and other technical occupations
62,286Installation, maintenance, and repair occupations
57,016Education, training, and library occupations
52,719Construction and extraction occupations
Companies with federal contracts located in this zip code:
SHAPKOFF MOVING SERVICES INC (902 W HIGHWAY 190 in NOLANVILLE, TX; small business) : $248,924 in 8 contractsfrom 2003 to 2006
Contracts for Packing/Crating Services, Warehousing and Storage Services by Army Signed by year:2000: $0; 2001: $0; 2002: $0; 2003: $13,184; 2004: $165,781; 2005: $49,824; 2006: $20,135.
Biggest contracts:
$100,332 with Army for Packing/Crating Services. Signed on 2004-01-29. Completion date: 2005-01-31.
$73,161, same as above.Signed on 2005-01-27. Completion date: 2005-01-31.
$60,516, same as above.Signed on 2004-04-23. Completion date: 2005-01-31.
$20,135, same as above.Signed on 2006-02-01. Completion date: 2006-09-30.
Top industries in this zip code by the number of employees in 2005:
Professional, Scientific, and Technical Services: Computer Systems Design Services (20-49 employees: 1 establishment)
Mining: Crushed and Broken Limestone Mining and Quarrying (20-49: 1)
Mining: Construction Sand and Gravel Mining (20-49: 1)
Accommodation and Food Services: Limited-Service Restaurants (10-19: 1)
Construction: Residential Remodelers (5-9: 1)
Wholesale Trade: Roofing, Siding, and Insulation Material Merchant Wholesalers (5-9: 1)
Other Services (except Public Administration): Religious Organizations (5-9: 1)
Fatal accident statistics in 2014:
Fatal accident count: 2
Vehicles involved in fatal accidents: 3
Fatal accidents caused by drunken drivers: 1
Fatalities: 2
Persons involved in fatal accidents: 4
Pedestrians involved in fatal accidents: 0
Fatal accident statistics in 2013:
Fatal accident count: 1
Vehicles involved in fatal accidents: 2
Fatal accidents caused by drunken drivers: 1
Fatalities: 1
Persons involved in fatal accidents: 3
Pedestrians involved in fatal accidents: 0
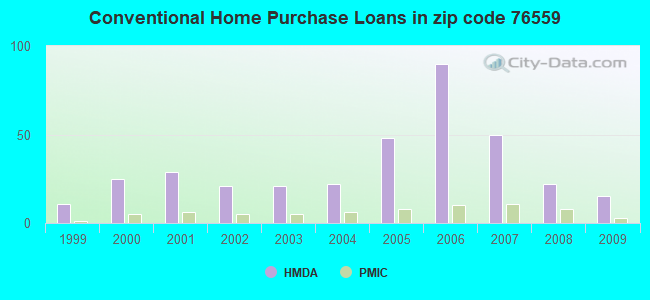
Home Mortgage Disclosure Act Aggregated Statistics For Year 2009 (Based on 2 partial tracts)
A) FHA, FSA/RHS & VA Home Purchase Loans
B) Conventional Home Purchase Loans
C) Refinancings
D) Home Improvement Loans
F) Non-occupant Loans on < 5 Family Dwellings (A B C & D)
G) Loans On Manufactured Home Dwelling (A B C & D)
Number
Average Value
Number
Average Value
Number
Average Value
Number
Average Value
Number
Average Value
Number
Average Value
LOANS ORIGINATED
40
$175,757
15
$189,561
50
$202,734
6
$38,390
4
$114,745
6
$86,183
APPLICATIONS APPROVED, NOT ACCEPTED
1
$134,470
1
$111,990
7
$217,857
0
$0
0
$0
0
$0
APPLICATIONS DENIED
2
$112,835
3
$69,850
14
$206,798
5
$37,668
0
$0
3
$48,500
APPLICATIONS WITHDRAWN
3
$246,883
2
$149,530
14
$205,313
1
$110,290
1
$210,400
0
$0
FILES CLOSED FOR INCOMPLETENESS
1
$209,550
2
$154,620
2
$139,775
0
$0
0
$0
0
$0
Aggregated Statistics For Year 2008 (Based on 2 partial tracts)
A) FHA, FSA/RHS & VA Home Purchase Loans
B) Conventional Home Purchase Loans
C) Refinancings
D) Home Improvement Loans
F) Non-occupant Loans on < 5 Family Dwellings (A B C & D)
G) Loans On Manufactured Home Dwelling (A B C & D)
Number
Average Value
Number
Average Value
Number
Average Value
Number
Average Value
Number
Average Value
Number
Average Value
LOANS ORIGINATED
42
$178,820
22
$177,759
21
$154,651
9
$49,679
8
$96,134
3
$54,297
APPLICATIONS APPROVED, NOT ACCEPTED
2
$213,375
3
$195,840
0
$0
1
$66,180
2
$182,405
0
$0
APPLICATIONS DENIED
4
$169,468
4
$117,502
22
$131,540
16
$56,419
1
$184,100
5
$44,880
APPLICATIONS WITHDRAWN
3
$240,240
3
$191,740
8
$116,761
4
$69,570
1
$156,530
0
$0
FILES CLOSED FOR INCOMPLETENESS
1
$240,100
0
$0
2
$187,920
0
$0
0
$0
0
$0
Aggregated Statistics For Year 2007 (Based on 2 partial tracts)
A) FHA, FSA/RHS & VA Home Purchase Loans
B) Conventional Home Purchase Loans
C) Refinancings
D) Home Improvement Loans
F) Non-occupant Loans on < 5 Family Dwellings (A B C & D)
G) Loans On Manufactured Home Dwelling (A B C & D)
Number
Average Value
Number
Average Value
Number
Average Value
Number
Average Value
Number
Average Value
Number
Average Value
LOANS ORIGINATED
37
$181,179
50
$137,924
17
$153,061
11
$25,259
12
$129,346
8
$72,804
APPLICATIONS APPROVED, NOT ACCEPTED
3
$117,363
7
$104,171
3
$147,057
3
$36,763
2
$61,720
2
$46,240
APPLICATIONS DENIED
1
$109,020
11
$129,613
20
$130,018
16
$49,101
5
$155,766
6
$62,145
APPLICATIONS WITHDRAWN
3
$163,740
7
$149,986
13
$97,729
1
$35,210
2
$102,655
0
$0
FILES CLOSED FOR INCOMPLETENESS
0
$0
1
$234,160
2
$96,295
0
$0
0
$0
0
$0
Aggregated Statistics For Year 2006 (Based on 2 partial tracts)
A) FHA, FSA/RHS & VA Home Purchase Loans
B) Conventional Home Purchase Loans
C) Refinancings
D) Home Improvement Loans
F) Non-occupant Loans on < 5 Family Dwellings (A B C & D)
G) Loans On Manufactured Home Dwelling (A B C & D)
Number
Average Value
Number
Average Value
Number
Average Value
Number
Average Value
Number
Average Value
Number
Average Value
LOANS ORIGINATED
67
$154,846
90
$103,543
20
$131,226
8
$46,874
26
$91,268
5
$32,494
APPLICATIONS APPROVED, NOT ACCEPTED
3
$111,283
12
$134,578
4
$237,340
2
$39,240
2
$96,505
4
$48,890
APPLICATIONS DENIED
5
$136,846
20
$67,851
18
$104,919
19
$25,407
4
$57,160
13
$59,192
APPLICATIONS WITHDRAWN
9
$191,361
10
$127,345
11
$108,749
1
$78,900
2
$81,660
0
$0
FILES CLOSED FOR INCOMPLETENESS
0
$0
3
$74,943
3
$118,777
0
$0
0
$0
0
$0
Aggregated Statistics For Year 2005 (Based on 2 partial tracts)
A) FHA, FSA/RHS & VA Home Purchase Loans
B) Conventional Home Purchase Loans
C) Refinancings
D) Home Improvement Loans
F) Non-occupant Loans on < 5 Family Dwellings (A B C & D)
G) Loans On Manufactured Home Dwelling (A B C & D)
Number
Average Value
Number
Average Value
Number
Average Value
Number
Average Value
Number
Average Value
Number
Average Value
LOANS ORIGINATED
70
$125,309
48
$111,927
21
$142,632
10
$76,101
10
$97,142
4
$50,585
APPLICATIONS APPROVED, NOT ACCEPTED
2
$81,870
8
$77,470
4
$104,035
3
$21,070
0
$0
6
$47,863
APPLICATIONS DENIED
3
$100,817
15
$81,249
26
$80,484
11
$31,892
1
$57,270
14
$52,298
APPLICATIONS WITHDRAWN
5
$154,324
6
$122,877
18
$179,861
4
$231,082
3
$105,343
1
$57,270
FILES CLOSED FOR INCOMPLETENESS
0
$0
3
$55,287
5
$134,642
1
$14,420
0
$0
0
$0
Aggregated Statistics For Year 2004 (Based on 2 partial tracts)
A) FHA, FSA/RHS & VA Home Purchase Loans
B) Conventional Home Purchase Loans
C) Refinancings
D) Home Improvement Loans
F) Non-occupant Loans on < 5 Family Dwellings (A B C & D)
G) Loans On Manufactured Home Dwelling (A B C & D)
Number
Average Value
Number
Average Value
Number
Average Value
Number
Average Value
Number
Average Value
Number
Average Value
LOANS ORIGINATED
16
$118,325
22
$114,418
25
$110,784
4
$27,150
5
$69,144
6
$44,965
APPLICATIONS APPROVED, NOT ACCEPTED
0
$0
3
$38,743
6
$100,112
0
$0
0
$0
3
$38,743
APPLICATIONS DENIED
0
$0
9
$49,443
28
$106,550
8
$19,408
2
$71,480
11
$44,078
APPLICATIONS WITHDRAWN
1
$78,900
3
$57,833
22
$81,504
0
$0
2
$58,750
2
$63,630
FILES CLOSED FOR INCOMPLETENESS
0
$0
0
$0
3
$73,810
0
$0
0
$0
0
$0
Aggregated Statistics For Year 2003 (Based on 2 partial tracts)
A) FHA, FSA/RHS & VA Home Purchase Loans
B) Conventional Home Purchase Loans
C) Refinancings
D) Home Improvement Loans
F) Non-occupant Loans on < 5 Family Dwellings (A B C & D)
Number
Average Value
Number
Average Value
Number
Average Value
Number
Average Value
Number
Average Value
LOANS ORIGINATED
12
$119,307
21
$96,314
54
$111,675
4
$13,998
8
$67,501
APPLICATIONS APPROVED, NOT ACCEPTED
0
$0
3
$46,097
6
$68,508
1
$11,880
0
$0
APPLICATIONS DENIED
0
$0
14
$48,419
25
$68,296
7
$23,391
2
$44,115
APPLICATIONS WITHDRAWN
2
$152,290
1
$198,950
28
$88,264
1
$3,820
1
$150,170
FILES CLOSED FOR INCOMPLETENESS
0
$0
1
$96,290
3
$72,257
0
$0
0
$0
Aggregated Statistics For Year 2002 (Based on 2 partial tracts)
A) FHA, FSA/RHS & VA Home Purchase Loans
B) Conventional Home Purchase Loans
C) Refinancings
D) Home Improvement Loans
F) Non-occupant Loans on < 5 Family Dwellings (A B C & D)
Number
Average Value
Number
Average Value
Number
Average Value
Number
Average Value
Number
Average Value
LOANS ORIGINATED
13
$135,581
21
$86,355
29
$103,827
3
$27,007
2
$48,995
APPLICATIONS APPROVED, NOT ACCEPTED
1
$55,150
11
$36,365
7
$96,536
1
$19,510
1
$69,140
APPLICATIONS DENIED
1
$100,960
20
$50,289
13
$61,933
3
$28,987
1
$36,910
APPLICATIONS WITHDRAWN
3
$119,060
2
$91,625
9
$80,221
0
$0
1
$42,420
FILES CLOSED FOR INCOMPLETENESS
0
$0
0
$0
2
$27,995
0
$0
0
$0
Aggregated Statistics For Year 2001 (Based on 2 partial tracts)
A) FHA, FSA/RHS & VA Home Purchase Loans
B) Conventional Home Purchase Loans
C) Refinancings
D) Home Improvement Loans
E) Loans on Dwellings For 5+ Families
F) Non-occupant Loans on < 5 Family Dwellings (A B C & D)
Number
Average Value
Number
Average Value
Number
Average Value
Number
Average Value
Number
Average Value
Number
Average Value
LOANS ORIGINATED
24
$110,115
29
$81,373
21
$114,110
7
$16,483
2
$29,695
2
$34,150
APPLICATIONS APPROVED, NOT ACCEPTED
0
$0
10
$37,118
2
$35,420
1
$20,790
0
$0
0
$0
APPLICATIONS DENIED
2
$100,325
24
$53,467
13
$51,655
5
$13,404
0
$0
0
$0
APPLICATIONS WITHDRAWN
1
$142,960
3
$82,577
8
$63,046
0
$0
0
$0
0
$0
FILES CLOSED FOR INCOMPLETENESS
1
$51,330
2
$51,965
1
$120,050
0
$0
0
$0
0
$0
Aggregated Statistics For Year 2000 (Based on 2 partial tracts)
A) FHA, FSA/RHS & VA Home Purchase Loans
B) Conventional Home Purchase Loans
C) Refinancings
D) Home Improvement Loans
F) Non-occupant Loans on < 5 Family Dwellings (A B C & D)
Number
Average Value
Number
Average Value
Number
Average Value
Number
Average Value
Number
Average Value
LOANS ORIGINATED
19
$89,350
25
$83,754
6
$68,083
2
$14,425
3
$59,387
APPLICATIONS APPROVED, NOT ACCEPTED
4
$52,178
5
$57,012
2
$53,235
0
$0
0
$0
APPLICATIONS DENIED
5
$46,832
23
$45,039
10
$75,253
5
$20,108
4
$44,118
APPLICATIONS WITHDRAWN
3
$73,953
2
$72,115
2
$85,900
0
$0
0
$0
FILES CLOSED FOR INCOMPLETENESS
0
$0
0
$0
1
$113,690
0
$0
0
$0
Aggregated Statistics For Year 1999 (Based on 1 partial tract)
A) FHA, FSA/RHS & VA Home Purchase Loans
B) Conventional Home Purchase Loans
C) Refinancings
D) Home Improvement Loans
F) Non-occupant Loans on < 5 Family Dwellings (A B C & D)
Detailed PMIC statistics for the following Tracts:0218.00
2002 - 2018 National Fire Incident Reporting System (NFIRS) incidents
According to the data from the years 2002 - 2018 the average number of fires per year is 27. The highest number of fire incidents - 49 took place in 2013, and the least - 3 in 2002. The data has a growing trend.
When looking into fire subcategories, the most reports belonged to: Outside Fires (52.4%), and Structure Fires (25.2%).
Fire incident types reported to NFIRS in Zip Code 76559


 Nearest zip codes: 76548, 76543, 76513, 76541, 76571, 76542.


 According to the data from the years 2002 - 2018 the average number of fires per year is 27. The highest number of fire incidents - 49 took place in 2013, and the least - 3 in 2002. The data has a growing trend.
 When looking into fire subcategories, the most reports belonged to: Outside Fires (52.4%), and Structure Fires (25.2%).