Estimated zip code population in 2022: 34,113 Zip code population in 2010: 30,430 Zip code population in 2000: 29,087
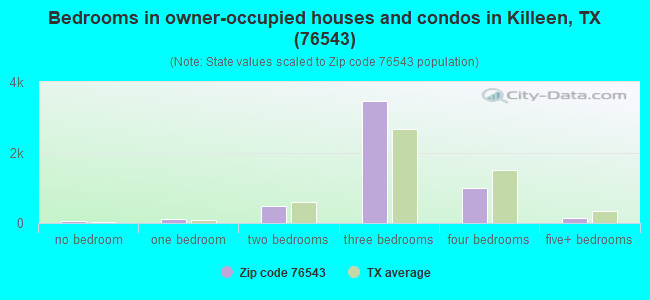
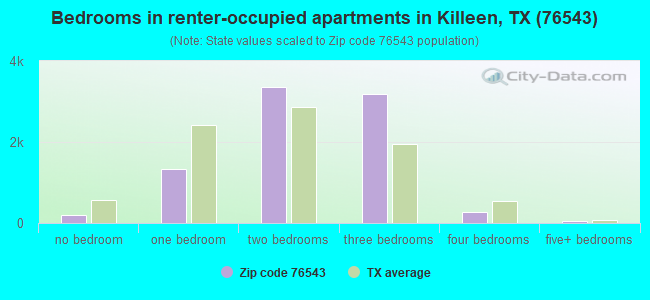
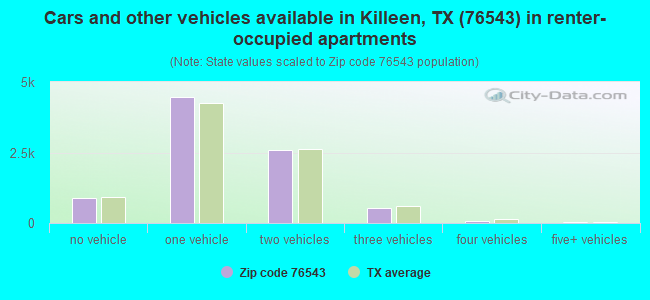
Houses and condos: 15,470 Renter-occupied apartments: 8,554
% of renters here:
62%
State:
38%
March 2022 cost of living index in zip code 76543: 84.4 (less than average, U.S. average is 100)
Land area: 48.6 sq. mi. Water area: 0.3 sq. mi.
Population density: 702 people per square mile
(low).
OSM Map
General Map
Google Map
MSN Map
OSM Map
General Map
Google Map
MSN Map
OSM Map
General Map
Google Map
MSN Map
OSM Map
General Map
Google Map
MSN Map
Please wait while loading the map...
Real estate property taxes paid for housing units in 2022:
This zip code:
1.6% ($2,321)
Texas:
1.5% ($4,050)
Median real estate property taxes paid for housing units with mortgages in 2022: $2,654 (1.6%) Median real estate property taxes paid for housing units with no mortgage in 2022: $1,871 (1.4%)
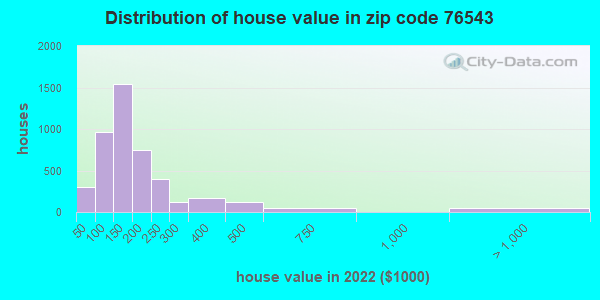
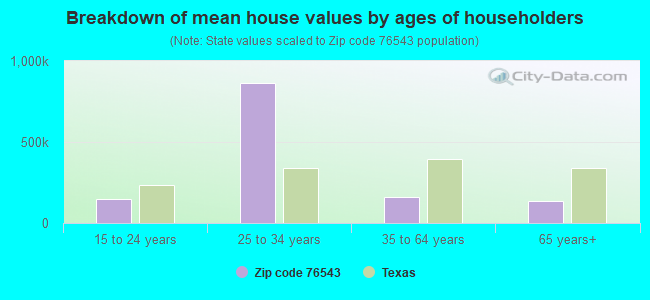
Estimated median house/condo value in 2022: $142,444
76543:
$142,444
Texas:
$275,400
According to our research of Texas and other state lists, there were 80 registered sex offenders living in 76543 zip code as of June 07, 2024. The ratio of all residents to sex offenders in zip code 76543 is 373 to 1. The ratio of registered sex offenders to all residents in this zip code is near the state average.
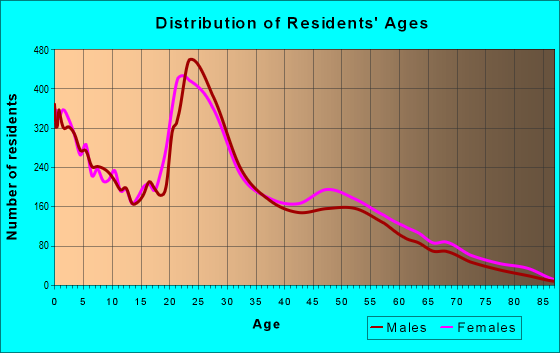
Median resident age:
This zip code:
29.8 years
Texas median age:
35.6 years
Average household size:
This zip code:
2.5 people
Texas:
2.6 people
Averages for the 2020 tax year for zip code 76543, filed in 2021:
Average Adjusted Gross Income (AGI) in 2020: $35,777 (Individual Income Tax Returns)
Here:
$35,777
State:
$77,054
Salary/wage: $32,329 (reported on 86.0% of returns)
Here:
$32,329
State:
$62,766
(% of AGI for various income ranges: 1232.9% for AGIs below $25k, 3437.7% for AGIs $25k-50k, 6025.2% for AGIs $50k-75k, 8767.3% for AGIs $75k-100k, 14637.0% for AGIs $100k-200k)
Taxable interest for individuals: $873 (reported on 11.3% of returns)
This zip code:
$873
Texas:
$2,665
(% of AGI for various income ranges: 5.3% for AGIs below $25k, 5.0% for AGIs $25k-50k, 17.8% for AGIs $50k-75k, 35.8% for AGIs $75k-100k, 84.0% for AGIs $100k-200k)
Ordinary dividends: $1,504 (reported on 4.9% of returns)
Here:
$1,504
State:
$10,044
(% of AGI for various income ranges: 2.2% for AGIs below $25k, 2.7% for AGIs $25k-50k, 9.4% for AGIs $50k-75k, 38.4% for AGIs $75k-100k, 105.0% for AGIs $100k-200k)
Net capital gain/loss in AGI: +$6,209 (reported on 5.3% of returns)
Here:
+$6,209
State:
+$39,590
(% of AGI for various income ranges: 1.0% for AGIs below $25k, 6.8% for AGIs $25k-50k, 23.3% for AGIs $50k-75k, 106.2% for AGIs $75k-100k, 480.3% for AGIs $100k-200k)
Profit/loss from business: +$5,017 (reported on 12.6% of returns)
Here:
+$5,017
State:
+$10,888
(% of AGI for various income ranges: 65.3% for AGIs below $25k, 31.8% for AGIs $25k-50k, 77.2% for AGIs $50k-75k, 101.6% for AGIs $75k-100k, 820.0% for AGIs $100k-200k)
Taxable individual retirement arrangement distribution: $9,988 (reported on 2.3% of returns)
76543:
$9,988
Texas:
$24,740
(% of AGI for various income ranges: 9.2% for AGIs below $25k, 11.3% for AGIs $25k-50k, 58.8% for AGIs $50k-75k, 123.8% for AGIs $75k-100k, 290.7% for AGIs $100k-200k)
Total itemized deductions: $28,376 (reported on 1.8% of returns)
Here:
$28,376
State:
$40,428
(% of AGI for various income ranges: 6.7% for AGIs below $25k, 44.4% for AGIs $25k-50k, 109.8% for AGIs $50k-75k, 238.7% for AGIs $75k-100k, 434.0% for AGIs $100k-200k)
Charity contributions: $12,180 (reported on 1.4% of returns)
Here:
$12,180
State:
$18,201
(% of AGI for various income ranges: 10.9% for AGIs $25k-50k, 27.0% for AGIs $50k-75k, 89.6% for AGIs $75k-100k, 399.0% for AGIs $100k-200k)
Taxes paid: $4,627 (reported on 1.6% of returns)
76543:
$4,627
State:
$7,821
(% of AGI for various income ranges: 0.9% for AGIs below $25k, 4.9% for AGIs $25k-50k, 11.2% for AGIs $50k-75k, 37.8% for AGIs $75k-100k, 84.7% for AGIs $100k-200k)
Earned income credit: $2,707 (reported on 32.1% of returns)
Here:
$2,707
State:
$2,584
(% of AGI for various income ranges: 143.9% for AGIs below $25k, 97.4% for AGIs $25k-50k, 2.8% for AGIs $50k-75k)
Percentage of individuals using paid preparers for their 2020 taxes: 95.0%
Here:
95%
State:
92%
(% for various income ranges: 95.3% for AGIs below $25k, 95.7% for AGIs $25k-50k, 93.8% for AGIs $50k-75k, 93.8% for AGIs $75k-100k, 91.8% for AGIs $100k-200k, 85.7% for AGIs over 200k)
Averages for the 2012 tax year for zip code 76543, filed in 2013:
Average Adjusted Gross Income (AGI) in 2012: $34,150 (Individual Income Tax Returns)
Here:
$34,150
State:
$65,384
Salary/wage: $30,057 (reported on 89.5% of returns)
Here:
$30,057
State:
$52,524
(% of AGI for various income ranges: 90.5% for AGIs below $25k, 88.5% for AGIs $25k-50k, 79.1% for AGIs $50k-75k, 77.4% for AGIs $75k-100k, 73.3% for AGIs $100k-200k, 17.6% for AGIs over 200k)
Taxable interest for individuals: $1,111 (reported on 14.4% of returns)
This zip code:
$1,111
Texas:
$2,372
(% of AGI for various income ranges: 0.3% for AGIs below $25k, 0.2% for AGIs $25k-50k, 0.3% for AGIs $50k-75k, 0.2% for AGIs $75k-100k, 0.4% for AGIs $100k-200k, 2.6% for AGIs over 200k)
Ordinary dividends: $2,579 (reported on 5.6% of returns)
Here:
$2,579
State:
$9,721
(% of AGI for various income ranges: 0.6% for AGIs below $25k, 0.2% for AGIs $25k-50k, 0.4% for AGIs $50k-75k, 0.4% for AGIs $75k-100k, 0.4% for AGIs $100k-200k, 0.9% for AGIs over 200k)
Net capital gain/loss in AGI: +$11,796 (reported on 3.6% of returns)
Here:
+$11,796
State:
+$35,319
(% of AGI for various income ranges: 0.2% for AGIs $50k-75k, 0.1% for AGIs $75k-100k, 0.1% for AGIs $100k-200k, 14.3% for AGIs over 200k)
Profit/loss from business: +$5,866 (reported on 9.0% of returns)
Here:
+$5,866
State:
+$13,732
(% of AGI for various income ranges: 3.1% for AGIs below $25k, 0.6% for AGIs $25k-50k, 0.5% for AGIs $75k-100k, 5.7% for AGIs $100k-200k)
Taxable individual retirement arrangement distribution: $9,497 (reported on 2.9% of returns)
76543:
$9,497
Texas:
$19,511
(% of AGI for various income ranges: 0.4% for AGIs below $25k, 0.5% for AGIs $25k-50k, 0.7% for AGIs $50k-75k, 1.1% for AGIs $75k-100k, 2.7% for AGIs $100k-200k)
Total itemized deductions: $17,124 (24% of AGI, reported on 11.0% of returns)
Here:
$17,124
State:
$24,724
Here:
23.7% of AGI
State:
15.9% of AGI
(% of AGI for various income ranges: 2.9% for AGIs below $25k, 4.6% for AGIs $25k-50k, 6.5% for AGIs $50k-75k, 8.0% for AGIs $75k-100k, 9.1% for AGIs $100k-200k, 5.0% for AGIs over 200k)
Charity contributions: $5,501 (reported on 8.4% of returns)
Here:
$5,501
State:
$6,808
(% of AGI for various income ranges: 0.5% for AGIs below $25k, 0.9% for AGIs $25k-50k, 1.6% for AGIs $50k-75k, 2.1% for AGIs $75k-100k, 2.7% for AGIs $100k-200k, 2.1% for AGIs over 200k)
Taxes paid: $4,150 (reported on 10.5% of returns)
76543:
$4,150
State:
$6,921
(% of AGI for various income ranges: 0.6% for AGIs below $25k, 1.0% for AGIs $25k-50k, 1.4% for AGIs $50k-75k, 1.9% for AGIs $75k-100k, 2.4% for AGIs $100k-200k, 1.6% for AGIs over 200k)
Earned income credit: $2,587 (reported on 35.5% of returns)
Here:
$2,587
State:
$2,570
(% of AGI for various income ranges: 9.7% for AGIs below $25k, 2.0% for AGIs $25k-50k)
Percentage of individuals using paid preparers for their 2012 taxes: 43.9%
Here:
44%
State:
51%
(% for various income ranges: 42.7% for AGIs below $25k, 43.6% for AGIs $25k-50k, 45.6% for AGIs $50k-75k, 49.1% for AGIs $75k-100k, 51.3% for AGIs $100k-200k, 66.7% for AGIs over 200k)
Averages for the 2004 tax year for zip code 76543, filed in 2005:
Average Adjusted Gross Income (AGI) in 2004: $27,436 (Individual Income Tax Returns)
Here:
$27,436
State:
$47,881
Salary/wage: $25,670 (reported on 91.9% of returns)
Here:
$25,670
State:
$41,947
(% of AGI for various income ranges: 114.0% for AGIs below $10k, 94.3% for AGIs $10k-25k, 90.6% for AGIs $25k-50k, 84.0% for AGIs $50k-75k, 81.9% for AGIs $75k-100k, 53.7% for AGIs over 100k)
Taxable interest for individuals: $852 (reported on 19.3% of returns)
This zip code:
$852
Texas:
$2,255
(% of AGI for various income ranges: 0.9% for AGIs below $10k, 0.5% for AGIs $10k-25k, 0.5% for AGIs $25k-50k, 0.5% for AGIs $50k-75k, 0.5% for AGIs $75k-100k, 1.2% for AGIs over 100k)
Taxable dividends: $819 (reported on 7.2% of returns)
Here:
$819
State:
$4,261
(% of AGI for various income ranges: 0.3% for AGIs below $10k, 0.1% for AGIs $10k-25k, 0.1% for AGIs $25k-50k, 0.2% for AGIs $50k-75k, 0.5% for AGIs $75k-100k, 0.6% for AGIs over 100k)
Net capital gain/loss: +$5,899 (reported on 5.4% of returns)
Here:
+$5,899
State:
+$16,110
(% of AGI for various income ranges: -0.1% for AGIs below $10k, 0.1% for AGIs $10k-25k, 0.2% for AGIs $25k-50k, 0.5% for AGIs $50k-75k, 1.0% for AGIs $75k-100k, 7.6% for AGIs over 100k)
Profit/loss from business: +$7,508 (reported on 7.3% of returns)
Here:
+$7,508
State:
+$11,013
(% of AGI for various income ranges: 3.8% for AGIs below $10k, 1.0% for AGIs $10k-25k, 1.2% for AGIs $25k-50k, 1.3% for AGIs $50k-75k, 0.7% for AGIs $75k-100k, 7.8% for AGIs over 100k)
IRA payment deduction: $2,150 (reported on 1.4% of returns)
76543:
$2,150
Texas:
$3,120
(% of AGI for various income ranges: 0.1% for AGIs below $10k, 0.1% for AGIs $10k-25k, 0.1% for AGIs $25k-50k, 0.1% for AGIs $50k-75k, 0.1% for AGIs $75k-100k)
Self-employed pension: $16,462 (reported on 0.1% of returns)
Here:
$16,462
Texas:
$16,401
Total itemized deductions: $15,796 (29% of AGI, reported on 12.2% of returns)
Here:
$15,796
State:
$19,631
Here:
29.4% of AGI
State:
18.9% of AGI
(% of AGI for various income ranges: 6.0% for AGIs below $10k, 3.7% for AGIs $10k-25k, 7.9% for AGIs $25k-50k, 8.3% for AGIs $50k-75k, 9.9% for AGIs $75k-100k, 6.7% for AGIs over 100k)
Charity contributions deductions: $4,108 (7% of AGI, reported on 10.0% of returns)
Here:
$4,108
State:
$4,753
Here:
7.1% of AGI
State:
4.2% of AGI
(% of AGI for various income ranges: 0.4% for AGIs below $10k, 0.5% for AGIs $10k-25k, 1.4% for AGIs $25k-50k, 2.1% for AGIs $50k-75k, 2.3% for AGIs $75k-100k, 2.4% for AGIs over 100k)
Total tax: $3,612 (reported on 56.5% of returns)
76543:
$3,612
State:
$9,058
(% of AGI for various income ranges: 1.2% for AGIs below $10k, 2.7% for AGIs $10k-25k, 5.4% for AGIs $25k-50k, 8.7% for AGIs $50k-75k, 10.9% for AGIs $75k-100k, 19.6% for AGIs over 100k)
Earned income credit: $1,942 (reported on 34.3% of returns)
Here:
$1,942
State:
$2,024
Percentage of individuals using paid preparers for their 2004 taxes: 66.7%
Here:
67%
State:
57%
(% for various income ranges: 67.6% for AGIs below $10k, 70.9% for AGIs $10k-25k, 64.0% for AGIs $25k-50k, 60.1% for AGIs $50k-75k, 57.3% for AGIs $75k-100k, 59.0% for AGIs over 100k)
Likely homosexual households (counted as self-reported same-sex unmarried-partner households)
Lesbian couples: 0.1% of all households
Gay men: 0.2% of all households
Household received Food Stamps/SNAP in the past 12 months: 3,259 Household did not receive Food Stamps/SNAP in the past 12 months: 10,642
Women who had a birth in the past 12 months: 958 (612 now married, 343 unmarried) Women who did not have a birth in the past 12 months: 8,341 (3,450 now married, 4,897 unmarried)
Housing units in zip code 76543 with a mortgage: 2,829 (26 second mortgage, 28 both second mortgage and home equity loan) Houses without a mortgage: 34
Median monthly owner costs for units with a mortgage: $1,208 Median monthly owner costs for units without a mortgage: $471
Residents with income below the poverty level in 2022:
This zip code:
20.5%
Whole state:
14.0%
Residents with income below 50% of the poverty level in 2022:
This zip code:
9.6%
Whole state:
7.4%
Median number of rooms in houses and condos:
Here:
5.5
State:
6.3
Median number of rooms in apartments:
Here:
4.0
State:
4.0
Notable locations in this zip code not listed on our city pages
Reservoirs: Larned Lake (A), Nolan Lake (B), Soil Conservation Service Site 2 Reservoir (C), Soil Conservation Service Site 3 Reservoir (D), Engineer Lake (E), Tank Wash Lake (F), Heiner Lake (G). Display/hide their locations on the map
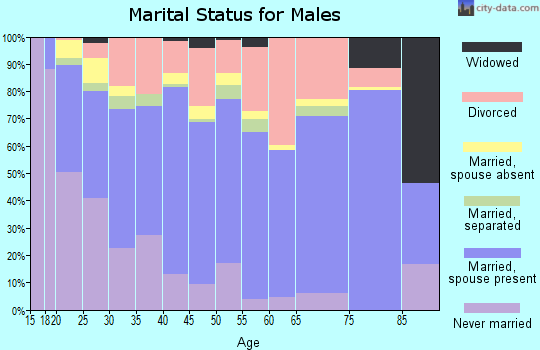
4,180 married couples with children.
4,413 single-parent households (1,039 men, 3,374 women).
75.7% of residents of 76543 zip code speak English at home.
17.3% of residents speak Spanish at home (72% very well, 19% well, 4% not well, 5% not at all).
1.8% of residents speak other Indo-European language at home (91% very well, 5% well, 4% not well).
4.0% of residents speak Asian or Pacific Island language at home (75% very well, 17% well, 7% not well, 1% not at all).
1.2% of residents speak other language at home (92% very well, 5% well, 3% not well).
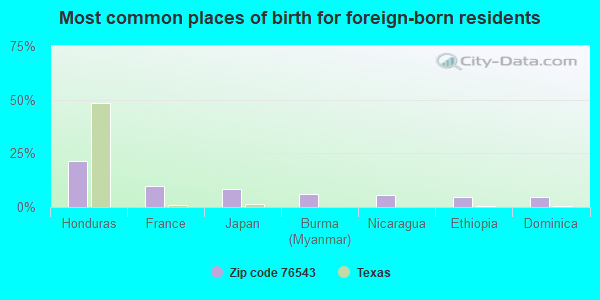
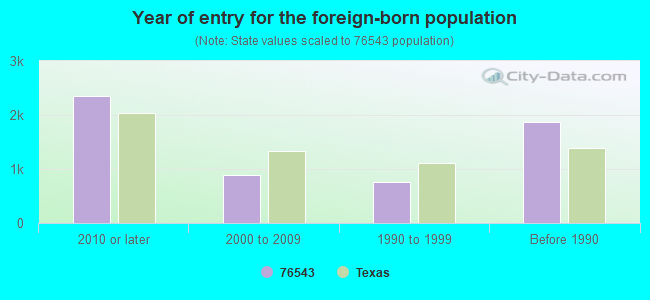
Foreign born population: 2,954 (8.7%) (57.8% of them are naturalized citizens)
Facilities with environmental interests located in this zip code:
AMERICAN DRIVE AXLE (4015 E VETERANS MEMORIAL BLVD in KILLEEN, TX)
(Resource Conservation and Recovery Act (tracking hazardous waste)) Business NAICS classification: MOTOR VEHICLE BODY MANUFACTURING. Organizations: HARDINTERRY (CONTACT/OPERATOR)
Alternative names: MRJ ENTERPRISES
AMERICAN DRIVE AXLE INC (405 COMMERCE in KILLEEN, TX)
(Resource Conservation and Recovery Act (tracking hazardous waste)) Business NAICS classification: AUTOMOTIVE TRANSMISSION REPAIR.
AMCOM PROJECT OLR (1202A RIO BLVD in KILLEEN, TX)
(Resource Conservation and Recovery Act (tracking hazardous waste)) Business NAICS classification: OTHER AIRPORT OPERATIONS. Alternative names: US ARMY ATCOM PROJECT OLR
Housing units lacking complete plumbing facilities: 2.7% Housing units lacking complete kitchen facilities: 3.6%
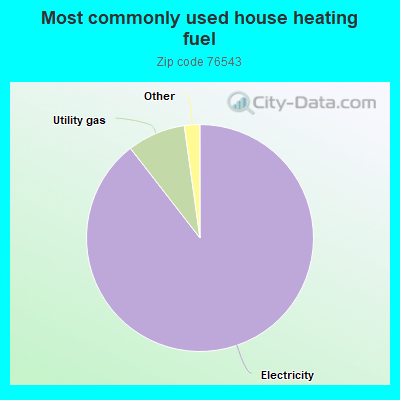
89.5%Electricity
8.3%Utility gas
0.7%Bottled, tank, or LP gas
0.5%Wood
Population in 1990: 35,052.
Place of birth for U.S.-born residents:
This state: 13,095
Northeast: 1,366
Midwest: 2,549
South: 6,616
West: 5,010
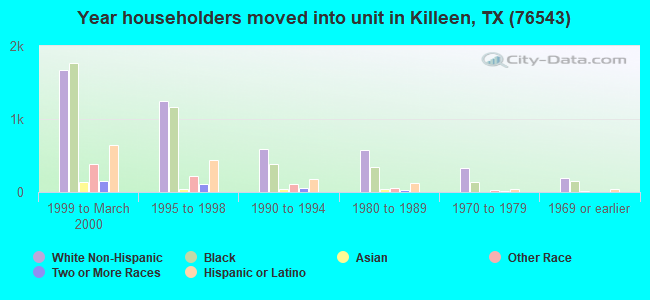
39% of the 76543 zip code residents lived in the same house 5 years ago. Out of people who lived in different houses, 35% lived in this county. Out of people who lived in different counties, 50% lived in Texas.
77% of the 76543 zip code residents lived in the same house 1 year ago. Out of people who lived in different houses, 44% moved from this county. Out of people who lived in different houses, 26% moved from different county within same state. Out of people who lived in different houses, 17% moved from different state. Out of people who lived in different houses, 13% moved from abroad.
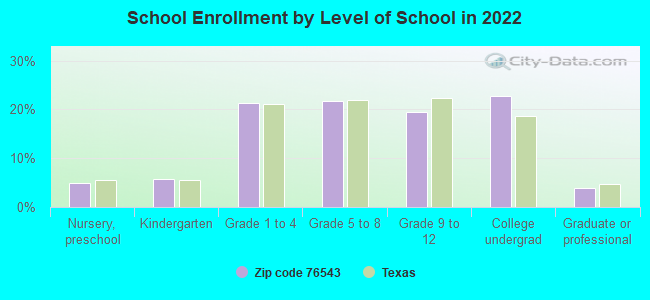
Private vs. public school enrollment:
Students in private schools in grades 1 to 8 (elementary and middle school): 551
Here:
15.0%
Texas:
8.8%
Students in private schools in grades 9 to 12 (high school): 157
Here:
9.6%
Texas:
8.0%
Students in private undergraduate colleges: 437
Here:
22.5%
Texas:
16.2%
Occupation by median earnings in the past 12 months ($)
134,879Legal occupations
75,053Architecture and engineering occupations
74,227Health diagnosing and treating practitioners and other technical occupations
58,639Computer and mathematical occupations
49,627Health technologists and technicians
48,789Business and financial operations occupations
Companies with biggest federal contracts located in this zip code (KILLEEN, TX):
BELL COUNTY WATER CONTROL AND (201 S 38TH ST; small business) : $15,222,285 in 129 contractsfrom 1999 to 2005
Contracts for Water Services, Waste Treatment and Storage, Other Utilities, Gas Services by Army Signed by year:2000: $7,437,130; 2001: $905,869; 2002: $1,504,999; 2003: $1,886,151; 2004: $1,928,107; 2005: $1,273,513; 2006: $0.
Biggest contracts:
$2,133,907 with Army for Water Services. Signed on 2000-08-01. Completion date: 2000-08-31.
$2,049,645, same as above.Signed on 2000-07-01. Completion date: 2000-07-31.
$1,991,324, same as above.Signed on 2000-06-01. Completion date: 2000-06-30.
$148,559, same as above.Signed on 2004-10-29. Completion date: 2004-11-30.
PEPSI BOTTLING COMPANY (612 TWIN CREEK) : $3,576,914 in 18 contractsfrom 2002 to 2006
Contracts for Food Items For Resale, Non-Food Items For Resale by Department of Defense, Defense Commissary Agency Signed by year:2000: $0; 2001: $0; 2002: $749,567; 2003: $430,577; 2004: $1,019,361; 2005: $945,168; 2006: $432,241.
Biggest contracts:
$575,070 with Department of Defense for Food Items For Resale. Signed on 2002-10-01. Completion date: 2003-05-31.
$560,644 with Defense Commissary Agency for Food Items For Resale. Signed on 2005-04-01. Completion date: 2005-08-31.
$478,784, same as above.Signed on 2004-10-01. Completion date: 2005-02-28.
$432,241 with Defense Commissary Agency for Non-Food Items For Resale. Signed on 2006-01-01. Completion date: 2006-03-31.
CENTROPLEX PEST CONTROL, INC (1108 BUNDRANT; small business) : $667,573 in 45 contractsfrom 2000 to 2006
Contracts for Insect and Rodent Control Services by Army Signed by year:2000: $87,875; 2001: $0; 2002: $196,993; 2003: $60,331; 2004: $196,483; 2005: $95,124; 2006: $30,767.
Biggest contracts:
$312,240 with Army for Insect and Rodent Control Services. Signed on 2002-03-04. Completion date: 2003-02-28.
$212,536, same as above.Signed on 2004-02-27. Completion date: 2005-02-28.
$183,720, same as above.Signed on 2003-03-12. Completion date: 2003-09-30.
$134,880, same as above.Signed on 2005-02-09. Completion date: 2005-09-30.
D B GIFFORD INC (6106 STILLWOOD DR; small business) : $392,626 in 9 contractsfrom 2001 to 2005
Contracts for Other Medical Services by Army Signed by year:2000: $0; 2001: $68,584; 2002: $104,880; 2003: $73,568; 2004: $78,341; 2005: $67,253; 2006: $0.
Biggest contracts:
$104,880 with Army for Other Medical Services. Signed on 2002-11-12. Completion date: 2002-09-30.
$95,640, same as above.Signed on 2004-10-08. Completion date: 2002-09-30.
$79,576, same as above.Signed on 2005-10-13. Completion date: 2002-09-30.
$73,568, same as above.Signed on 2003-10-01. Completion date: 2002-09-30.
TEXAS AERO INC (1525 AIRPORT DR, BOX K; small business)
$354,691 with Defense Logistics Agency for Liquid Propellants and Fuels, Petroleum Base. Signed on 2001-04-01. Completion date: 2004-03-31.
TEXAS COMPUZONE, INC (2201 S WS YOUNG DR; small business)
$271,500 with Army for ADP Supplies. Signed on 2004-09-25. Completion date: 2004-10-15.
HARPER TALASEK FUNERAL HOME (506 N 38TH STREET; small business) : $217,735 in 102 contractsfrom 2001 to 2006
Contracts for Care of Remains and/or Funeral Services by Army Signed by year:2000: $0; 2001: $6,045; 2002: $32,262; 2003: $35,983; 2004: $40,775; 2005: $68,283; 2006: $34,387.
Biggest contracts:
$3,410 with Army for Care of Remains and/or Funeral Services. Signed on 2005-08-26. Completion date: 2005-08-06.
$3,295, same as above.Signed on 2005-03-22. Completion date: 2005-03-12.
$3,111, same as above.Signed on 2006-05-01. Completion date: 2006-05-01.
$3,038, same as above.Signed on 2006-01-10. Completion date: 2005-12-01.
LONE STAR STORAGE TRAILER II, (3000 ILLINOIS AVENUE; small business) : $197,592 in 26 contractsfrom 2001 to 2005
Contracts for Specialized Shipping and Storage Containers, Lease or Rental of Equipment -- Containers, Packaging, and Packing Supplies, Boxes, Cartons, and Crates, Lease or Rental of Equipment -- Service and Trade Equipment by Army Signed by year:2000: $0; 2001: $21,384; 2002: $35,188; 2003: $108,010; 2004: $28,660; 2005: $4,350; 2006: $0.
Biggest contracts:
$49,515 with Army for Specialized Shipping and Storage Containers. Signed on 2003-07-03. Completion date: 2003-02-19.
$45,490 with Army for Lease or Rental of Equipment -- Containers, Packaging, and Packing Supplies. Signed on 2003-07-19. Completion date: 2004-01-26.
$19,800, same as above.Signed on 2004-01-29. Completion date: 2005-05-31.
$19,800, same as above.Signed on 2002-04-23. Completion date: 2002-06-19.
ENTERPRISE RENT A CAR (813 SWS YOUNG STE 3) : $160,961 in 9 contractsfrom 2000 to 2005
Contracts for Lease or Rental of Equipment -- Ground Effect Vehicles, Motor Vehicles, Trailers, and Cycles, Passenger Motor Vehicles by Army Signed by year:2000: $147,071; 2001: $0; 2002: $0; 2003: $4,088; 2004: $3,688; 2005: $6,114; 2006: $0.
Biggest contracts:
$112,344 with Army for Lease or Rental of Equipment -- Ground Effect Vehicles, Motor Vehicles, Trailers, and Cycles. Signed on 2000-10-04. Completion date: 2001-09-30.
$34,727 with Army for Passenger Motor Vehicles. Signed on 2000-06-23. Completion date: 2000-11-30.
$7,008 with Army for Lease or Rental of Equipment -- Ground Effect Vehicles, Motor Vehicles, Trailers, and Cycles. Signed on 2003-02-18. Completion date: 2003-03-03.
$4,800, same as above.Signed on 2004-03-31. Completion date: 2004-04-14.
SOUTHWEST-TEX LEASING CO INC (8101 M CLEAR CREEK RD; small business) : $96,836 in 13 contractsfrom 2001 to 2006
Contracts for Passenger Motor Vehicles, Lease or Rental of Equipment -- Ground Effect Vehicles, Motor Vehicles, Trailers, and Cycles by Army Signed by year:2000: $0; 2001: $70,920; 2002: $0; 2003: $11,540; 2004: $5,000; 2005: $8,910; 2006: $466.
Biggest contracts:
$70,920 with Army for Passenger Motor Vehicles. Signed on 2001-08-23. Completion date: 2001-10-15.
$8,910, same as above.Signed on 2005-11-22. Completion date: 2005-12-23.
$5,940 with Army for Lease or Rental of Equipment -- Ground Effect Vehicles, Motor Vehicles, Trailers, and Cycles. Signed on 2003-07-01. Completion date: 2003-12-31.
$2,970, same as above.Signed on 2004-01-26. Completion date: 2003-12-31.
Top industries in this zip code by the number of employees in 2005:
2002 - 2018 National Fire Incident Reporting System (NFIRS) incidents
According to the data from the years 2002 - 2018 the average number of fires per year is 101. The highest number of fires - 156 took place in 2011, and the least - 36 in 2009. The data has a dropping trend.
When looking into fire subcategories, the most incidents belonged to: Structure Fires (45.1%), and Outside Fires (37.5%).
Fire incident types reported to NFIRS in Zip Code 76543
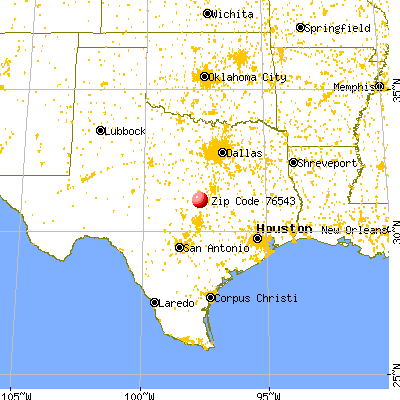


 Nearest zip codes: 76559, 76548, 76541, 76544, 76513, 76542.


 According to the data from the years 2002 - 2018 the average number of fires per year is 101. The highest number of fires - 156 took place in 2011, and the least - 36 in 2009. The data has a dropping trend.
 When looking into fire subcategories, the most incidents belonged to: Structure Fires (45.1%), and Outside Fires (37.5%).