Mount Clemens, Michigan Submit your own pictures of this city and show them to the world
OSM Map
General Map
Google Map
MSN Map
OSM Map
General Map
Google Map
MSN Map
OSM Map
General Map
Google Map
MSN Map
OSM Map
General Map
Google Map
MSN Map
Please wait while loading the map...
Population in 2022: 15,409 (100% urban, 0% rural). Population change since 2000: -11.0%Males: 7,972 Females: 7,437
March 2022 cost of living index in Mount Clemens: 95.1 (less than average, U.S. average is 100) Percentage of residents living in poverty in 2022: 16.8%for White Non-Hispanic residents , 27.8% for Black residents , 32.0% for Hispanic or Latino residents , 21.6% for American Indian residents , 32.6% for other race residents , 28.5% for two or more races residents )
Profiles of local businesses
Business Search - 14 Million verified businesses
Data:
Median household income ($)
Median household income (% change since 2000)
Household income diversity
Ratio of average income to average house value (%)
Ratio of average income to average rent
Median household income ($) - White
Median household income ($) - Black or African American
Median household income ($) - Asian
Median household income ($) - Hispanic or Latino
Median household income ($) - American Indian and Alaska Native
Median household income ($) - Multirace
Median household income ($) - Other Race
Median household income for houses/condos with a mortgage ($)
Median household income for apartments without a mortgage ($)
Races - White alone (%)
Races - White alone (% change since 2000)
Races - Black alone (%)
Races - Black alone (% change since 2000)
Races - American Indian alone (%)
Races - American Indian alone (% change since 2000)
Races - Asian alone (%)
Races - Asian alone (% change since 2000)
Races - Hispanic (%)
Races - Hispanic (% change since 2000)
Races - Native Hawaiian and Other Pacific Islander alone (%)
Races - Native Hawaiian and Other Pacific Islander alone (% change since 2000)
Races - Two or more races (%)
Races - Two or more races (% change since 2000)
Races - Other race alone (%)
Races - Other race alone (% change since 2000)
Racial diversity
Unemployment (%)
Unemployment (% change since 2000)
Unemployment (%) - White
Unemployment (%) - Black or African American
Unemployment (%) - Asian
Unemployment (%) - Hispanic or Latino
Unemployment (%) - American Indian and Alaska Native
Unemployment (%) - Multirace
Unemployment (%) - Other Race
Population density (people per square mile)
Population - Males (%)
Population - Females (%)
Population - Males (%) - White
Population - Males (%) - Black or African American
Population - Males (%) - Asian
Population - Males (%) - Hispanic or Latino
Population - Males (%) - American Indian and Alaska Native
Population - Males (%) - Multirace
Population - Males (%) - Other Race
Population - Females (%) - White
Population - Females (%) - Black or African American
Population - Females (%) - Asian
Population - Females (%) - Hispanic or Latino
Population - Females (%) - American Indian and Alaska Native
Population - Females (%) - Multirace
Population - Females (%) - Other Race
Coronavirus confirmed cases (Jun 07, 2024)
Deaths caused by coronavirus (Jun 07, 2024)
Coronavirus confirmed cases (per 100k population) (Jun 07, 2024)
Deaths caused by coronavirus (per 100k population) (Jun 07, 2024)
Daily increase in number of cases (Jun 07, 2024)
Weekly increase in number of cases (Jun 07, 2024)
Cases doubled (in days) (Jun 07, 2024)
Hospitalized patients (Apr 18, 2022)
Negative test results (Apr 18, 2022)
Total test results (Apr 18, 2022)
COVID Vaccine doses distributed (per 100k population) (Sep 19, 2023)
COVID Vaccine doses administered (per 100k population) (Sep 19, 2023)
COVID Vaccine doses distributed (Sep 19, 2023)
COVID Vaccine doses administered (Sep 19, 2023)
Likely homosexual households (%)
Likely homosexual households (% change since 2000)
Likely homosexual households - Lesbian couples (%)
Likely homosexual households - Lesbian couples (% change since 2000)
Likely homosexual households - Gay men (%)
Likely homosexual households - Gay men (% change since 2000)
Cost of living index
Median gross rent ($)
Median contract rent ($)
Median monthly housing costs ($)
Median house or condo value ($)
Median house or condo value ($ change since 2000)
Mean house or condo value by units in structure - 1, detached ($)
Mean house or condo value by units in structure - 1, attached ($)
Mean house or condo value by units in structure - 2 ($)
Mean house or condo value by units in structure by units in structure - 3 or 4 ($)
Mean house or condo value by units in structure - 5 or more ($)
Mean house or condo value by units in structure - Boat, RV, van, etc. ($)
Mean house or condo value by units in structure - Mobile home ($)
Median house or condo value ($) - White
Median house or condo value ($) - Black or African American
Median house or condo value ($) - Asian
Median house or condo value ($) - Hispanic or Latino
Median house or condo value ($) - American Indian and Alaska Native
Median house or condo value ($) - Multirace
Median house or condo value ($) - Other Race
Median resident age
Resident age diversity
Median resident age - Males
Median resident age - Females
Median resident age - White
Median resident age - Black or African American
Median resident age - Asian
Median resident age - Hispanic or Latino
Median resident age - American Indian and Alaska Native
Median resident age - Multirace
Median resident age - Other Race
Median resident age - Males - White
Median resident age - Males - Black or African American
Median resident age - Males - Asian
Median resident age - Males - Hispanic or Latino
Median resident age - Males - American Indian and Alaska Native
Median resident age - Males - Multirace
Median resident age - Males - Other Race
Median resident age - Females - White
Median resident age - Females - Black or African American
Median resident age - Females - Asian
Median resident age - Females - Hispanic or Latino
Median resident age - Females - American Indian and Alaska Native
Median resident age - Females - Multirace
Median resident age - Females - Other Race
Commute - mean travel time to work (minutes)
Travel time to work - Less than 5 minutes (%)
Travel time to work - Less than 5 minutes (% change since 2000)
Travel time to work - 5 to 9 minutes (%)
Travel time to work - 5 to 9 minutes (% change since 2000)
Travel time to work - 10 to 19 minutes (%)
Travel time to work - 10 to 19 minutes (% change since 2000)
Travel time to work - 20 to 29 minutes (%)
Travel time to work - 20 to 29 minutes (% change since 2000)
Travel time to work - 30 to 39 minutes (%)
Travel time to work - 30 to 39 minutes (% change since 2000)
Travel time to work - 40 to 59 minutes (%)
Travel time to work - 40 to 59 minutes (% change since 2000)
Travel time to work - 60 to 89 minutes (%)
Travel time to work - 60 to 89 minutes (% change since 2000)
Travel time to work - 90 or more minutes (%)
Travel time to work - 90 or more minutes (% change since 2000)
Marital status - Never married (%)
Marital status - Now married (%)
Marital status - Separated (%)
Marital status - Widowed (%)
Marital status - Divorced (%)
Median family income ($)
Median family income (% change since 2000)
Median non-family income ($)
Median non-family income (% change since 2000)
Median per capita income ($)
Median per capita income (% change since 2000)
Median family income ($) - White
Median family income ($) - Black or African American
Median family income ($) - Asian
Median family income ($) - Hispanic or Latino
Median family income ($) - American Indian and Alaska Native
Median family income ($) - Multirace
Median family income ($) - Other Race
Median year house/condo built
Median year apartment built
Year house built - Built 2005 or later (%)
Year house built - Built 2000 to 2004 (%)
Year house built - Built 1990 to 1999 (%)
Year house built - Built 1980 to 1989 (%)
Year house built - Built 1970 to 1979 (%)
Year house built - Built 1960 to 1969 (%)
Year house built - Built 1950 to 1959 (%)
Year house built - Built 1940 to 1949 (%)
Year house built - Built 1939 or earlier (%)
Average household size
Household density (households per square mile)
Average household size - White
Average household size - Black or African American
Average household size - Asian
Average household size - Hispanic or Latino
Average household size - American Indian and Alaska Native
Average household size - Multirace
Average household size - Other Race
Occupied housing units (%)
Vacant housing units (%)
Owner occupied housing units (%)
Renter occupied housing units (%)
Vacancy status - For rent (%)
Vacancy status - For sale only (%)
Vacancy status - Rented or sold, not occupied (%)
Vacancy status - For seasonal, recreational, or occasional use (%)
Vacancy status - For migrant workers (%)
Vacancy status - Other vacant (%)
Residents with income below the poverty level (%)
Residents with income below 50% of the poverty level (%)
Children below poverty level (%)
Poor families by family type - Married-couple family (%)
Poor families by family type - Male, no wife present (%)
Poor families by family type - Female, no husband present (%)
Poverty status for native-born residents (%)
Poverty status for foreign-born residents (%)
Poverty among high school graduates not in families (%)
Poverty among people who did not graduate high school not in families (%)
Residents with income below the poverty level (%) - White
Residents with income below the poverty level (%) - Black or African American
Residents with income below the poverty level (%) - Asian
Residents with income below the poverty level (%) - Hispanic or Latino
Residents with income below the poverty level (%) - American Indian and Alaska Native
Residents with income below the poverty level (%) - Multirace
Residents with income below the poverty level (%) - Other Race
Air pollution - Air Quality Index (AQI)
Air pollution - CO
Air pollution - NO2
Air pollution - SO2
Air pollution - Ozone
Air pollution - PM10
Air pollution - PM25
Air pollution - Pb
Crime - Murders per 100,000 population
Crime - Rapes per 100,000 population
Crime - Robberies per 100,000 population
Crime - Assaults per 100,000 population
Crime - Burglaries per 100,000 population
Crime - Thefts per 100,000 population
Crime - Auto thefts per 100,000 population
Crime - Arson per 100,000 population
Crime - City-data.com crime index
Crime - Violent crime index
Crime - Property crime index
Crime - Murders per 100,000 population (5 year average)
Crime - Rapes per 100,000 population (5 year average)
Crime - Robberies per 100,000 population (5 year average)
Crime - Assaults per 100,000 population (5 year average)
Crime - Burglaries per 100,000 population (5 year average)
Crime - Thefts per 100,000 population (5 year average)
Crime - Auto thefts per 100,000 population (5 year average)
Crime - Arson per 100,000 population (5 year average)
Crime - City-data.com crime index (5 year average)
Crime - Violent crime index (5 year average)
Crime - Property crime index (5 year average)
1996 Presidential Elections Results (%) - Democratic Party (Clinton)
1996 Presidential Elections Results (%) - Republican Party (Dole)
1996 Presidential Elections Results (%) - Other
2000 Presidential Elections Results (%) - Democratic Party (Gore)
2000 Presidential Elections Results (%) - Republican Party (Bush)
2000 Presidential Elections Results (%) - Other
2004 Presidential Elections Results (%) - Democratic Party (Kerry)
2004 Presidential Elections Results (%) - Republican Party (Bush)
2004 Presidential Elections Results (%) - Other
2008 Presidential Elections Results (%) - Democratic Party (Obama)
2008 Presidential Elections Results (%) - Republican Party (McCain)
2008 Presidential Elections Results (%) - Other
2012 Presidential Elections Results (%) - Democratic Party (Obama)
2012 Presidential Elections Results (%) - Republican Party (Romney)
2012 Presidential Elections Results (%) - Other
2016 Presidential Elections Results (%) - Democratic Party (Clinton)
2016 Presidential Elections Results (%) - Republican Party (Trump)
2016 Presidential Elections Results (%) - Other
2020 Presidential Elections Results (%) - Democratic Party (Biden)
2020 Presidential Elections Results (%) - Republican Party (Trump)
2020 Presidential Elections Results (%) - Other
Ancestries Reported - Arab (%)
Ancestries Reported - Czech (%)
Ancestries Reported - Danish (%)
Ancestries Reported - Dutch (%)
Ancestries Reported - English (%)
Ancestries Reported - French (%)
Ancestries Reported - French Canadian (%)
Ancestries Reported - German (%)
Ancestries Reported - Greek (%)
Ancestries Reported - Hungarian (%)
Ancestries Reported - Irish (%)
Ancestries Reported - Italian (%)
Ancestries Reported - Lithuanian (%)
Ancestries Reported - Norwegian (%)
Ancestries Reported - Polish (%)
Ancestries Reported - Portuguese (%)
Ancestries Reported - Russian (%)
Ancestries Reported - Scotch-Irish (%)
Ancestries Reported - Scottish (%)
Ancestries Reported - Slovak (%)
Ancestries Reported - Subsaharan African (%)
Ancestries Reported - Swedish (%)
Ancestries Reported - Swiss (%)
Ancestries Reported - Ukrainian (%)
Ancestries Reported - United States (%)
Ancestries Reported - Welsh (%)
Ancestries Reported - West Indian (%)
Ancestries Reported - Other (%)
Educational Attainment - No schooling completed (%)
Educational Attainment - Less than high school (%)
Educational Attainment - High school or equivalent (%)
Educational Attainment - Less than 1 year of college (%)
Educational Attainment - 1 or more years of college (%)
Educational Attainment - Associate degree (%)
Educational Attainment - Bachelor's degree (%)
Educational Attainment - Master's degree (%)
Educational Attainment - Professional school degree (%)
Educational Attainment - Doctorate degree (%)
School Enrollment - Nursery, preschool (%)
School Enrollment - Kindergarten (%)
School Enrollment - Grade 1 to 4 (%)
School Enrollment - Grade 5 to 8 (%)
School Enrollment - Grade 9 to 12 (%)
School Enrollment - College undergrad (%)
School Enrollment - Graduate or professional (%)
School Enrollment - Not enrolled in school (%)
School enrollment - Public schools (%)
School enrollment - Private schools (%)
School enrollment - Not enrolled (%)
Median number of rooms in houses and condos
Median number of rooms in apartments
Housing units lacking complete plumbing facilities (%)
Housing units lacking complete kitchen facilities (%)
Density of houses
Urban houses (%)
Rural houses (%)
Households with people 60 years and over (%)
Households with people 65 years and over (%)
Households with people 75 years and over (%)
Households with one or more nonrelatives (%)
Households with no nonrelatives (%)
Population in households (%)
Family households (%)
Nonfamily households (%)
Population in families (%)
Family households with own children (%)
Median number of bedrooms in owner occupied houses
Mean number of bedrooms in owner occupied houses
Median number of bedrooms in renter occupied houses
Mean number of bedrooms in renter occupied houses
Median number of vehichles in owner occupied houses
Mean number of vehichles in owner occupied houses
Median number of vehichles in renter occupied houses
Mean number of vehichles in renter occupied houses
Mortgage status - with mortgage (%)
Mortgage status - with second mortgage (%)
Mortgage status - with home equity loan (%)
Mortgage status - with both second mortgage and home equity loan (%)
Mortgage status - without a mortgage (%)
Average family size
Average family size - White
Average family size - Black or African American
Average family size - Asian
Average family size - Hispanic or Latino
Average family size - American Indian and Alaska Native
Average family size - Multirace
Average family size - Other Race
Geographical mobility - Same house 1 year ago (%)
Geographical mobility - Moved within same county (%)
Geographical mobility - Moved from different county within same state (%)
Geographical mobility - Moved from different state (%)
Geographical mobility - Moved from abroad (%)
Place of birth - Born in state of residence (%)
Place of birth - Born in other state (%)
Place of birth - Native, outside of US (%)
Place of birth - Foreign born (%)
Housing units in structures - 1, detached (%)
Housing units in structures - 1, attached (%)
Housing units in structures - 2 (%)
Housing units in structures - 3 or 4 (%)
Housing units in structures - 5 to 9 (%)
Housing units in structures - 10 to 19 (%)
Housing units in structures - 20 to 49 (%)
Housing units in structures - 50 or more (%)
Housing units in structures - Mobile home (%)
Housing units in structures - Boat, RV, van, etc. (%)
House/condo owner moved in on average (years ago)
Renter moved in on average (years ago)
Year householder moved into unit - Moved in 1999 to March 2000 (%)
Year householder moved into unit - Moved in 1995 to 1998 (%)
Year householder moved into unit - Moved in 1990 to 1994 (%)
Year householder moved into unit - Moved in 1980 to 1989 (%)
Year householder moved into unit - Moved in 1970 to 1979 (%)
Year householder moved into unit - Moved in 1969 or earlier (%)
Means of transportation to work - Drove car alone (%)
Means of transportation to work - Carpooled (%)
Means of transportation to work - Public transportation (%)
Means of transportation to work - Bus or trolley bus (%)
Means of transportation to work - Streetcar or trolley car (%)
Means of transportation to work - Subway or elevated (%)
Means of transportation to work - Railroad (%)
Means of transportation to work - Ferryboat (%)
Means of transportation to work - Taxicab (%)
Means of transportation to work - Motorcycle (%)
Means of transportation to work - Bicycle (%)
Means of transportation to work - Walked (%)
Means of transportation to work - Other means (%)
Working at home (%)
Industry diversity
Most Common Industries - Agriculture, forestry, fishing and hunting, and mining (%)
Most Common Industries - Agriculture, forestry, fishing and hunting (%)
Most Common Industries - Mining, quarrying, and oil and gas extraction (%)
Most Common Industries - Construction (%)
Most Common Industries - Manufacturing (%)
Most Common Industries - Wholesale trade (%)
Most Common Industries - Retail trade (%)
Most Common Industries - Transportation and warehousing, and utilities (%)
Most Common Industries - Transportation and warehousing (%)
Most Common Industries - Utilities (%)
Most Common Industries - Information (%)
Most Common Industries - Finance and insurance, and real estate and rental and leasing (%)
Most Common Industries - Finance and insurance (%)
Most Common Industries - Real estate and rental and leasing (%)
Most Common Industries - Professional, scientific, and management, and administrative and waste management services (%)
Most Common Industries - Professional, scientific, and technical services (%)
Most Common Industries - Management of companies and enterprises (%)
Most Common Industries - Administrative and support and waste management services (%)
Most Common Industries - Educational services, and health care and social assistance (%)
Most Common Industries - Educational services (%)
Most Common Industries - Health care and social assistance (%)
Most Common Industries - Arts, entertainment, and recreation, and accommodation and food services (%)
Most Common Industries - Arts, entertainment, and recreation (%)
Most Common Industries - Accommodation and food services (%)
Most Common Industries - Other services, except public administration (%)
Most Common Industries - Public administration (%)
Occupation diversity
Most Common Occupations - Management, business, science, and arts occupations (%)
Most Common Occupations - Management, business, and financial occupations (%)
Most Common Occupations - Management occupations (%)
Most Common Occupations - Business and financial operations occupations (%)
Most Common Occupations - Computer, engineering, and science occupations (%)
Most Common Occupations - Computer and mathematical occupations (%)
Most Common Occupations - Architecture and engineering occupations (%)
Most Common Occupations - Life, physical, and social science occupations (%)
Most Common Occupations - Education, legal, community service, arts, and media occupations (%)
Most Common Occupations - Community and social service occupations (%)
Most Common Occupations - Legal occupations (%)
Most Common Occupations - Education, training, and library occupations (%)
Most Common Occupations - Arts, design, entertainment, sports, and media occupations (%)
Most Common Occupations - Healthcare practitioners and technical occupations (%)
Most Common Occupations - Health diagnosing and treating practitioners and other technical occupations (%)
Most Common Occupations - Health technologists and technicians (%)
Most Common Occupations - Service occupations (%)
Most Common Occupations - Healthcare support occupations (%)
Most Common Occupations - Protective service occupations (%)
Most Common Occupations - Fire fighting and prevention, and other protective service workers including supervisors (%)
Most Common Occupations - Law enforcement workers including supervisors (%)
Most Common Occupations - Food preparation and serving related occupations (%)
Most Common Occupations - Building and grounds cleaning and maintenance occupations (%)
Most Common Occupations - Personal care and service occupations (%)
Most Common Occupations - Sales and office occupations (%)
Most Common Occupations - Sales and related occupations (%)
Most Common Occupations - Office and administrative support occupations (%)
Most Common Occupations - Natural resources, construction, and maintenance occupations (%)
Most Common Occupations - Farming, fishing, and forestry occupations (%)
Most Common Occupations - Construction and extraction occupations (%)
Most Common Occupations - Installation, maintenance, and repair occupations (%)
Most Common Occupations - Production, transportation, and material moving occupations (%)
Most Common Occupations - Production occupations (%)
Most Common Occupations - Transportation occupations (%)
Most Common Occupations - Material moving occupations (%)
People in Group quarters - Institutionalized population (%)
People in Group quarters - Correctional institutions (%)
People in Group quarters - Federal prisons and detention centers (%)
People in Group quarters - Halfway houses (%)
People in Group quarters - Local jails and other confinement facilities (including police lockups) (%)
People in Group quarters - Military disciplinary barracks (%)
People in Group quarters - State prisons (%)
People in Group quarters - Other types of correctional institutions (%)
People in Group quarters - Nursing homes (%)
People in Group quarters - Hospitals/wards, hospices, and schools for the handicapped (%)
People in Group quarters - Hospitals/wards and hospices for chronically ill (%)
People in Group quarters - Hospices or homes for chronically ill (%)
People in Group quarters - Military hospitals or wards for chronically ill (%)
People in Group quarters - Other hospitals or wards for chronically ill (%)
People in Group quarters - Hospitals or wards for drug/alcohol abuse (%)
People in Group quarters - Mental (Psychiatric) hospitals or wards (%)
People in Group quarters - Schools, hospitals, or wards for the mentally retarded (%)
People in Group quarters - Schools, hospitals, or wards for the physically handicapped (%)
People in Group quarters - Institutions for the deaf (%)
People in Group quarters - Institutions for the blind (%)
People in Group quarters - Orthopedic wards and institutions for the physically handicapped (%)
People in Group quarters - Wards in general hospitals for patients who have no usual home elsewhere (%)
People in Group quarters - Wards in military hospitals for patients who have no usual home elsewhere (%)
People in Group quarters - Juvenile institutions (%)
People in Group quarters - Long-term care (%)
People in Group quarters - Homes for abused, dependent, and neglected children (%)
People in Group quarters - Residential treatment centers for emotionally disturbed children (%)
People in Group quarters - Training schools for juvenile delinquents (%)
People in Group quarters - Short-term care, detention or diagnostic centers for delinquent children (%)
People in Group quarters - Type of juvenile institution unknown (%)
People in Group quarters - Noninstitutionalized population (%)
People in Group quarters - College dormitories (includes college quarters off campus) (%)
People in Group quarters - Military quarters (%)
People in Group quarters - On base (%)
People in Group quarters - Barracks, unaccompanied personnel housing (UPH), (Enlisted/Officer), ;and similar group living quarters for military personnel (%)
People in Group quarters - Transient quarters for temporary residents (%)
People in Group quarters - Military ships (%)
People in Group quarters - Group homes (%)
People in Group quarters - Homes or halfway houses for drug/alcohol abuse (%)
People in Group quarters - Homes for the mentally ill (%)
People in Group quarters - Homes for the mentally retarded (%)
People in Group quarters - Homes for the physically handicapped (%)
People in Group quarters - Other group homes (%)
People in Group quarters - Religious group quarters (%)
People in Group quarters - Dormitories (%)
People in Group quarters - Agriculture workers' dormitories on farms (%)
People in Group quarters - Job Corps and vocational training facilities (%)
People in Group quarters - Other workers' dormitories (%)
People in Group quarters - Crews of maritime vessels (%)
People in Group quarters - Other nonhousehold living situations (%)
People in Group quarters - Other noninstitutional group quarters (%)
Residents speaking English at home (%)
Residents speaking English at home - Born in the United States (%)
Residents speaking English at home - Native, born elsewhere (%)
Residents speaking English at home - Foreign born (%)
Residents speaking Spanish at home (%)
Residents speaking Spanish at home - Born in the United States (%)
Residents speaking Spanish at home - Native, born elsewhere (%)
Residents speaking Spanish at home - Foreign born (%)
Residents speaking other language at home (%)
Residents speaking other language at home - Born in the United States (%)
Residents speaking other language at home - Native, born elsewhere (%)
Residents speaking other language at home - Foreign born (%)
Class of Workers - Employee of private company (%)
Class of Workers - Self-employed in own incorporated business (%)
Class of Workers - Private not-for-profit wage and salary workers (%)
Class of Workers - Local government workers (%)
Class of Workers - State government workers (%)
Class of Workers - Federal government workers (%)
Class of Workers - Self-employed workers in own not incorporated business and Unpaid family workers (%)
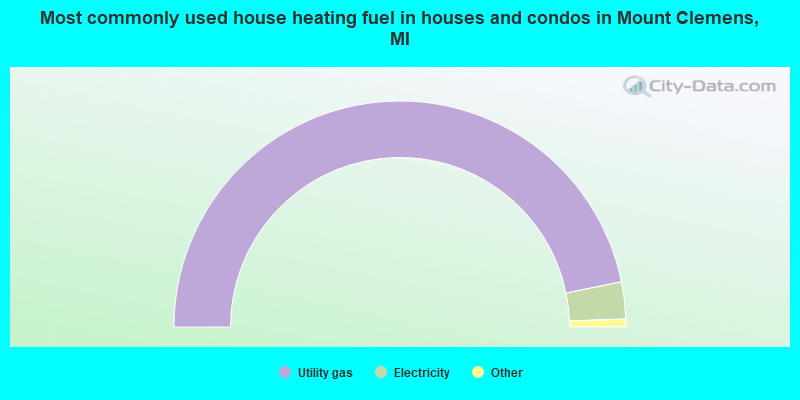
House heating fuel used in houses and condos - Utility gas (%)
House heating fuel used in houses and condos - Bottled, tank, or LP gas (%)
House heating fuel used in houses and condos - Electricity (%)
House heating fuel used in houses and condos - Fuel oil, kerosene, etc. (%)
House heating fuel used in houses and condos - Coal or coke (%)
House heating fuel used in houses and condos - Wood (%)
House heating fuel used in houses and condos - Solar energy (%)
House heating fuel used in houses and condos - Other fuel (%)
House heating fuel used in houses and condos - No fuel used (%)
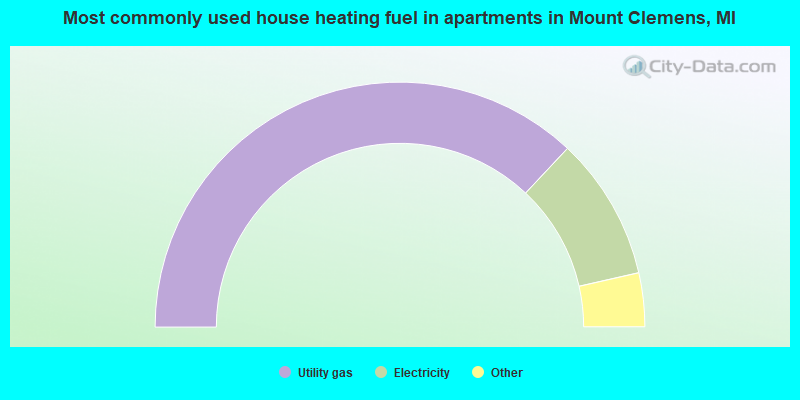
House heating fuel used in apartments - Utility gas (%)
House heating fuel used in apartments - Bottled, tank, or LP gas (%)
House heating fuel used in apartments - Electricity (%)
House heating fuel used in apartments - Fuel oil, kerosene, etc. (%)
House heating fuel used in apartments - Coal or coke (%)
House heating fuel used in apartments - Wood (%)
House heating fuel used in apartments - Solar energy (%)
House heating fuel used in apartments - Other fuel (%)
House heating fuel used in apartments - No fuel used (%)
Armed forces status - In Armed Forces (%)
Armed forces status - Civilian (%)
Armed forces status - Civilian - Veteran (%)
Armed forces status - Civilian - Nonveteran (%)
Fatal accidents locations in years 2005-2021
Fatal accidents locations in 2005
Fatal accidents locations in 2006
Fatal accidents locations in 2007
Fatal accidents locations in 2008
Fatal accidents locations in 2009
Fatal accidents locations in 2010
Fatal accidents locations in 2011
Fatal accidents locations in 2012
Fatal accidents locations in 2013
Fatal accidents locations in 2014
Fatal accidents locations in 2015
Fatal accidents locations in 2016
Fatal accidents locations in 2017
Fatal accidents locations in 2018
Fatal accidents locations in 2019
Fatal accidents locations in 2020
Fatal accidents locations in 2021
Alcohol use - People drinking some alcohol every month (%)
Alcohol use - People not drinking at all (%)
Alcohol use - Average days/month drinking alcohol
Alcohol use - Average drinks/week
Alcohol use - Average days/year people drink much
Audiometry - Average condition of hearing (%)
Audiometry - People that can hear a whisper from across a quiet room (%)
Audiometry - People that can hear normal voice from across a quiet room (%)
Audiometry - Ears ringing, roaring, buzzing (%)
Audiometry - Had a job exposure to loud noise (%)
Audiometry - Had off-work exposure to loud noise (%)
Blood Pressure & Cholesterol - Has high blood pressure (%)
Blood Pressure & Cholesterol - Checking blood pressure at home (%)
Blood Pressure & Cholesterol - Frequently checking blood cholesterol (%)
Blood Pressure & Cholesterol - Has high cholesterol level (%)
Consumer Behavior - Money monthly spent on food at supermarket/grocery store
Consumer Behavior - Money monthly spent on food at other stores
Consumer Behavior - Money monthly spent on eating out
Consumer Behavior - Money monthly spent on carryout/delivered foods
Consumer Behavior - Income spent on food at supermarket/grocery store (%)
Consumer Behavior - Income spent on food at other stores (%)
Consumer Behavior - Income spent on eating out (%)
Consumer Behavior - Income spent on carryout/delivered foods (%)
Current Health Status - General health condition (%)
Current Health Status - Blood donors (%)
Current Health Status - Has blood ever tested for HIV virus (%)
Current Health Status - Left-handed people (%)
Dermatology - People using sunscreen (%)
Diabetes - Diabetics (%)
Diabetes - Had a blood test for high blood sugar (%)
Diabetes - People taking insulin (%)
Diet Behavior & Nutrition - Diet health (%)
Diet Behavior & Nutrition - Milk product consumption (# of products/month)
Diet Behavior & Nutrition - Meals not home prepared (#/week)
Diet Behavior & Nutrition - Meals from fast food or pizza place (#/week)
Diet Behavior & Nutrition - Ready-to-eat foods (#/month)
Diet Behavior & Nutrition - Frozen meals/pizza (#/month)
Drug Use - People that ever used marijuana or hashish (%)
Drug Use - Ever used hard drugs (%)
Drug Use - Ever used any form of cocaine (%)
Drug Use - Ever used heroin (%)
Drug Use - Ever used methamphetamine (%)
Health Insurance - People covered by health insurance (%)
Kidney Conditions-Urology - Avg. # of times urinating at night
Medical Conditions - People with asthma (%)
Medical Conditions - People with anemia (%)
Medical Conditions - People with psoriasis (%)
Medical Conditions - People with overweight (%)
Medical Conditions - Elderly people having difficulties in thinking or remembering (%)
Medical Conditions - People who ever received blood transfusion (%)
Medical Conditions - People having trouble seeing even with glass/contacts (%)
Medical Conditions - People with arthritis (%)
Medical Conditions - People with gout (%)
Medical Conditions - People with congestive heart failure (%)
Medical Conditions - People with coronary heart disease (%)
Medical Conditions - People with angina pectoris (%)
Medical Conditions - People who ever had heart attack (%)
Medical Conditions - People who ever had stroke (%)
Medical Conditions - People with emphysema (%)
Medical Conditions - People with thyroid problem (%)
Medical Conditions - People with chronic bronchitis (%)
Medical Conditions - People with any liver condition (%)
Medical Conditions - People who ever had cancer or malignancy (%)
Mental Health - People who have little interest in doing things (%)
Mental Health - People feeling down, depressed, or hopeless (%)
Mental Health - People who have trouble sleeping or sleeping too much (%)
Mental Health - People feeling tired or having little energy (%)
Mental Health - People with poor appetite or overeating (%)
Mental Health - People feeling bad about themself (%)
Mental Health - People who have trouble concentrating on things (%)
Mental Health - People moving or speaking slowly or too fast (%)
Mental Health - People having thoughts they would be better off dead (%)
Oral Health - Average years since last visit a dentist
Oral Health - People embarrassed because of mouth (%)
Oral Health - People with gum disease (%)
Oral Health - General health of teeth and gums (%)
Oral Health - Average days a week using dental floss/device
Oral Health - Average days a week using mouthwash for dental problem
Oral Health - Average number of teeth
Pesticide Use - Households using pesticides to control insects (%)
Pesticide Use - Households using pesticides to kill weeds (%)
Physical Activity - People doing vigorous-intensity work activities (%)
Physical Activity - People doing moderate-intensity work activities (%)
Physical Activity - People walking or bicycling (%)
Physical Activity - People doing vigorous-intensity recreational activities (%)
Physical Activity - People doing moderate-intensity recreational activities (%)
Physical Activity - Average hours a day doing sedentary activities
Physical Activity - Average hours a day watching TV or videos
Physical Activity - Average hours a day using computer
Physical Functioning - People having limitations keeping them from working (%)
Physical Functioning - People limited in amount of work they can do (%)
Physical Functioning - People that need special equipment to walk (%)
Physical Functioning - People experiencing confusion/memory problems (%)
Physical Functioning - People requiring special healthcare equipment (%)
Prescription Medications - Average number of prescription medicines taking
Preventive Aspirin Use - Adults 40+ taking low-dose aspirin (%)
Reproductive Health - Vaginal deliveries (%)
Reproductive Health - Cesarean deliveries (%)
Reproductive Health - Deliveries resulted in a live birth (%)
Reproductive Health - Pregnancies resulted in a delivery (%)
Reproductive Health - Women breastfeeding newborns (%)
Reproductive Health - Women that had a hysterectomy (%)
Reproductive Health - Women that had both ovaries removed (%)
Reproductive Health - Women that have ever taken birth control pills (%)
Reproductive Health - Women taking birth control pills (%)
Reproductive Health - Women that have ever used Depo-Provera or injectables (%)
Reproductive Health - Women that have ever used female hormones (%)
Sexual Behavior - People 18+ that ever had sex (vaginal, anal, or oral) (%)
Sexual Behavior - Males 18+ that ever had vaginal sex with a woman (%)
Sexual Behavior - Males 18+ that ever performed oral sex on a woman (%)
Sexual Behavior - Males 18+ that ever had anal sex with a woman (%)
Sexual Behavior - Males 18+ that ever had any sex with a man (%)
Sexual Behavior - Females 18+ that ever had vaginal sex with a man (%)
Sexual Behavior - Females 18+ that ever performed oral sex on a man (%)
Sexual Behavior - Females 18+ that ever had anal sex with a man (%)
Sexual Behavior - Females 18+ that ever had any kind of sex with a woman (%)
Sexual Behavior - Average age people first had sex
Sexual Behavior - Average number of female sex partners in lifetime (males 18+)
Sexual Behavior - Average number of female vaginal sex partners in lifetime (males 18+)
Sexual Behavior - Average age people first performed oral sex on a woman (18+)
Sexual Behavior - Average number of woman performed oral sex on in lifetime (18+)
Sexual Behavior - Average number of male sex partners in lifetime (males 18+)
Sexual Behavior - Average number of male anal sex partners in lifetime (males 18+)
Sexual Behavior - Average age people first performed oral sex on a man (18+)
Sexual Behavior - Average number of male oral sex partners in lifetime (18+)
Sexual Behavior - People using protection when performing oral sex (%)
Sexual Behavior - Average number of times people have vaginal or anal sex a year
Sexual Behavior - People having sex without condom (%)
Sexual Behavior - Average number of male sex partners in lifetime (females 18+)
Sexual Behavior - Average number of male vaginal sex partners in lifetime (females 18+)
Sexual Behavior - Average number of female sex partners in lifetime (females 18+)
Sexual Behavior - Circumcised males 18+ (%)
Sleep Disorders - Average hours sleeping at night
Sleep Disorders - People that has trouble sleeping (%)
Smoking-Cigarette Use - People smoking cigarettes (%)
Taste & Smell - People 40+ having problems with smell (%)
Taste & Smell - People 40+ having problems with taste (%)
Taste & Smell - People 40+ that ever had wisdom teeth removed (%)
Taste & Smell - People 40+ that ever had tonsils teeth removed (%)
Taste & Smell - People 40+ that ever had a loss of consciousness because of a head injury (%)
Taste & Smell - People 40+ that ever had a broken nose or other serious injury to face or skull (%)
Taste & Smell - People 40+ that ever had two or more sinus infections (%)
Weight - Average height (inches)
Weight - Average weight (pounds)
Weight - Average BMI
Weight - People that are obese (%)
Weight - People that ever were obese (%)
Weight - People trying to lose weight (%)
Latest news from Mount Clemens, MI collected exclusively by city-data.com from local newspapers, TV, and radio stations
Ancestries: American (12.1%), German (10.0%), Irish (7.2%), Polish (6.6%), English (3.3%), Italian (2.9%).
Current Local Time:
Land area: 4.22 square miles.
Population density: 3,656 people per square mile (average).
282 residents are foreign born
This city:
1.8%Michigan:
6.9%
Median real estate property taxes paid for housing units with mortgages in 2022: $2,889 (1.8%)Median real estate property taxes paid for housing units with no mortgage in 2022: $2,654 (1.5%)
Nearest city with pop. 50,000+: St. Clair Shores, MI
Nearest city with pop. 200,000+: Detroit, MI
Nearest city with pop. 1,000,000+: Chicago, IL
Nearest cities:
Latitude: 42.60 N, Longitude: 82.88 W
Daytime population change due to commuting: +4,737 (+30.4%)Workers who live and work in this city: 1,637 (22.9%)
Single-family new house construction building permits:
2021: 1 building , cost: $30,0002018: 4 buildings , average cost: $160,0002017: 2 buildings , average cost: $329,4002009: 1 building , cost: $195,5002006: 3 buildings , average cost: $180,5002005: 3 buildings , average cost: $147,4002004: 16 buildings , average cost: $162,2002003: 7 buildings , average cost: $116,1002002: 10 buildings , average cost: $99,5002001: 14 buildings , average cost: $84,8002000: 20 buildings , average cost: $89,2001999: 25 buildings , average cost: $74,6001998: 2 buildings , average cost: $102,5001997: 5 buildings , average cost: $70,000Unemployment in December 2023:
Most common occupations in Mount Clemens, MI (%)
Both Males Females
Metal workers and plastic workers (5.9%)
Other production occupations, including supervisors (5.2%)
Other sales and related occupations, including supervisors (3.7%)
Building and grounds cleaning and maintenance occupations (3.6%)
Material recording, scheduling, dispatching, and distributing workers (3.6%)
Other office and administrative support workers, including supervisors (3.4%)
Electrical equipment mechanics and other installation, maintenance, and repair workers, including supervisors (3.1%)
Metal workers and plastic workers (9.0%)
Other production occupations, including supervisors (5.6%)
Electrical equipment mechanics and other installation, maintenance, and repair workers, including supervisors (5.4%)
Material recording, scheduling, dispatching, and distributing workers (4.0%)
Building and grounds cleaning and maintenance occupations (4.0%)
Other sales and related occupations, including supervisors (3.8%)
Engineers (3.5%)
Other office and administrative support workers, including supervisors (6.3%)
Secretaries and administrative assistants (6.1%)
Information and record clerks, except customer service representatives (4.8%)
Other production occupations, including supervisors (4.7%)
Waiters and waitresses (3.6%)
Other sales and related occupations, including supervisors (3.5%)
Cashiers (3.5%)
Tornado activity:
Mount Clemens-area historical tornado activity is near Michigan state average. It is 9% greater than the overall U.S. average.
On 5/8/1964, a category F4 (max. wind speeds 207-260 mph) tornado 5.7 miles away from the Mount Clemens city center killed 11 people and injured 224 people and caused between $500,000 and $5,000,000 in damages.
On 7/4/1957, a category F4 tornado 13.3 miles away from the city center injured 6 people and caused between $50,000 and $500,000 in damages.
Earthquake activity:
Mount Clemens-area historical earthquake activity is significantly above Michigan state average. It is 51% smaller than the overall U.S. average. On 9/25/1998 at 19:52:52, a magnitude 5.2 (4.8 MB, 4.3 MS, 5.2 LG, 4.5 MW, Depth: 3.1 mi, Class: Moderate, Intensity: VI - VII) earthquake occurred 148.8 miles away from Mount Clemens center On 1/31/1986 at 16:46:43, a magnitude 5.0 (5.0 MB) earthquake occurred 111.9 miles away from the city center On 7/12/1986 at 08:19:37, a magnitude 4.5 (4.5 MB, Class: Light, Intensity: IV - V) earthquake occurred 162.0 miles away from the city center On 7/27/1980 at 18:52:21, a magnitude 5.2 (5.1 MB, 4.7 MS, 5.0 UK, 5.2 UK) earthquake occurred 308.9 miles away from Mount Clemens center On 8/23/2011 at 17:51:04, a magnitude 5.8 (5.8 MW, Depth: 3.7 mi) earthquake occurred 416.0 miles away from Mount Clemens center On 5/2/2015 at 16:23:07, a magnitude 4.2 (4.2 MW, Depth: 2.8 mi) earthquake occurred 132.5 miles away from the city center Magnitude types: regional Lg-wave magnitude (LG), body-wave magnitude (MB), surface-wave magnitude (MS), moment magnitude (MW) Natural disasters: The number of natural disasters in Macomb County (15) is near the US average (15).Major Disasters (Presidential) Declared: 9Emergencies Declared: 5Storms: 9, Floods: 7, Tornadoes: 3, Winter Storms: 2, Blizzard: 1, Hurricane: 1, Power Outage: 1, Snowstorm: 1, Wind: 1, Other: 1 (Note: some incidents may be assigned to more than one category). Hospitals and medical centers in Mount Clemens: MCLAREN MACOMB (Proprietary, 1000 HARRINGTON BLVD) SELECT SPECIALTY HOSPITAL-MACOMB CTY INC ("215 NORTH AVE, SUITE 200") ABF HOME HEALTH SERVICES (198 SOUTH MAIN ST SUITE 1)
PREFERRED HOME CARE, INC (148 SOUTH MAIN STREET, SUITE 103C)
CLINTONVIEW CARE INC (37700 HARPER)
LAKEPOINTE VILLA (37700 HARPER AVE)
MARTHA T BERRY MEDICAL CARE FACILITY (43533 ELIZABETH RD)
Airports located in Mount Clemens: Amtrak stations near Mount Clemens: 16 miles: ROYAL OAK (201 S. SHERMAN DR.) Services: enclosed waiting area, public payphones, vending machines, paid short-term parking, taxi stand, intercity bus service, public transit connection.
17 miles: BIRMINGHAM (449 S. ETON ST.) Services: public payphones, free short-term parking, free long-term parking, call for taxi service, public transit connection.
19 miles: DETROIT (11 W. BALTIMORE AVE.) Services: ticket office, partially wheelchair accessible, enclosed waiting area, public restrooms, public payphones, free short-term parking, call for car rental service, taxi stand, public transit connection.
Colleges/universities with over 2000 students nearest to Mount Clemens:
Baker College of Clinton Township (about 4 miles; Clinton Township, MI ; Full-time enrollment: 3,413)
Macomb Community College (about 8 miles; Warren, MI ; FT enrollment: 15,669)
Oakland University (about 19 miles; Rochester Hills, MI ; FT enrollment: 16,449)
University of Detroit Mercy (about 19 miles; Detroit, MI ; FT enrollment: 3,406)
Wayne State University (about 20 miles; Detroit, MI ; FT enrollment: 20,204)
Baker College of Auburn Hills (about 20 miles; Auburn Hills, MI ; FT enrollment: 2,284)
Lawrence Technological University (about 21 miles; Southfield, MI ; FT enrollment: 2,430)
Public high schools in Mount Clemens:
Public elementary/middle schools in Mount Clemens: PREVAIL ACADEMY Students: 598, Location: 353 CASS AVE, Grades: KG-8, Charter school )MOUNT CLEMENS MIDDLE SCHOOL Students: 474, Location: 161 CASS AVENUE, Grades: 4-8)SEMINOLE ACADEMY Students: 452, Location: 1500 MULBERRY ST, Grades: PK-3)CLINTON VALLEY ELEMENTARY SCHOOL Students: 348, Location: 1260 MULBERRY ST, Grades: PK-5)MT. CLEMENS MONTESSORI ACADEMY Students: 275, Location: 1070 HAMPTON RD, Grades: KG-5, Charter school )Private elementary/middle schools in Mount Clemens: ST MARY CATHOLIC SCHOOL Students: 463, Location: 105 MARKET ST, Grades: PK-8)
MONTESSORI STEPPING STONES Students: 79, Location: 174 CASS AVE, Grades: PK-5)
See full list of schools located in Mount Clemens Library in Mount Clemens: MOUNT CLEMENS PUBLIC LIBRARY Operating income: $1,599,842; Location: 150 CASS AVENUE; 110,000 books ; 5,500 audio materials ; 4,500 video materials ; 160 print serial subscriptions )
User-submitted facts and corrections:
Young and the Restless actress Adrienne Frantz was born in Mount Clemens Mi
Notable locations in Mount Clemens: (A) , Macomb County Courthouse (B) , Crocker House Museum (C) , Macomb County Administration Building (D) , Macomb County Sheriff Department (E) , Mount Clemens Police Department (F) , Mount Clemens Public Library (G) , Michigan Transit Museum (H) , Byron Stuck Medical Library (I) , Clemens Medical Center (J) , Mount Clemens Fire Department (K) . Display/hide their locations on the map
Shopping Centers: (1) , Gibraltar Trade Center North Shopping Center (2) , Farmer Jack Shopping Center (3) . Display/hide their locations on the map
Churches in Mount Clemens include: (A) , Mount Clemens Apostolic Church (B) , Christian Lighthouse Church (C) , Cornelius First Seventh-Day Adventist Church (D) , Zion United Church of Christ (E) , Saint Peter's Catholic Church (F) , First United Methodist Church (G) , Calvary Missionary Baptist Church (H) , First Presbyterian Church (I) . Display/hide their locations on the map
Cemetery: (1) . Display/hide its location on the map
Parks in Mount Clemens include: (1) , Alexander Macomb Historical Marker (2) , Carnegie Library Historical Marker (3) , Crocker House Historical Marker (4) , Grace Episcopal Church Historical Marker (5) , Methodist Episcopal Church Historical Marker (6) , Mount Clemens Mineral Bath Industry Historical Marker (7) , Saint Joseph Sanitarium and Bath House Historical Marker (8) , Saint Mary's School Historical Marker (9) . Display/hide their locations on the map
Tourist attractions:
Hotel:
Birthplace of: Stuart A. Aaronson - Author and cancer biologist, Wally Weber - Football player, Allen Henry Vigneron - Catholic bishop, David Kircus - 2005 NFL player (Detroit Lions, born : Feb 19, 1980), Dean Cain - (born 1966), actor, Hal Elliott - Baseball player, Steven P. Schook - General, Adrienne Frantz - Soap opera actor, Tracy Leslie - Racecar driver, Dan Keczmer - Ice hockey player.
Macomb County has a predicted average indoor radon screening level less than 2 pCi/L (pico curies per liter) - Low Potential Average household size: This city:
2.2 peopleMichigan:
2.5 people
Percentage of family households: This city:
52.8%Whole state:
66.0%
Percentage of households with unmarried partners: This city:
8.3%Whole state:
6.4%
Likely homosexual households (counted as self-reported same-sex unmarried-partner households)
Lesbian couples: 0.4% of all households Gay men: 0.4% of all households
People in group quarters in Mount Clemens in 2010:
1,140 people in local jails and other municipal confinement facilities
214 people in nursing facilities/skilled-nursing facilities
94 people in correctional facilities intended for juveniles
36 people in other noninstitutional facilities
35 people in emergency and transitional shelters (with sleeping facilities) for people experiencing homelessness
30 people in mental (psychiatric) hospitals and psychiatric units in other hospitals
23 people in residential treatment centers for adults
7 people in group homes intended for adults
5 people in residential treatment centers for juveniles (non-correctional)
People in group quarters in Mount Clemens in 2000:
1,253 people in local jails and other confinement facilities (including police lockups)
190 people in nursing homes
94 people in other noninstitutional group quarters
92 people in short-term care, detention or diagnostic centers for delinquent children
26 people in wards in general hospitals for patients who have no usual home elsewhere
10 people in mental (psychiatric) hospitals or wards
6 people in homes for the mentally ill
3 people in hospitals/wards and hospices for chronically ill
3 people in other hospitals or wards for chronically ill
3 people in homes for the mentally retarded
3 people in other group homes
Banks with branches in Mount Clemens (2011 data):
The Huntington National Bank: South Branch, Hall Road Branch, Canal-Garfield Branch, Mount Clemens Branch. Info updated 2012/04/02: Bank assets: $54,183.4 mil, Deposits: $44,300.3 mil, headquarters in Columbus, OH, positive income , Commercial Lending Specialization, 878 total offices , Holding Company: Huntington Bancshares Incorporated
Fifth Third Bank: North Avenue Branch at 100 Cass Avenue, branch established on 1981/05/11; Groesbeck Branch at 100 North Groesbeck Highway, branch established on 1967/06/26. Info updated 2009/10/05: Bank assets: $114,540.4 mil, Deposits: $89,689.1 mil, headquarters in Cincinnati, OH, positive income , Commercial Lending Specialization, 1378 total offices , Holding Company: Fifth Third Bancorp
Talmer Bank and Trust: Mount Clemens Branch at 100 North Main Street, branch established on 1996/10/28. Info updated 2011/05/03: Bank assets: $2,126.7 mil, Deposits: $1,722.6 mil, headquarters in Troy, MI, positive income , Commercial Lending Specialization, 56 total offices , Holding Company: Talmer Bancorp Inc.
For population 15 years and over in Mount Clemens:
Never married: 38.8%Now married: 34.9%Separated: 1.8%Widowed: 7.6%Divorced: 16.9% For population 25 years and over in Mount Clemens:
High school or higher: 87.0%Bachelor's degree or higher: 16.2%Graduate or professional degree: 4.6%Unemployed: 7.2%Mean travel time to work (commute): 22.7 minutes
Education Gini index (Inequality in education) Here:
10.0Michigan average:
11.0
Religion statistics for Mount Clemens, MI (based on Macomb County data)
Religion Adherents Congregations Catholic 249,439 57 Evangelical Protestant 72,383 188 Mainline Protestant 21,221 65 Orthodox 8,925 6 Other 7,482 28 Black Protestant 2,670 12 None 478,858 -
Source: Clifford Grammich, Kirk Hadaway, Richard Houseal, Dale E.Jones, Alexei Krindatch, Richie Stanley and Richard H.Taylor. 2012. 2010 U.S.Religion Census: Religious Congregations & Membership Study. Association of Statisticians of American Religious Bodies. Jones, Dale E., et al. 2002. Congregations and Membership in the United States 2000. Nashville, TN: Glenmary Research Center. Graphs represent county-level data
Food Environment Statistics: Number of grocery stores : 174Macomb County :
2.10 / 10,000 pop.Michigan :
2.34 / 10,000 pop.
Number of supercenters and club stores : 13Here :
0.16 / 10,000 pop.Michigan :
0.18 / 10,000 pop.
Number of convenience stores (no gas) : 134Macomb County :
1.62 / 10,000 pop.Michigan :
1.52 / 10,000 pop.
Number of convenience stores (with gas) : 189Macomb County :
2.28 / 10,000 pop.State :
2.99 / 10,000 pop.
Number of full-service restaurants : 593This county :
7.15 / 10,000 pop.Michigan :
6.80 / 10,000 pop.
Adult obesity rate : This county :
29.4%Michigan :
29.7%
Low-income preschool obesity rate : This county :
13.1%State :
13.4%
Health and Nutrition: Healthy diet rate : Mount Clemens:
46.9%Michigan:
50.3%
Average overall health of teeth and gums : Mount Clemens:
43.2%Michigan:
47.9%
Average BMI : Mount Clemens:
29.1Michigan:
28.7
People feeling badly about themselves : Mount Clemens:
22.9%State:
20.6%
People not drinking alcohol at all : Average hours sleeping at night : Overweight people : This city:
33.6%State:
34.1%
General health condition : Average condition of hearing : Mount Clemens:
79.0%State:
79.6%
More about Health and Nutrition of Mount Clemens, MI Residents
Local government employment and payroll (March 2007)
Function
Full-time employees
Monthly full-time payroll
Average yearly full-time wage
Part-time employees
Monthly part-time payroll
Firefighters
13 $72,967 $67,354 21 $7,758 Other and Unallocable
12 $42,719 $42,719 0 $0 Water Supply
12 $53,309 $53,309 0 $0 Streets and Highways
11 $46,946 $51,214 1 $3,077 Financial Administration
9 $36,172 $48,229 0 $0 Welfare
8 $31,716 $47,574 0 $0 Other Government Administration
6 $28,857 $57,714 7 $204 Sewerage
6 $21,591 $43,182 0 $0 Housing and Community Development (Local)
4 $16,001 $48,003 0 $0 Parks and Recreation
2 $7,525 $45,150 0 $0 Transit
1 $3,405 $40,860 11 $17,847 Solid Waste Management
1 $4,466 $53,592 0 $0 Fire - Other
1 $3,122 $37,464 0 $0 Judicial and Legal
0 $0 0 $0 Police - Other
0 $0 0 $0 Police Protection - Officers
0 $0 0 $0
Totals for Government
86 $368,796 $51,460 40 $28,886
Mount Clemens government finances - Expenditure in 2021 (per resident):
Current Operations - General - Other: $5,338,000 ($346.42)
Police Protection: $2,750,000 ($178.47)Sewerage: $2,558,000 ($166.01)Housing and Community Development: $1,942,000 ($126.03)Local Fire Protection: $1,935,000 ($125.58)Parks and Recreation: $1,389,000 ($90.14)Central Staff Services: $1,073,000 ($69.63)Regular Highways: $759,000 ($49.26)Financial Administration: $521,000 ($33.81)General Public Buildings: $244,000 ($15.83)Judicial and Legal Services: $162,000 ($10.51)General - Interest on Debt: $97,000 ($6.30)
Intergovernmental to Local - Other - Police Protection: $3,254,000 ($211.18)
Other - Housing and Community Development: $52,000 ($3.37)Other Capital Outlay - Regular Highways: $1,578,000 ($102.41)
Sewerage: $985,000 ($63.92)General - Other: $873,000 ($56.66)Parks and Recreation: $738,000 ($47.89)Water Utilities: $309,000 ($20.05)Local Fire Protection: $85,000 ($5.52)Housing and Community Development: $34,000 ($2.21)Total Salaries and Wages: $4,339,000 ($281.59)
Water Utilities - Interest on Debt: $43,000 ($2.79)
Mount Clemens government finances - Revenue in 2021 (per resident):
Charges - Other: $11,763,000 ($763.39)
Housing and Community Development: $1,008,000 ($65.42)Parking Facilities: $230,000 ($14.93)Federal Intergovernmental - Housing and Community Development: $1,006,000 ($65.29)
Other: $597,000 ($38.74)Miscellaneous - General Revenue - Other: $474,000 ($30.76)
Special Assessments: $58,000 ($3.76)Interest Earnings: $46,000 ($2.99)State Intergovernmental - General Local Government Support: $2,122,000 ($137.71)
Highways: $1,689,000 ($109.61)Other: $1,069,000 ($69.38)Tax - Property: $7,324,000 ($475.31)
Occupation and Business License - Other: $33,000 ($2.14)Other License: $19,000 ($1.23)
Mount Clemens government finances - Debt in 2021 (per resident):
Long Term Debt - Outstanding Unspecified Public Purpose: $7,270,000 ($471.80)
Beginning Outstanding - Unspecified Public Purpose: $5,336,000 ($346.29)Issue, Unspecified Public Purpose: $2,985,000 ($193.72)Retired Unspecified Public Purpose: $1,051,000 ($68.21)
Mount Clemens government finances - Cash and Securities in 2021 (per resident):
Other Funds - Cash and Securities: $27,672,000 ($1795.83)
Sinking Funds - Cash and Securities: $749,000 ($48.61)
4.68% of this county's 2021 resident taxpayers lived in other counties in 2020 ($51,473 average adjusted gross income )
Here:
4.68%Michigan average:
5.83%
0.01% of residents moved from foreign countries ($94 average AGI )Macomb County:
0.01%Michigan average:
0.00%
Top counties from which taxpayers relocated into this county between 2020 and 2021:
5.03% of this county's 2020 resident taxpayers moved to other counties in 2021 ($66,583 average adjusted gross income )
Here:
5.03%Michigan average:
5.95%
0.01% of residents moved to foreign countries ($76 average AGI )Macomb County:
0.01%Michigan average:
0.00%
Top counties to which taxpayers relocated from this county between 2020 and 2021:
Businesses in Mount Clemens, MI
Name Count Name Count
Advance Auto Parts 1 Subway 2 Arby's 2 Taco Bell 1 Burger King 2 U-Haul 5 Dairy Queen 1 UPS 5 FedEx 6 YMCA 1 MasterBrand Cabinets 2
Strongest AM radio stations in Mount Clemens:
WUFL (1030 AM; daytime; 5 kW; STERLING HEIGHTS, MI; Owner: FAMILY LIFE BROADCASTING SYSTEM)
WWJ (950 AM; 50 kW; DETROIT, MI; Owner: INFINITY BROADCASTING OPERATIONS, INC.)
WXYT (1270 AM; 50 kW; DETROIT, MI; Owner: INFINITY BROADCASTING CORP. OF DETROIT)
WJR (760 AM; 50 kW; DETROIT, MI; Owner: ABC, INC.)
WDFN (1130 AM; 50 kW; DETROIT, MI; Owner: AMFM RADIO LICENSES, L.L.C.)
WCHB (1200 AM; 50 kW; TAYLOR, MI; Owner: RADIO ONE OF DETROIT, LLC)
WFDF (910 AM; 50 kW; FLINT, MI; Owner: ABC, INC.)
WOAP (1080 AM; 50 kW; OWOSSO, MI)
WPHM (1380 AM; 5 kW; PORT HURON, MI; Owner: LIGGETT COMMUNICATIONS, L.L.C.)
WKNR (850 AM; 50 kW; CLEVELAND, OH; Owner: CARON BROADCASTING, INC.)
WDEO (990 AM; 9 kW; YPSILANTI, MI; Owner: WORD BROADCASTERS, INC.)
WXDX (1310 AM; 5 kW; DEARBORN, MI; Owner: AMFM RADIO LICENSES, L.L.C.)
WTKA (1050 AM; 10 kW; ANN ARBOR, MI; Owner: CAPSTAR TX LIMITED PARTNERSHIP)
Strongest FM radio stations in Mount Clemens:
WDMK (102.7 FM; MOUNT CLEMENS, MI; Owner: RADIO ONE OF DETROIT, LLC)
WMGC-FM (105.1 FM; DETROIT, MI; Owner: GREATER BOSTON RADIO, INC.)
WCSX (94.7 FM; BIRMINGHAM, MI; Owner: GREATER BOSTON RADIO, INC.)
WKRK-FM (97.1 FM; DETROIT, MI; Owner: INFINITY BROADCASTING OPERATIONS, INC.)
WDVD (96.3 FM; DETROIT, MI; Owner: ABC, INC.)
WRIF (101.1 FM; DETROIT, MI; Owner: GREATER BOSTON RADIO, INC.)
WYCD (99.5 FM; DETROIT, MI; Owner: INFINITY BROADCASTING CORPORATION OF MICHIGAN)
WDTJ (105.9 FM; DETROIT, MI; Owner: RADIO ONE OF DETROIT, LLC)
WMXD (92.3 FM; DETROIT, MI; Owner: AMFM RADIO LICENSES, L.L.C.)
WDRQ (93.1 FM; DETROIT, MI; Owner: ABC, INC.)
WDTW (106.7 FM; DETROIT, MI; Owner: AMFM RADIO LICENSES, L.L.C.)
WNIC (100.3 FM; DEARBORN, MI; Owner: AMFM RADIO LICENSES, L.L.C.)
WDET-FM (101.9 FM; DETROIT, MI; Owner: WAYNE STATE UNIVERSITY)
WJLB (97.9 FM; DETROIT, MI; Owner: AMFM RADIO LICENSES, L.L.C.)
WDTR-FM (90.9 FM; DETROIT, MI; Owner: BOARD OF EDUCATION, CITY OF DETROIT)
WOMC (104.3 FM; DETROIT, MI; Owner: INFINITY BROADCASTING CORPORATION OF MICHIGAN)
WKQI (95.5 FM; DETROIT, MI; Owner: AMFM RADIO LICENSES, L.L.C.)
WVMV (98.7 FM; DETROIT, MI; Owner: INFINITY BROADCASTING OPERATIONS, INC.)
WGPR (107.5 FM; DETROIT, MI; Owner: WGPR, INC.)
WMUZ (103.5 FM; DETROIT, MI; Owner: WMUZ RADIO, INC.)
TV broadcast stations around Mount Clemens:
WADL (Channel 38; MOUNT CLEMENS, MI; Owner: ADELL BROADCASTING CORPORATION)
WJBK (Channel 2; DETROIT, MI; Owner: FOX TELEVISION STATIONS, INC.)
WXYZ-TV (Channel 7; DETROIT, MI; Owner: CHANNEL 7 OF DETROIT, INC.)
WWJ-TV (Channel 62; DETROIT, MI; Owner: CBS BROADCASTING INC.)
WDWB (Channel 20; DETROIT, MI; Owner: WXON LICENSE, INC.)
WTVS (Channel 56; DETROIT, MI; Owner: DETROIT EDUC. TV FOUNDATION)
WDIV-TV (Channel 4; DETROIT, MI; Owner: POST-NEWSWEEK STATIONS, MICHIGAN, INC.)
WBXD-CA (Channel 5; DETROIT, MI; Owner: THE BOX WORLDWIDE LLC)
W48AV (Channel 48; DETROIT, MI; Owner: PAXSON COMMUNICATIONS LICENSE COMPANY, LLC)
WKBD (Channel 50; DETROIT, MI; Owner: VIACOM STATIONS GROUP OF DETROIT INC.)
WLPC-LP (Channel 26; DETROIT, MI; Owner: GLENN R. AND KARIN A. PLUMMER)
WFUM (Channel 28; FLINT, MI; Owner: UNIVERSITY OF MICHIGAN)
WDWO-CA (Channel 18; DETROIT, MI; Owner: TCT OF MICHIGAN, INC.)
W33BY (Channel 68; DETROIT, MI; Owner: HIGHLAND PARK BROADCASTING, L.P.)
National Bridge Inventory (NBI) Statistics 17 Number of bridges233ft / 70.6m Total length $5,583,000 Total costs320,904 Total average daily traffic16,866 Total average daily truck traffic
New bridges - historical statistics
2 1950-1959 4 1960-1969 1 1970-1979 1 1980-1989 4 1990-1999 5 2010-2019
See full National Bridge Inventory statistics for Mount Clemens, MI
FCC Registered Antenna Towers: 86 (
See the full list of FCC Registered Antenna Towers in Mount Clemens )
FCC Registered Private Land Mobile Towers: 4 (
See the full list of FCC Registered Private Land Mobile Towers in Mount Clemens, MI )
FCC Registered Broadcast Land Mobile Towers: 35 (
See the full list of FCC Registered Broadcast Land Mobile Towers )
FCC Registered Microwave Towers: 20 (
See the full list of FCC Registered Microwave Towers in this town )
FCC Registered Paging Towers: 1 (
See the full list of FCC Registered Paging Towers )
FCC Registered Maritime Coast & Aviation Ground Towers: 7 (
See the full list of FCC Registered Maritime Coast & Aviation Ground Towers )
FCC Registered Amateur Radio Licenses: 68 (
See the full list of FCC Registered Amateur Radio Licenses in Mount Clemens )
FAA Registered Aircraft: 4
Aircraft: CESSNA 172N (Category: Land, Seats: 4, Weight: Up to 12,499 Pounds, Speed: 105 mph), Engine: LYCOMING 0-320 SERIES (180 HP) (Reciprocating)N-Number: 5314E, N5314E, N-5314E, Serial Number: 17271835, Year manufactured: 1978, Airworthiness Date: 11/16/1978, Certificate Issue Date: 07/01/2014Registrant (LLC): 57d Flyers LLC, 314 Huntington St, Mount Clemens, MI 48043Aircraft: CESSNA 172M (Category: Land, Seats: 4, Weight: Up to 12,499 Pounds, Speed: 108 mph), Engine: LYCOMING 0-320 SERIES (180 HP) (4 Cycle)N-Number: 64119, N64119, N-64119, Serial Number: 17265034, Year manufactured: 1975, Airworthiness Date: 03/31/1975, Certificate Issue Date: 12/18/2018Registrant (Individual): Strother E Jr Wood, 11 May St, Mount Clemens, MI 48043Aircraft: PIPER PA-34-220T (Category: Land, Engines: 2, Seats: 7, Weight: Up to 12,499 Pounds), Engine: CONT MOTOR TSIO-360 SER (225 HP) (Reciprocating)N-Number: 758AS, N758AS, N-758AS, Serial Number: 3449187, Year manufactured: 2000, Airworthiness Date: 10/17/2000, Certificate Issue Date: 07/11/2013Registrant (LLC): Rff Aviation LLC, 301 Church St, Mount Clemens, MI 48043Aircraft: CRAIG STEPHEN JONES RV-7A (Category: Land, Seats: 2, Weight: Up to 12,499 Pounds), Engine: LYCOMING IO-360-A1B (200 HP) (4 Cycle)N-Number: 779GJ, N779GJ, N-779GJ, Serial Number: 70081, Year manufactured: 2012, Airworthiness Date: 06/20/2012, Certificate Issue Date: 03/30/2012Registrant (Individual): Craig S Jones, 169 N Gratiot Ave, Mount Clemens, MI 48043
Home Mortgage Disclosure Act Aggregated Statistics For Year 2009(Based on 5 full tracts) A) FHA, FSA/RHS & VA B) Conventional C) Refinancings D) Home Improvement Loans E) Loans on Dwellings For 5+ Families F) Non-occupant Loans on G) Loans On Manufactured Number Average Value Number Average Value Number Average Value Number Average Value Number Average Value Number Average Value Number Average Value
LOANS ORIGINATED 54 $67,241 15 $73,400 69 $106,377 5 $14,600 1 $110,000 7 $50,143 1 $21,000 APPLICATIONS APPROVED, NOT ACCEPTED 3 $63,000 1 $26,000 10 $98,700 3 $4,667 0 $0 2 $77,000 0 $0 APPLICATIONS DENIED 11 $90,818 17 $32,941 80 $104,400 17 $32,118 0 $0 17 $63,529 9 $18,000 APPLICATIONS WITHDRAWN 6 $81,500 2 $36,000 36 $112,472 1 $53,000 0 $0 5 $42,600 0 $0 FILES CLOSED FOR INCOMPLETENESS 1 $41,000 0 $0 12 $116,750 0 $0 0 $0 0 $0 0 $0
Aggregated Statistics For Year 2008(Based on 5 full tracts) A) FHA, FSA/RHS & VA B) Conventional C) Refinancings D) Home Improvement Loans E) Loans on Dwellings For 5+ Families F) Non-occupant Loans on G) Loans On Manufactured Number Average Value Number Average Value Number Average Value Number Average Value Number Average Value Number Average Value Number Average Value
LOANS ORIGINATED 61 $84,803 54 $75,315 83 $106,663 22 $15,455 1 $289,000 26 $62,615 4 $12,500 APPLICATIONS APPROVED, NOT ACCEPTED 7 $69,714 15 $51,867 26 $107,462 11 $34,182 0 $0 5 $34,800 7 $32,714 APPLICATIONS DENIED 14 $72,071 26 $69,962 143 $116,308 30 $33,267 0 $0 14 $75,214 13 $35,846 APPLICATIONS WITHDRAWN 5 $68,400 2 $64,000 29 $119,793 2 $14,000 1 $3,075,000 4 $68,500 0 $0 FILES CLOSED FOR INCOMPLETENESS 3 $147,667 2 $108,000 7 $81,714 0 $0 0 $0 3 $49,000 0 $0
Aggregated Statistics For Year 2007(Based on 5 full tracts) A) FHA, FSA/RHS & VA B) Conventional C) Refinancings D) Home Improvement Loans E) Loans on Dwellings For 5+ Families F) Non-occupant Loans on G) Loans On Manufactured Number Average Value Number Average Value Number Average Value Number Average Value Number Average Value Number Average Value Number Average Value
LOANS ORIGINATED 13 $92,538 121 $99,314 233 $100,695 34 $45,735 5 $306,600 60 $82,917 2 $80,000 APPLICATIONS APPROVED, NOT ACCEPTED 0 $0 27 $92,185 53 $99,792 9 $44,556 0 $0 14 $90,143 2 $37,500 APPLICATIONS DENIED 5 $87,600 64 $79,844 259 $106,305 50 $42,240 0 $0 38 $95,868 20 $43,700 APPLICATIONS WITHDRAWN 1 $58,000 10 $69,400 75 $110,627 9 $52,000 1 $3,015,000 8 $65,375 0 $0 FILES CLOSED FOR INCOMPLETENESS 1 $79,000 4 $103,500 24 $102,042 0 $0 0 $0 5 $95,400 0 $0
Aggregated Statistics For Year 2006(Based on 5 full tracts) A) FHA, FSA/RHS & VA B) Conventional C) Refinancings D) Home Improvement Loans E) Loans on Dwellings For 5+ Families F) Non-occupant Loans on G) Loans On Manufactured Number Average Value Number Average Value Number Average Value Number Average Value Number Average Value Number Average Value Number Average Value
LOANS ORIGINATED 26 $115,308 251 $92,112 414 $94,099 40 $52,025 4 $466,250 81 $86,877 2 $42,500 APPLICATIONS APPROVED, NOT ACCEPTED 0 $0 40 $103,175 107 $101,495 12 $41,500 0 $0 13 $113,692 2 $26,000 APPLICATIONS DENIED 5 $122,200 102 $100,480 372 $106,231 50 $63,600 1 $558,000 55 $89,400 14 $39,714 APPLICATIONS WITHDRAWN 0 $0 24 $105,667 127 $105,992 11 $54,636 0 $0 8 $76,125 2 $100,500 FILES CLOSED FOR INCOMPLETENESS 0 $0 16 $74,125 76 $124,145 5 $56,400 0 $0 1 $148,000 1 $115,000
Aggregated Statistics For Year 2005(Based on 5 full tracts) A) FHA, FSA/RHS & VA B) Conventional C) Refinancings D) Home Improvement Loans E) Loans on Dwellings For 5+ Families F) Non-occupant Loans on G) Loans On Manufactured Number Average Value Number Average Value Number Average Value Number Average Value Number Average Value Number Average Value Number Average Value
LOANS ORIGINATED 38 $127,921 316 $96,968 548 $105,442 56 $70,268 4 $992,250 115 $107,522 1 $75,000 APPLICATIONS APPROVED, NOT ACCEPTED 1 $87,000 56 $113,571 124 $106,315 9 $35,333 2 $800,500 19 $90,053 2 $70,500 APPLICATIONS DENIED 6 $113,167 127 $84,307 429 $114,816 70 $42,471 0 $0 58 $90,483 14 $38,286 APPLICATIONS WITHDRAWN 6 $141,167 36 $105,861 236 $119,653 18 $110,167 0 $0 28 $111,500 0 $0 FILES CLOSED FOR INCOMPLETENESS 0 $0 24 $76,167 112 $116,920 0 $0 0 $0 6 $83,333 0 $0
Aggregated Statistics For Year 2004(Based on 5 full tracts) A) FHA, FSA/RHS & VA B) Conventional C) Refinancings D) Home Improvement Loans E) Loans on Dwellings For 5+ Families F) Non-occupant Loans on G) Loans On Manufactured Number Average Value Number Average Value Number Average Value Number Average Value Number Average Value Number Average Value Number Average Value
LOANS ORIGINATED 42 $118,548 270 $113,567 593 $102,853 56 $57,036 5 $521,400 114 $108,596 1 $85,000 APPLICATIONS APPROVED, NOT ACCEPTED 6 $105,500 49 $94,837 132 $103,379 9 $25,444 0 $0 25 $81,040 3 $49,000 APPLICATIONS DENIED 11 $130,818 72 $104,153 342 $102,518 40 $44,700 0 $0 36 $81,889 6 $34,167 APPLICATIONS WITHDRAWN 2 $125,500 43 $97,140 163 $100,196 10 $75,100 0 $0 17 $75,941 0 $0 FILES CLOSED FOR INCOMPLETENESS 3 $152,000 9 $107,000 129 $114,124 5 $77,400 1 $960,000 4 $84,250 0 $0
Aggregated Statistics For Year 2003(Based on 5 full tracts) A) FHA, FSA/RHS & VA B) Conventional C) Refinancings D) Home Improvement Loans E) Loans on Dwellings For 5+ Families F) Non-occupant Loans on Number Average Value Number Average Value Number Average Value Number Average Value Number Average Value Number Average Value
LOANS ORIGINATED 72 $119,319 249 $105,257 1,095 $98,752 43 $32,163 4 $623,000 118 $83,364 APPLICATIONS APPROVED, NOT ACCEPTED 0 $0 28 $99,250 159 $90,346 8 $43,250 1 $300,000 20 $83,300 APPLICATIONS DENIED 10 $123,000 62 $91,065 429 $100,352 41 $12,024 0 $0 37 $97,865 APPLICATIONS WITHDRAWN 7 $103,714 29 $105,655 200 $107,545 7 $29,143 0 $0 19 $93,526 FILES CLOSED FOR INCOMPLETENESS 4 $136,750 10 $100,800 64 $98,891 1 $50,000 0 $0 3 $114,667
Aggregated Statistics For Year 2002(Based on 5 full tracts) A) FHA, FSA/RHS & VA B) Conventional C) Refinancings D) Home Improvement Loans E) Loans on Dwellings For 5+ Families F) Non-occupant Loans on Number Average Value Number Average Value Number Average Value Number Average Value Number Average Value Number Average Value
LOANS ORIGINATED 84 $113,881 199 $93,673 769 $97,495 45 $19,156 7 $241,143 78 $86,962 APPLICATIONS APPROVED, NOT ACCEPTED 5 $109,600 22 $108,455 106 $101,311 18 $13,167 1 $728,000 13 $79,615 APPLICATIONS DENIED 12 $97,250 39 $87,744 242 $92,521 50 $10,900 0 $0 17 $76,353 APPLICATIONS WITHDRAWN 10 $112,300 15 $119,800 169 $101,692 7 $44,429 0 $0 6 $91,000 FILES CLOSED FOR INCOMPLETENESS 4 $106,000 5 $125,200 92 $103,272 1 $15,000 0 $0 3 $89,333
Aggregated Statistics For Year 2001(Based on 5 full tracts) A) FHA, FSA/RHS & VA B) Conventional C) Refinancings D) Home Improvement Loans E) Loans on Dwellings For 5+ Families F) Non-occupant Loans on Number Average Value Number Average Value Number Average Value Number Average Value Number Average Value Number Average Value
LOANS ORIGINATED 86 $107,198 201 $101,905 760 $94,329 85 $11,659 3 $1,071,667 67 $71,642 APPLICATIONS APPROVED, NOT ACCEPTED 3 $112,333 31 $72,742 99 $95,859 30 $16,833 0 $0 10 $70,300 APPLICATIONS DENIED 1 $67,000 79 $46,671 258 $83,446 86 $16,012 2 $625,000 22 $89,000 APPLICATIONS WITHDRAWN 7 $88,143 15 $99,933 182 $92,291 4 $23,000 0 $0 6 $63,333 FILES CLOSED FOR INCOMPLETENESS 3 $95,000 2 $49,000 58 $90,845 0 $0 0 $0 4 $91,750
Aggregated Statistics For Year 2000(Based on 5 full tracts) A) FHA, FSA/RHS & VA B) Conventional C) Refinancings D) Home Improvement Loans E) Loans on Dwellings For 5+ Families F) Non-occupant Loans on Number Average Value Number Average Value Number Average Value Number Average Value Number Average Value Number Average Value
LOANS ORIGINATED 91 $94,791 196 $90,015 281 $76,427 106 $12,792 2 $472,500 52 $62,365 APPLICATIONS APPROVED, NOT ACCEPTED 4 $90,750 37 $66,189 65 $77,400 36 $15,056 0 $0 11 $72,909 APPLICATIONS DENIED 7 $89,286 162 $48,562 181 $65,149 103 $19,650 1 $800,000 14 $55,643 APPLICATIONS WITHDRAWN 6 $74,667 26 $84,654 94 $76,170 7 $30,857 0 $0 10 $76,200 FILES CLOSED FOR INCOMPLETENESS 3 $79,333 5 $85,000 55 $89,127 0 $0 0 $0 3 $113,667
Aggregated Statistics For Year 1999(Based on 4 full and 2 partial tracts) A) FHA, FSA/RHS & VA B) Conventional C) Refinancings D) Home Improvement Loans E) Loans on Dwellings For 5+ Families F) Non-occupant Loans on Number Average Value Number Average Value Number Average Value Number Average Value Number Average Value Number Average Value
LOANS ORIGINATED 110 $92,308 224 $92,103 463 $79,820 103 $15,381 2 $355,375 51 $62,856 APPLICATIONS APPROVED, NOT ACCEPTED 7 $74,006 42 $56,360 93 $76,149 43 $15,682 0 $0 14 $60,923 APPLICATIONS DENIED 12 $80,869 139 $45,178 162 $68,191 91 $11,853 0 $0 11 $76,274 APPLICATIONS WITHDRAWN 7 $101,787 26 $80,981 100 $74,224 15 $19,637 0 $0 15 $60,050 FILES CLOSED FOR INCOMPLETENESS 2 $67,175 5 $135,450 61 $71,997 1 $17,680 0 $0 5 $75,866
Detailed HMDA statistics for the following Tracts:
2450.00
, 2451.00 , 2452.00 , 2453.00 , 2454.00
Private Mortgage Insurance Companies Aggregated Statistics For Year 2009(Based on 3 full tracts) A) Conventional B) Refinancings Number Average Value Number Average Value
LOANS ORIGINATED 5 $70,800 2 $120,500 APPLICATIONS APPROVED, NOT ACCEPTED 1 $63,000 1 $130,000 APPLICATIONS DENIED 0 $0 0 $0 APPLICATIONS WITHDRAWN 1 $63,000 0 $0 FILES CLOSED FOR INCOMPLETENESS 0 $0 1 $154,000
Aggregated Statistics For Year 2008(Based on 5 full tracts) A) Conventional B) Refinancings C) Non-occupant Loans on Number Average Value Number Average Value Number Average Value
LOANS ORIGINATED 16 $69,500 9 $155,000 4 $59,750 APPLICATIONS APPROVED, NOT ACCEPTED 11 $68,364 8 $130,875 4 $72,250 APPLICATIONS DENIED 0 $0 0 $0 0 $0 APPLICATIONS WITHDRAWN 0 $0 0 $0 0 $0 FILES CLOSED FOR INCOMPLETENESS 1 $60,000 0 $0 1 $60,000
Aggregated Statistics For Year 2007(Based on 5 full tracts) A) Conventional B) Refinancings C) Non-occupant Loans on Number Average Value Number Average Value Number Average Value
LOANS ORIGINATED 61 $109,361 23 $137,609 10 $115,900 APPLICATIONS APPROVED, NOT ACCEPTED 9 $105,556 10 $133,100 2 $143,500 APPLICATIONS DENIED 1 $64,000 1 $138,000 0 $0 APPLICATIONS WITHDRAWN 3 $99,333 2 $138,500 0 $0 FILES CLOSED FOR INCOMPLETENESS 1 $104,000 2 $149,500 0 $0
Aggregated Statistics For Year 2006(Based on 5 full tracts) A) Conventional B) Refinancings C) Non-occupant Loans on Number Average Value Number Average Value Number Average Value
LOANS ORIGINATED 45 $115,778 18 $126,611 3 $94,667 APPLICATIONS APPROVED, NOT ACCEPTED 6 $111,500 5 $113,400 1 $115,000 APPLICATIONS DENIED 1 $171,000 1 $164,000 2 $167,500 APPLICATIONS WITHDRAWN 1 $167,000 0 $0 1 $167,000 FILES CLOSED FOR INCOMPLETENESS 0 $0 0 $0 0 $0
Aggregated Statistics For Year 2005(Based on 5 full tracts) A) Conventional B) Refinancings C) Non-occupant Loans on Number Average Value Number Average Value Number Average Value
LOANS ORIGINATED 58 $125,017 31 $129,710 8 $114,250 APPLICATIONS APPROVED, NOT ACCEPTED 11 $125,818 15 $128,067 3 $124,667 APPLICATIONS DENIED 1 $60,000 0 $0 0 $0 APPLICATIONS WITHDRAWN 3 $139,333 1 $148,000 0 $0 FILES CLOSED FOR INCOMPLETENESS 0 $0 0 $0 0 $0
Aggregated Statistics For Year 2004(Based on 5 full tracts) A) Conventional B) Refinancings C) Non-occupant Loans on Number Average Value Number Average Value Number Average Value
LOANS ORIGINATED 61 $127,410 39 $124,949 10 $100,900 APPLICATIONS APPROVED, NOT ACCEPTED 12 $140,833 21 $122,619 4 $123,750 APPLICATIONS DENIED 1 $114,000 1 $72,000 1 $72,000 APPLICATIONS WITHDRAWN 1 $74,000 3 $127,667 1 $74,000 FILES CLOSED FOR INCOMPLETENESS 0 $0 0 $0 0 $0
Aggregated Statistics For Year 2003(Based on 5 full tracts) A) Conventional B) Refinancings C) Non-occupant Loans on Number Average Value Number Average Value Number Average Value
LOANS ORIGINATED 70 $109,071 93 $119,925 15 $82,933 APPLICATIONS APPROVED, NOT ACCEPTED 18 $126,056 26 $124,038 7 $100,143 APPLICATIONS DENIED 1 $119,000 1 $168,000 1 $119,000 APPLICATIONS WITHDRAWN 2 $169,000 6 $97,167 1 $117,000 FILES CLOSED FOR INCOMPLETENESS 0 $0 0 $0 0 $0
Aggregated Statistics For Year 2002(Based on 5 full tracts) A) Conventional B) Refinancings C) Non-occupant Loans on Number Average Value Number Average Value Number Average Value
LOANS ORIGINATED 91 $109,352 85 $124,306 18 $90,111 APPLICATIONS APPROVED, NOT ACCEPTED 24 $132,500 17 $114,529 3 $117,333 APPLICATIONS DENIED 4 $102,000 2 $126,500 1 $140,000 APPLICATIONS WITHDRAWN 5 $104,800 10 $119,700 1 $87,000 FILES CLOSED FOR INCOMPLETENESS 1 $73,000 0 $0 1 $73,000
Aggregated Statistics For Year 2001(Based on 5 full tracts) A) Conventional B) Refinancings C) Non-occupant Loans on Number Average Value Number Average Value Number Average Value
LOANS ORIGINATED 92 $113,087 97 $114,155 17 $103,000 APPLICATIONS APPROVED, NOT ACCEPTED 11 $95,727 22 $112,273 2 $107,000 APPLICATIONS DENIED 5 $145,800 7 $103,714 3 $78,667 APPLICATIONS WITHDRAWN 3 $83,000 6 $105,833 1 $23,000 FILES CLOSED FOR INCOMPLETENESS 0 $0 1 $117,000 0 $0
Aggregated Statistics For Year 2000(Based on 5 full tracts) A) Conventional B) Refinancings C) Non-occupant Loans on Number Average Value Number Average Value Number Average Value
LOANS ORIGINATED 80 $100,100 28 $105,643 10 $80,300 APPLICATIONS APPROVED, NOT ACCEPTED 14 $84,000 4 $82,250 3 $73,000 APPLICATIONS DENIED 3 $96,333 4 $97,250 1 $124,000 APPLICATIONS WITHDRAWN 1 $105,000 0 $0 0 $0 FILES CLOSED FOR INCOMPLETENESS 0 $0 0 $0 0 $0
Aggregated Statistics For Year 1999(Based on 4 full and 1 partial tracts) A) Conventional B) Refinancings C) Non-occupant Loans on Number Average Value Number Average Value Number Average Value
LOANS ORIGINATED 79 $101,210 38 $89,905 17 $79,726 APPLICATIONS APPROVED, NOT ACCEPTED 4 $67,715 11 $89,052 2 $69,335 APPLICATIONS DENIED 1 $47,160 0 $0 0 $0 APPLICATIONS WITHDRAWN 0 $0 1 $87,110 0 $0 FILES CLOSED FOR INCOMPLETENESS 1 $62,000 0 $0 0 $0
Detailed PMIC statistics for the following Tracts:
2450.00
, 2451.00 , 2452.00 , 2453.00 , 2454.00
Most common first names in Mount Clemens, MI among deceased individuals Name Count Lived (average)
John 363 71.7 years Mary 333 77.2 years William 309 71.7 years James 223 67.1 years Robert 222 65.5 years Joseph 217 72.6 years George 202 74.3 years Edward 165 73.3 years Helen 157 77.4 years Margaret 157 75.7 years
Most common last names in Mount Clemens, MI among deceased individuals Last name Count Lived (average)
Smith 111 71.0 years Miller 89 75.2 years Johnson 65 72.1 years Brown 58 70.5 years Williams 56 72.4 years Jones 54 71.2 years Moore 49 75.6 years Peltier 48 76.4 years Davis 48 74.3 years Martin 44 68.8 years
Mount Clemens compared to Michigan state average:
Unemployed percentage below state average. Hispanic race population percentage below state average. Foreign-born population percentage significantly below state average. Renting percentage above state average. Length of stay since moving in significantly above state average. House age above state average. Institutionalized population percentage significantly above state average. Mount Clemens on our top lists :
#51 on the list of "Top 101 cities with the largest percentage of people in short-term care, detention or diagnostic centers for delinquent children (population 1,000+)"
#62 on the list of "Top 101 cities with the largest percentage of people in local jails and other confinement facilities (including police lockups) (population 1,000+)"
#100 on the list of "Top 101 cities with the most local government spending on current operations of parks and recreation per resident (population 10,000+)"
#2 (48043) on the list of "Top 101 zip codes with the lowest 2012 average net capital gain/loss (pop 1,000+)"
#8 on the list of "Top 101 counties with the largest increase in the number of infant deaths per 1000 residents 2000-2006 to 2007-2013 (pop. 50,000+)"
#23 on the list of "Top 101 counties with the highest percentage of residents that visited a dentist within the past year"
#28 on the list of "Top 101 counties with the most Orthodox adherents"
#46 on the list of "Top 101 counties with the most Catholic congregations"
#50 on the list of "Top 101 counties with the highest percentage of residents that smoked 100+ cigarettes in their lives"
Top Patent Applicants
Steven J. Weber (6)
Marleen F. Thompson (3)
Douglas Scott Simpson (3)
William D. Champ (3)
Ray Host (2)
Steven G. Smarsh (1)
Richard Rumer (1)
Jeffrey N. Hopper (1)
Alex M. Langreet (1)
Personal Estate Manager, Inc. (1)
Total of 25 patent applications in 2008-2024.
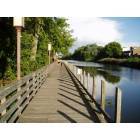

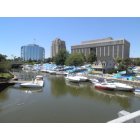
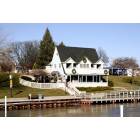

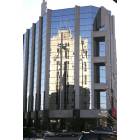
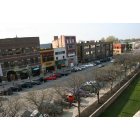
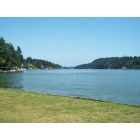
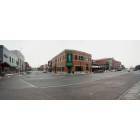
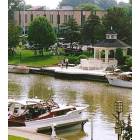
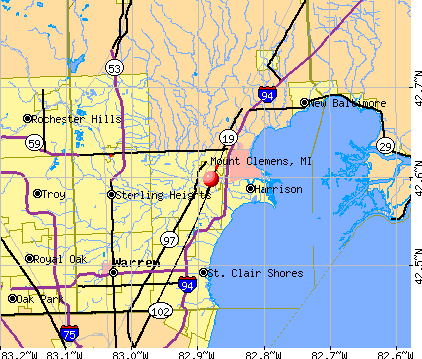


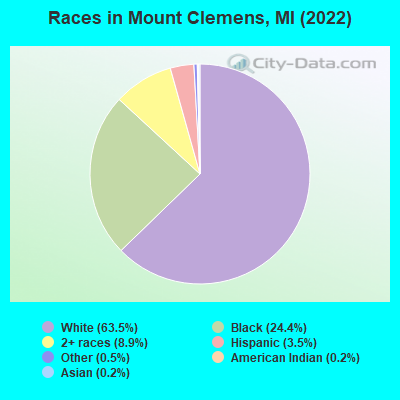
 Recent articles from our blog. Our writers, many of them Ph.D. graduates or candidates, create easy-to-read articles on a wide variety of topics.

 (7.6 miles
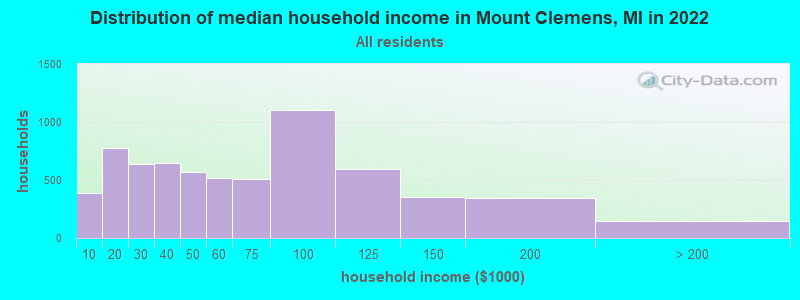
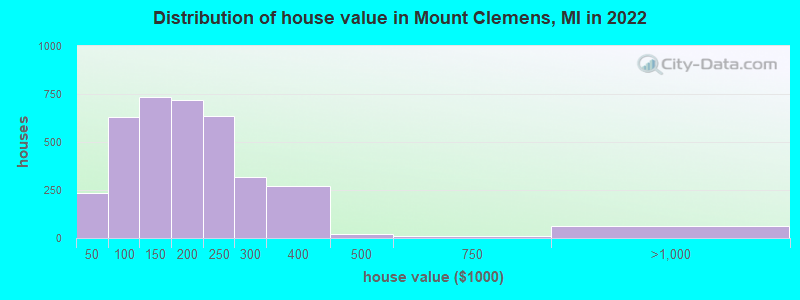

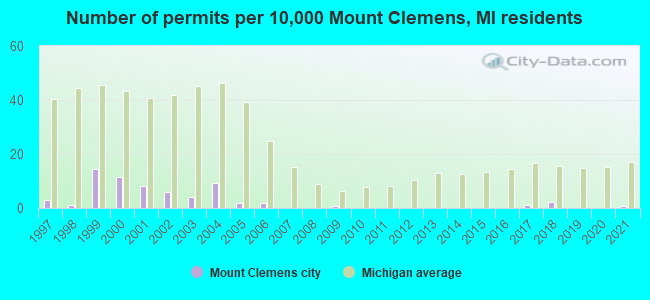
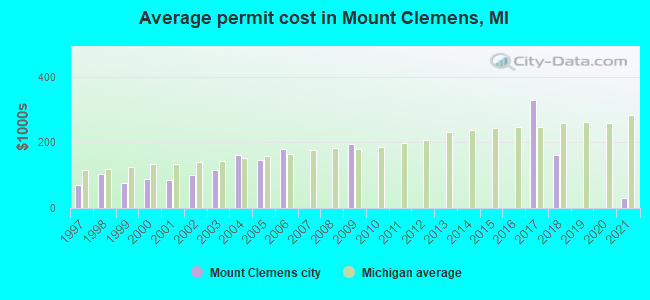
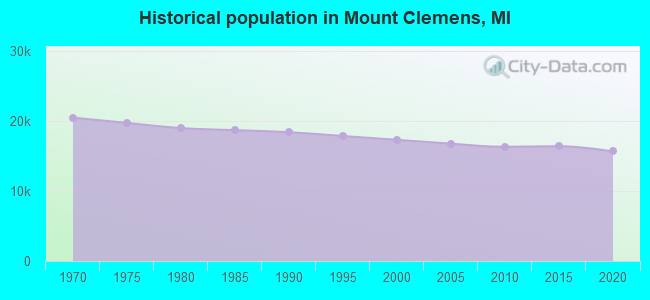
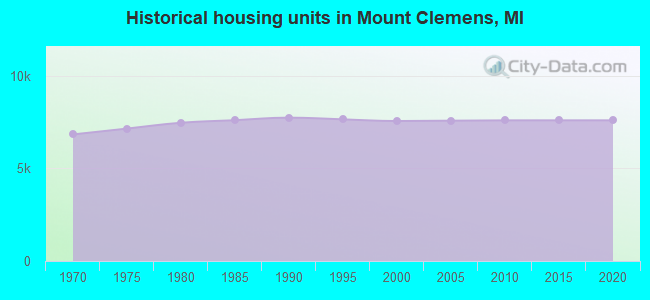
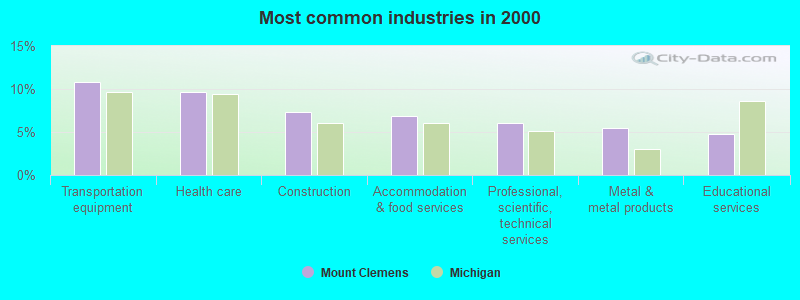
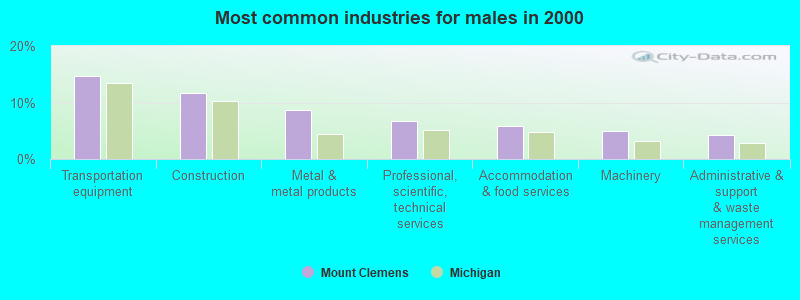
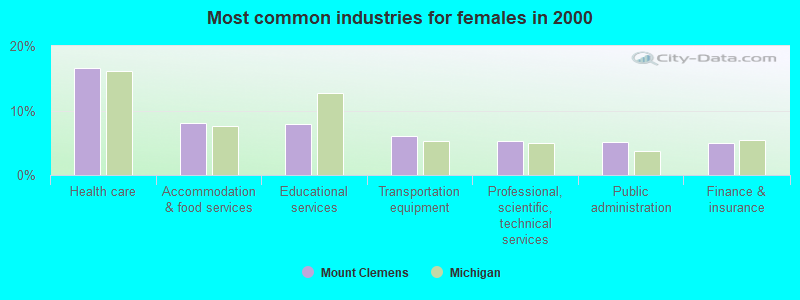
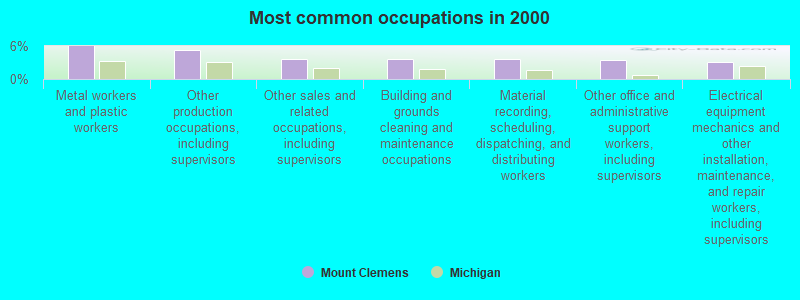
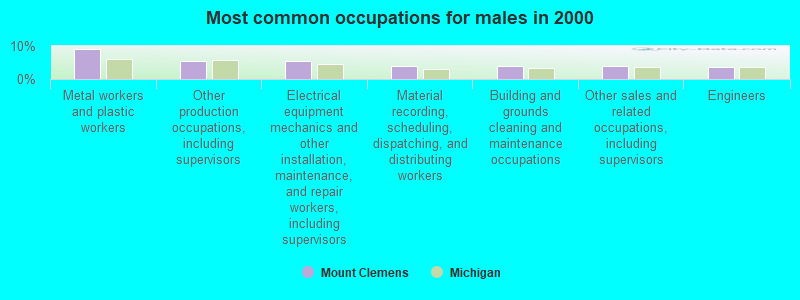
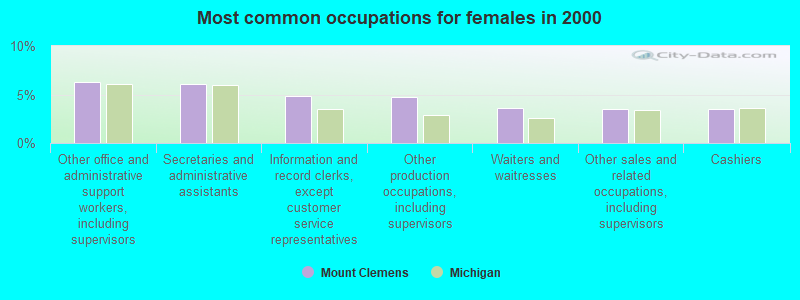


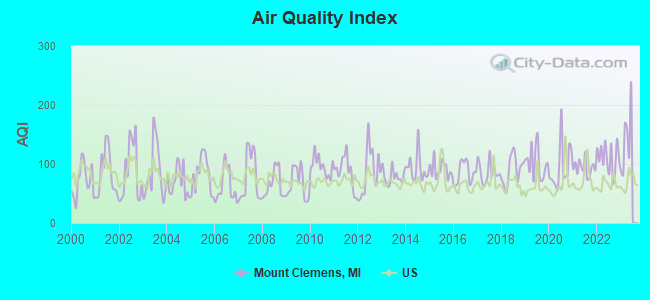
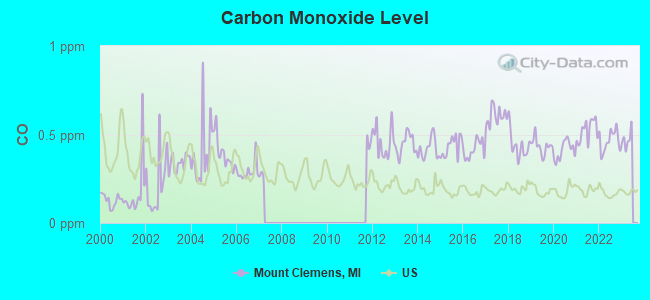
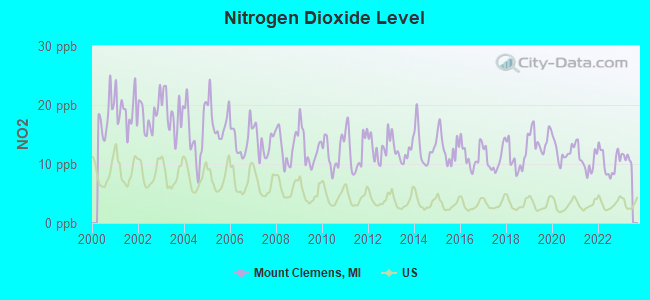
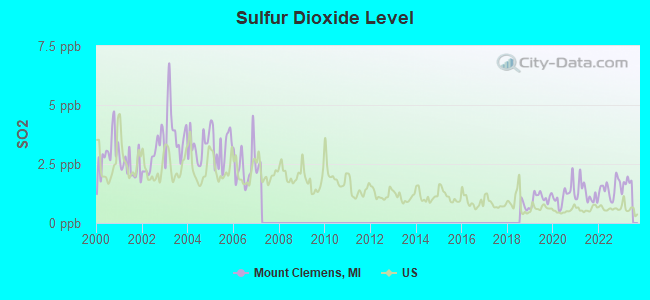
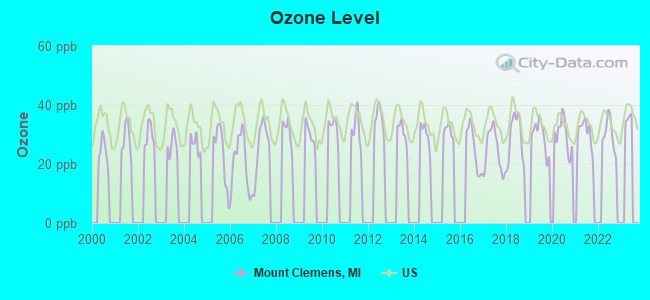
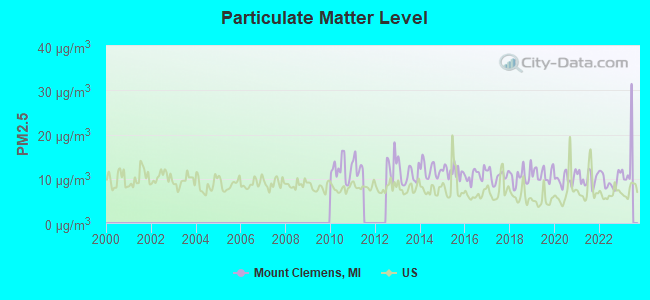
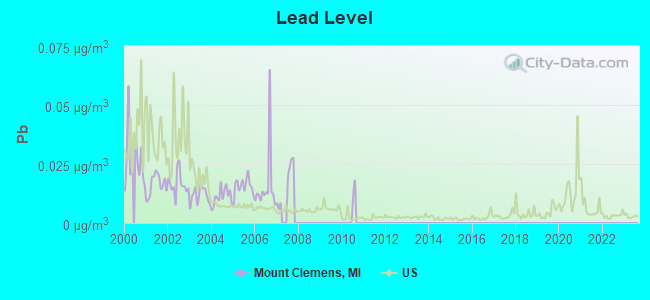
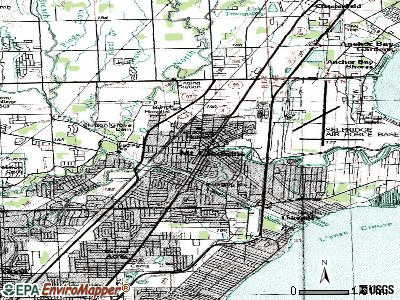
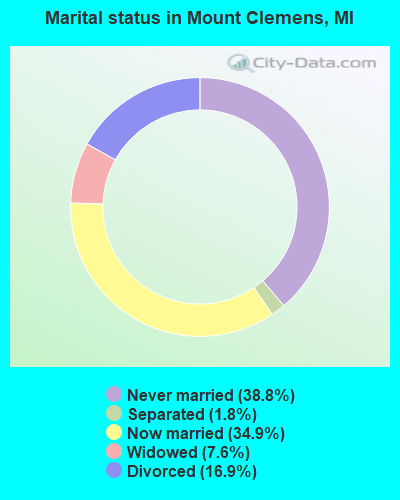
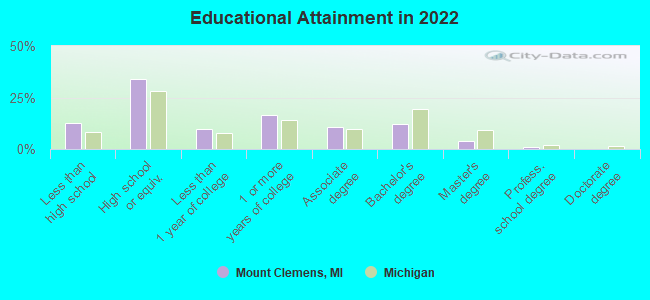
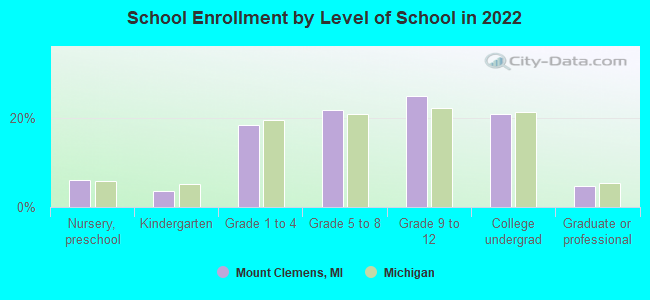
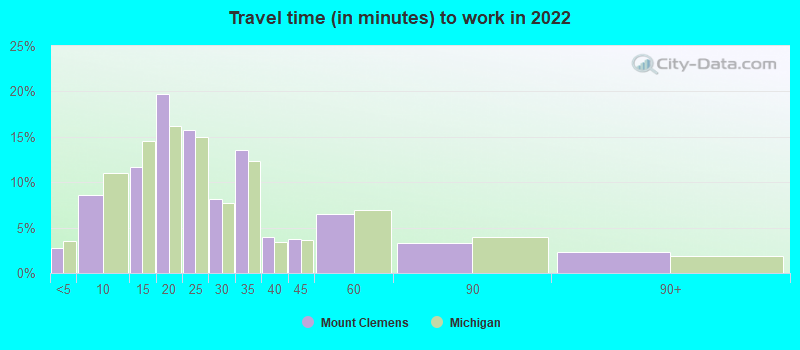
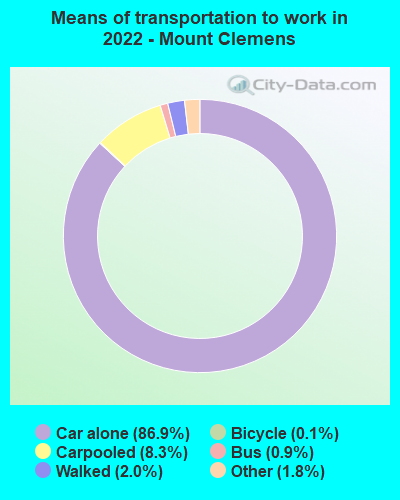
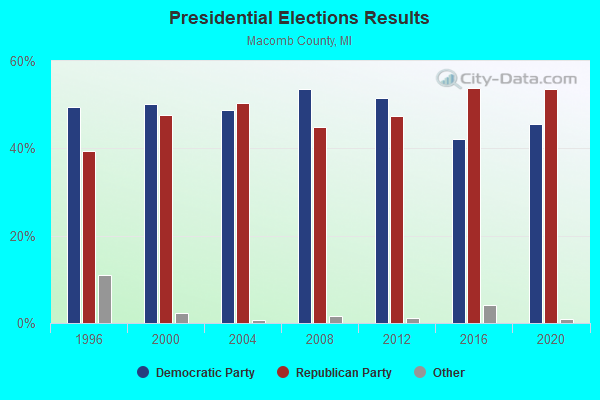
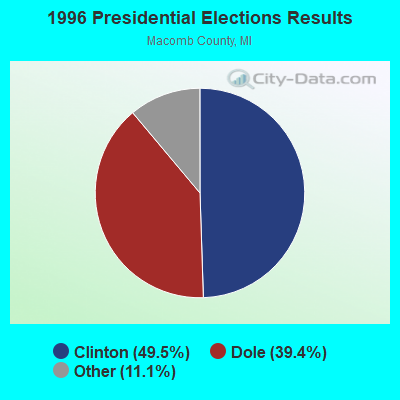
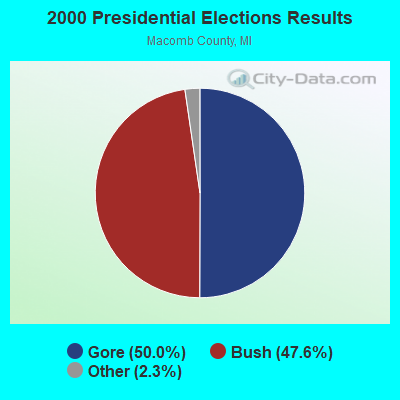
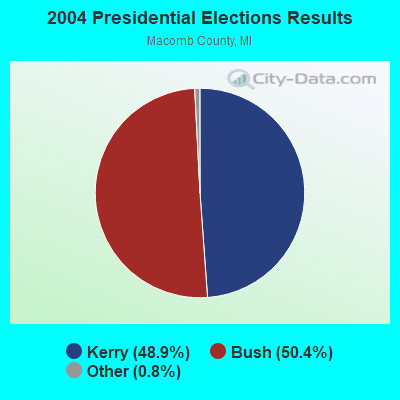
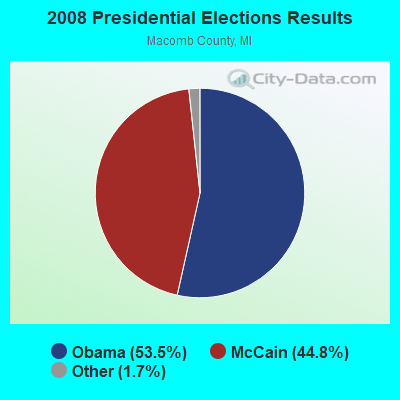
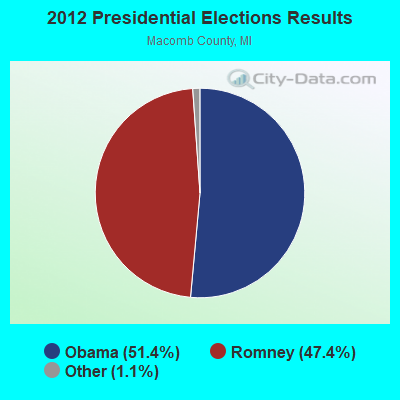
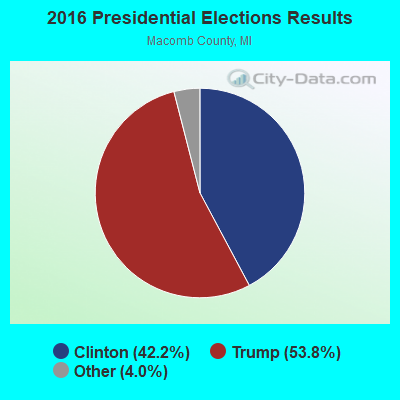
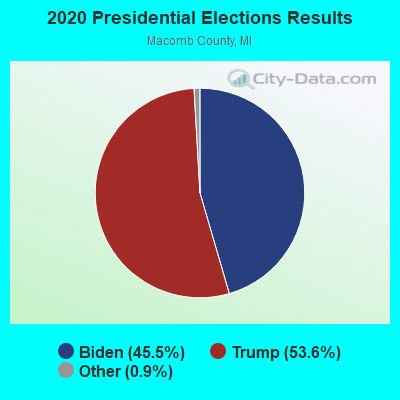
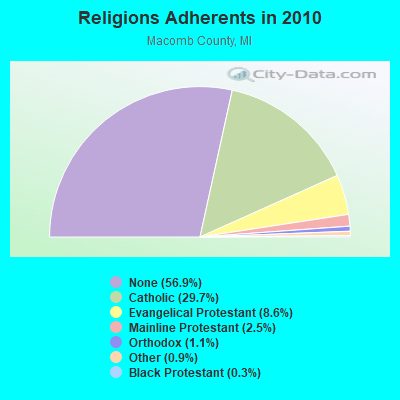
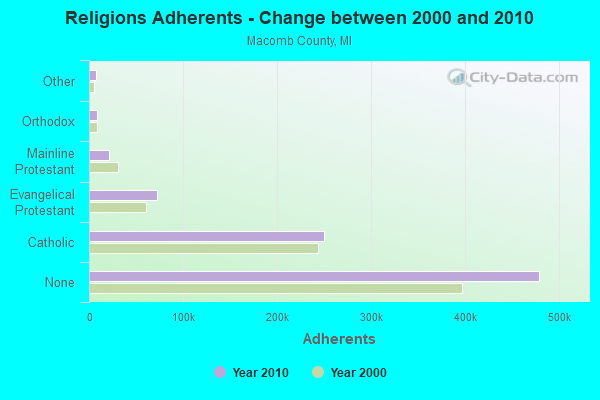
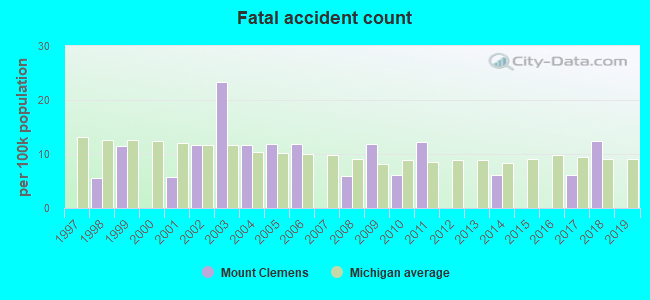
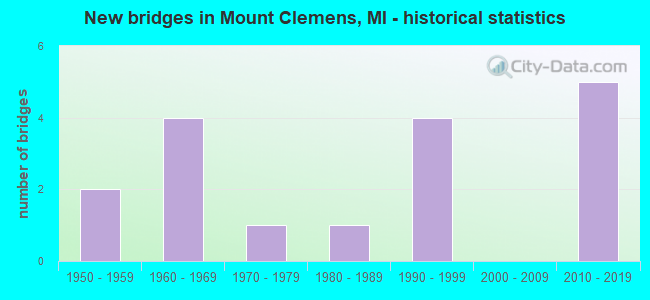
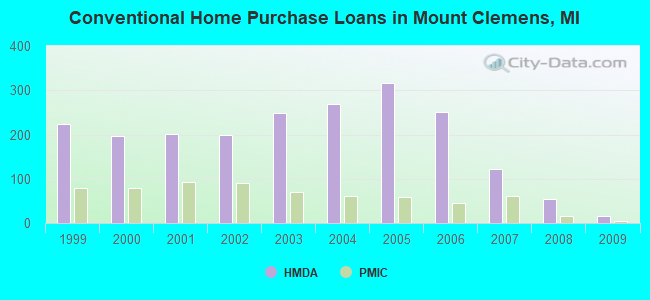
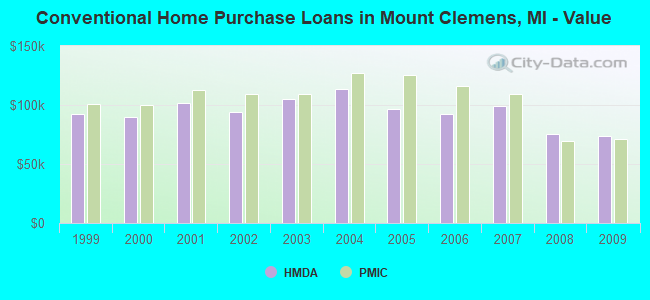
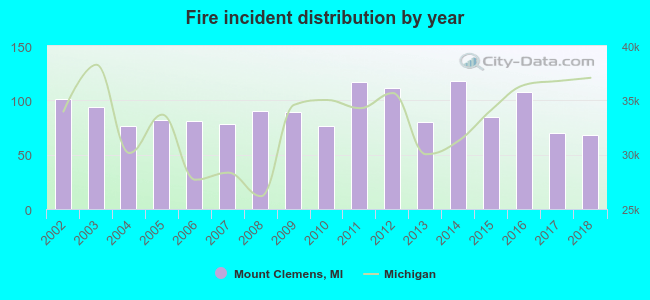 According to the data from the years 2002 - 2018 the average number of fires per year is 90. The highest number of reported fires - 118 took place in 2014, and the least - 68 in 2018. The data has a declining trend.
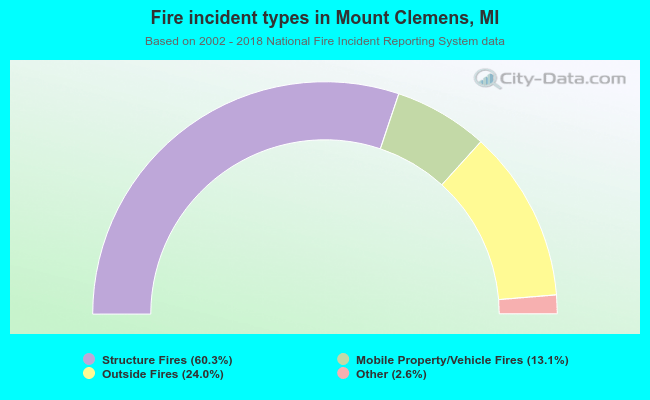 When looking into fire subcategories, the most incidents belonged to: Structure Fires (60.3%), and Outside Fires (24.0%).