Mount Clemens: Fire Incidents, Michigan (MI)
Where are fire incidents reported in Mount Clemens, MI
Something went wrong! Please refresh the page.
| Fire incidents reported | |
|---|---|
| Sreet name | Count |
| CHURCH | 230 |
| PARK ST | 150 |
| CHURCH ST | 132 |
| GRATIOT | 108 |
| RIVER RD | 100 |
| RIVER CT | 94 |
| CASS AVE | 92 |
| HUBBARD | 78 |
| NORTH AVE | 76 |
| GRATIOT AVE | 74 |
| MAIN ST | 70 |
| GROESBECK | 66 |
| GROESBECK HWY | 60 |
| CROCKER | 42 |
| CLINTON RIVER DR | 38 |
| CROCKER BLVD | 36 |
| HARRINGTON | 36 |
| EUCLID | 34 |
| ROSE | 34 |
| CLEMENS ST | 32 |
| COURT | 30 |
| FLORAL | 26 |
| JONES ST | 26 |
| VALLEY DR | 26 |
| WILSON | 26 |
| ELIZABETH | 24 |
| GALLUP AVE | 22 |
| DICKINSON | 20 |
| GIBBS | 20 |
| MARKET | 20 |
2002 - 2018 National Fire Incident Reporting System (NFIRS) incidents
- Incident types reported to NFIRS in Mount Clemens, MI
- 10,10156.7%Rescue & EMS
- 2,42813.6%Hazardous Condition
- 1,5248.6%Fire
- 1,4107.9%Good Intent Call
- 1,3427.5%Service Call
- 9525.3%False Alarm
- 260.1%Overpressure Rupture
- 260.1%Special Incident
- Fire incident types reported to NFIRS in Mount Clemens, MI
- 91960.3%Structure Fires
- 36524.0%Outside Fires
- 20013.1%Mobile Property/Vehicle Fires
- 402.6%Other
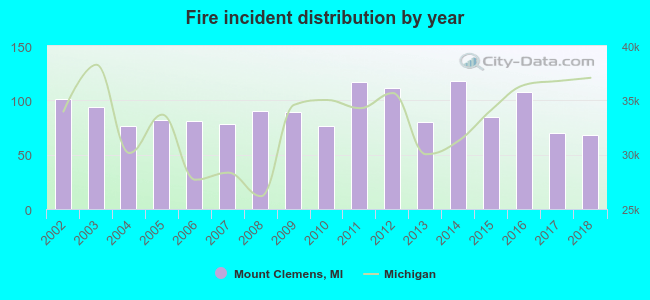 Based on the data from the years 2002 - 2018 the average number of fires per year is 90. The highest number of reported fires - 118 took place in 2014, and the least - 68 in 2018. The data has a decreasing trend.
The average number of yearly fire incidents per 10k residents in Mount Clemens, MI compared to nearest cities:
(Note: Based on data for the last 3 years, including only cities with population 5,000 and above)
| Mount Clemens: | 50.0 |
| Fraser: | 15.7 |
| Roseville: | 29.2 |
| Sterling Heights: | 18.3 |
| Shelby: | 5.2 |
| New Baltimore: | 12.2 |
| Eastpointe: | 32.2 |
| Warren: | 21.1 |
| Center Line: | 78.6 |
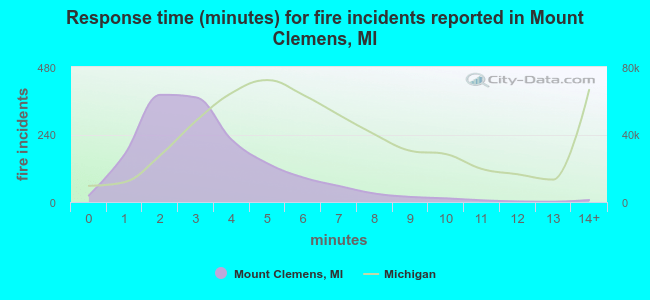 The median response time based on all reported fire incidents is 3 minutes. This is much lower compared to the Michigan median value.
The median response time in Mount Clemens, MI compared to nearest cities:
(Note: Based on data for all years, including only cities with at least 500 fire incidents)
| Mount Clemens: | 3 minutes |
| Roseville: | 4 minutes |
| St. Clair Shores: | 4 minutes |
| Sterling Heights: | 5 minutes |
| New Baltimore: | 7 minutes |
| Eastpointe: | 4 minutes |
| Warren: | 5 minutes |
| Center Line: | 3 minutes |
| Harper Woods: | 3 minutes |
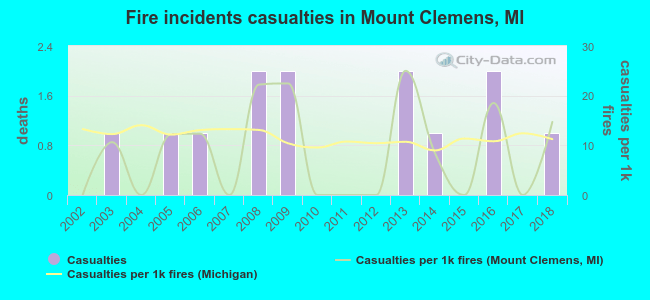 According to the reports from the years 2002 - 2018 the average number of fire-related casualties per year is 1. The highest number of reported casualties - 2 took place in 2008, and the lowest - 0 in 2002. The data has an increasing trend.
The average number of casualties per 1,000 fire incidents is 9. This indicator was the highest - 25 in 2013, and the lowest 0 in 2002. The trend for injuries per 1,000 incidents is increasing. Compared to the state value the number of casualties per 1,000 incidents is lower.
According to the reports from the years 2002 - 2018 the average number of fire-related casualties per year is 1. The highest number of reported casualties - 2 took place in 2008, and the lowest - 0 in 2002. The data has an increasing trend.
The average number of casualties per 1,000 fire incidents is 9. This indicator was the highest - 25 in 2013, and the lowest 0 in 2002. The trend for injuries per 1,000 incidents is increasing. Compared to the state value the number of casualties per 1,000 incidents is lower.Casualties per 1,000 incidents in Mount Clemens, MI compared to nearest cities:
(Note: Based on data for all years, including only cities with at least 500 fire incidents)
| Mount Clemens: | 8.5 |
| Roseville: | 12.8 |
| St. Clair Shores: | 16.8 |
| Sterling Heights: | 49.4 |
| New Baltimore: | 1.6 |
| Eastpointe: | 29.7 |
| Warren: | 24.1 |
| Center Line: | 31.9 |
| Harper Woods: | 10.9 |
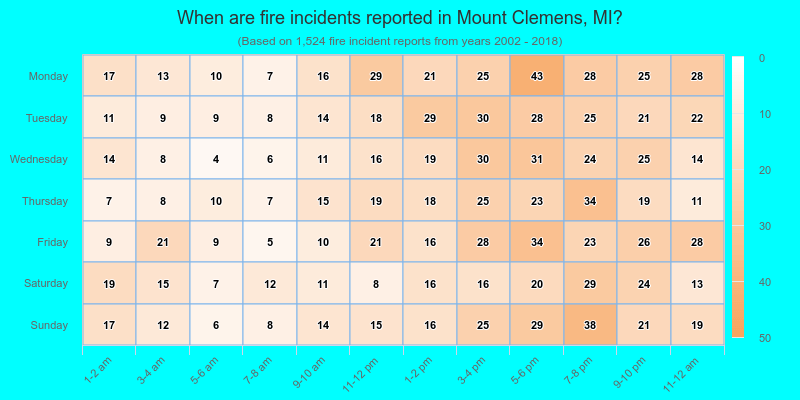
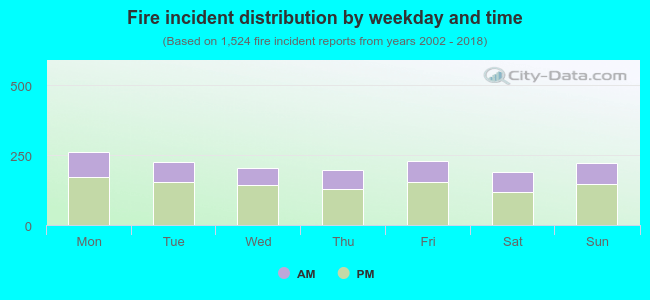 33.1% incidents where reported in the morning and 66.9% in the evening. The most fires (17.2%) took place on Monday, and the least (12.5%) on Saturday.
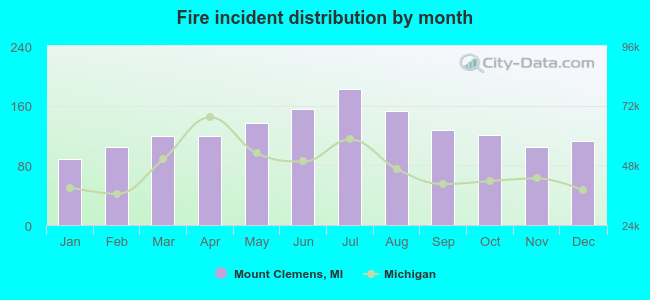 Based on the 1,524 incident reports from years 2002 - 2018 most fires (11.9%) took place during July, and the least (5.8%) in January.
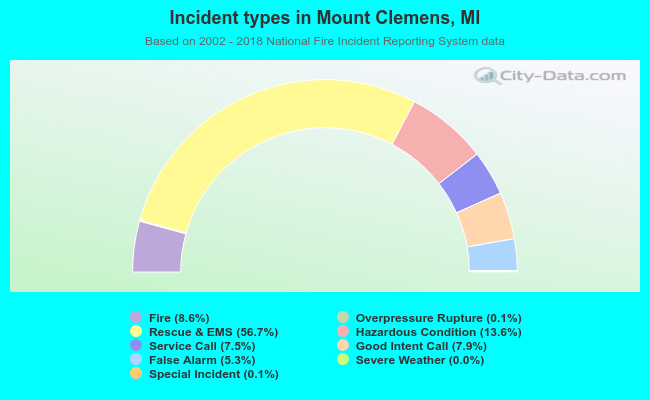 Out of all 17,815 cases reported during the years 2002 - 2018, the most belonged to the categories: Rescue & EMS (56.7%), Hazardous Condition (13.6%), and Fire (8.6%).
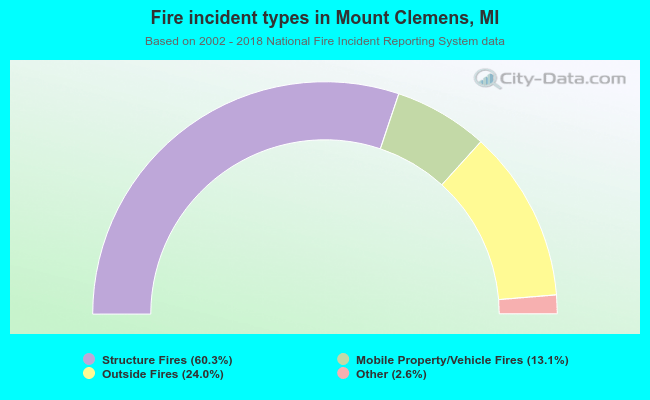 When looking into fire subcategories, the most incidents belonged to: Structure Fires (60.3%), and Outside Fires (24.0%).