Danville: Fire Incidents, California (CA)
Where are fire incidents reported in Danville, CA
Something went wrong! Please refresh the page.
|
| |||||||||||||||||||||||||||||||||||||||||||||||||||||||||||||||||||||||||||||||||||||||||||||||||||||||||||||
| Other | 115 | |||||||||||||||||||||||||||||||||||||||||||||||||||||||||||||||||||||||||||||||||||||||||||||||||||||||||||||
2007 - 2018 National Fire Incident Reporting System (NFIRS) incidents
- Incident types reported to NFIRS in Danville, CA
- 7,77063.8%Rescue & EMS
- 1,31110.8%Good Intent Call
- 1,0959.0%Service Call
- 7486.1%False Alarm
- 6465.3%Hazardous Condition
- 5634.6%Fire
- 200.2%Special Incident
- 130.1%Overpressure Rupture
- Fire incident types reported to NFIRS in Danville, CA
- 21838.7%Outside Fires
- 19935.3%Structure Fires
- 8615.3%Mobile Property/Vehicle Fires
- 6010.7%Other
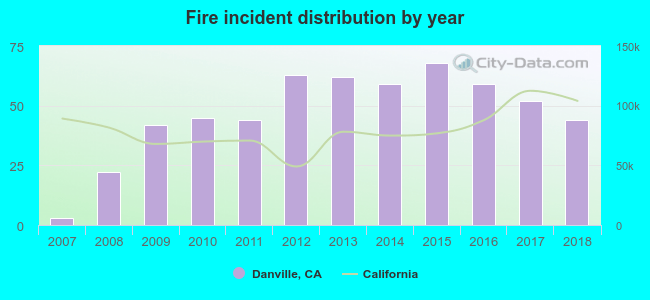 According to the data from the years 2007 - 2018 the average number of fires per year is 47. The highest number of fires - 68 took place in 2015, and the least - 3 in 2007. The data has a growing trend.
The average number of yearly fire incidents per 10k residents in Danville, CA compared to nearest cities:
(Note: Based on data for the last 3 years, including only cities with population 5,000 and above)
| Danville: | 11.8 |
| Blackhawk: | 9.6 |
| San Ramon: | 12.6 |
| Alamo: | 12.1 |
| Dublin: | 24.0 |
| Tassajara: | 1.3 |
| Walnut Creek: | 13.3 |
| Moraga: | 14.9 |
| Clayton: | 19.4 |
 The median response time based on all reported fire incidents is 6 minutes. This is similar to the state median value.
The median response time in Danville, CA compared to nearest cities:
(Note: Based on data for all years, including only cities with at least 500 fire incidents)
| Danville: | 6 minutes |
| San Ramon: | 5 minutes |
| Dublin: | 5 minutes |
| Walnut Creek: | 6 minutes |
| Lafayette: | 7 minutes |
| Castro Valley: | 5 minutes |
| Pleasanton: | 5 minutes |
| Concord: | 6 minutes |
| Pleasant Hill: | 6 minutes |
 31.4% incidents where reported in the morning and 68.6% in the evening. The most fires (15.8%) took place on Tuesday, and the least (12.6%) on Wednesday.
 Based on the 563 reports from years 2007 - 2018 most fires (16.0%) took place during July, and the least (3.9%) in February.
 Out of all 12,173 cases reported during the years 2007 - 2018, the most belonged to the categories: Rescue & EMS (63.8%), Good Intent Call (10.8%), and Service Call (9.0%).
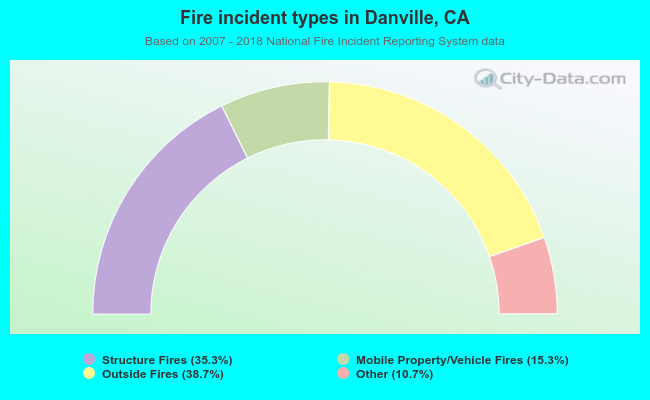 When looking into fire subcategories, the most incidents belonged to: Outside Fires (38.7%), and Structure Fires (35.3%).