Concord: Fire Incidents, California (CA)
Where are fire incidents reported in Concord, CA
Something went wrong! Please refresh the page.
| Fire incidents reported | |
|---|---|
| Sreet name | Count |
| CLAYTON RD | 316 |
| WILLOW PASS | 202 |
| SR 4 | 192 |
| MONUMENT BLVD | 140 |
| SR 242 | 118 |
| DETROIT AVE | 86 |
| OAK GROVE RD | 80 |
| WILLOW PASS RD | 74 |
| CONCORD AVE | 72 |
| PORT CHICAGO HWY | 72 |
| OLIVERA RD | 70 |
| CONCORD BLVD | 62 |
| GRANT ST | 62 |
| SOLANO WAY | 56 |
| MEADOW LN | 50 |
| MOHR LN | 48 |
| KIRKER PASS | 46 |
| MONUMENT BL | 42 |
| YGNACIO VALLEY RD | 42 |
| ARNOLD INDUSTRIAL WAY | 40 |
| COWELL RD | 40 |
| BAILEY RD | 38 |
| TREAT BLVD | 36 |
| BROADWAY ST | 34 |
| NORTHWOOD DR | 34 |
| PINE HOLLOW RD | 34 |
| ALBERTA WAY | 32 |
| DIAMOND BLVD | 30 |
| MARKET ST | 30 |
| I 680 | 28 |
| Other | 393 |
2005 - 2018 National Fire Incident Reporting System (NFIRS) incidents
- Incident types reported to NFIRS in Concord, CA
- 12,95455.7%Rescue & EMS
- 4,25518.3%Good Intent Call
- 2,59911.2%Fire
- 1,3315.7%Hazardous Condition
- 1,1204.8%Service Call
- 1,0004.3%False Alarm
- Fire incident types reported to NFIRS in Concord, CA
- 1,02839.6%Outside Fires
- 91635.2%Structure Fires
- 54120.8%Mobile Property/Vehicle Fires
- 1144.4%Other
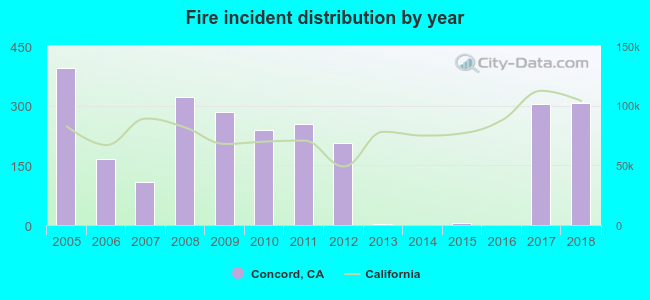 Based on the data from the years 2005 - 2018 the average number of fire incidents per year is 185. The highest number of reported fires - 394 took place in 2005, and the least - 1 in 2014. The data has a declining trend.
The average number of yearly fire incidents per 10k residents in Concord, CA compared to nearest cities:
(Note: Based on data for the last 3 years, including only cities with population 5,000 and above)
| Concord: | 16.0 |
| Pleasant Hill: | 25.1 |
| Walnut Creek: | 13.3 |
| Clayton: | 19.4 |
| Bay Point: | 54.3 |
| Martinez: | 21.8 |
| Pittsburg: | 31.1 |
| Lafayette: | 18.8 |
| Alamo: | 12.1 |
 The median response time based on all reported fire incidents is 6 minutes. This is similar to the California median value.
The median response time in Concord, CA compared to nearest cities:
(Note: Based on data for all years, including only cities with at least 500 fire incidents)
| Concord: | 6 minutes |
| Pleasant Hill: | 6 minutes |
| Walnut Creek: | 6 minutes |
| Bay Point: | 7 minutes |
| Martinez: | 7 minutes |
| Pittsburg: | 6 minutes |
| Lafayette: | 7 minutes |
| Benicia: | 6 minutes |
| Danville: | 6 minutes |
 According to the data from the years 2005 - 2018 the average number of fire-related yearly casualties is 0. The highest number of reported injuries - 2 took place in 2010, and the lowest - 0 in 2005. The data has a constant trend.
The average number of casualties per 1,000 fires is 1. This indicator was the highest - 8 in 2010, and the lowest 0 in 2005. The trend for injuries per 1,000 fire incidents is constant. Compared to the California value the number of injuries per 1,000 fire incidents is much lower.
According to the data from the years 2005 - 2018 the average number of fire-related yearly casualties is 0. The highest number of reported injuries - 2 took place in 2010, and the lowest - 0 in 2005. The data has a constant trend.
The average number of casualties per 1,000 fires is 1. This indicator was the highest - 8 in 2010, and the lowest 0 in 2005. The trend for injuries per 1,000 fire incidents is constant. Compared to the California value the number of injuries per 1,000 fire incidents is much lower.Casualties per 1,000 incidents in Concord, CA compared to nearest cities:
(Note: Based on data for all years, including only cities with at least 500 fire incidents)
| Concord: | 1.5 |
| Pleasant Hill: | 2.9 |
| Walnut Creek: | 1.7 |
| Bay Point: | 4.1 |
| Martinez: | 0.8 |
| Pittsburg: | 0.9 |
| Lafayette: | 1.9 |
| Benicia: | 6.6 |
| Danville: | 0.0 |
 33.8% incidents where reported in the morning and 66.2% in the evening. The most fires (15.5%) took place on Monday, and the least (13.5%) on Tuesday.
 According to the 2,599 reports from years 2005 - 2018 most fires (13.0%) took place during July, and the least (6.7%) in November.
 Out of all 23,276 cases reported during the years 2005 - 2018, the most belonged to the categories: Rescue & EMS (55.7%), Good Intent Call (18.3%), and Fire (11.2%).
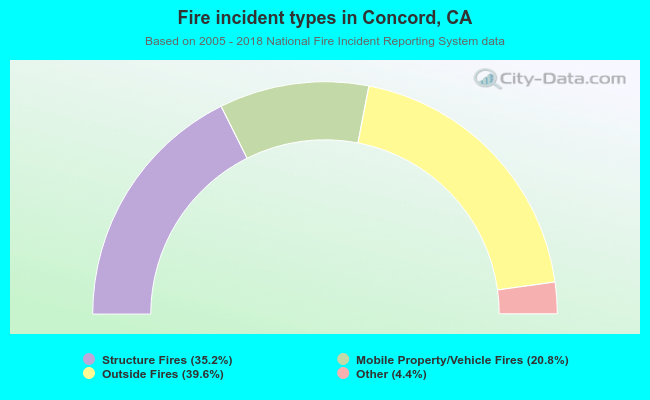 When looking into fire subcategories, the most reports belonged to: Outside Fires (39.6%), and Structure Fires (35.2%).