Blackhawk: Fire Incidents, California (CA)
Where are fire incidents reported in Blackhawk, CA
Something went wrong! Please refresh the page.
|
| |||||||||||||||||||||||||||||||||||||||||||||||||||||||||||||||||||||||||||||||||||||||||||||||||||||||||||||
2008 - 2018 National Fire Incident Reporting System (NFIRS) incidents
- Incident types reported to NFIRS in Blackhawk, CA
- 1,64467.3%Rescue & EMS
- 26610.9%Good Intent Call
- 1727.0%Service Call
- 1536.3%False Alarm
- 1014.1%Fire
- 1014.1%Hazardous Condition
- 40.2%Special Incident
- Fire incident types reported to NFIRS in Blackhawk, CA
- 4342.6%Outside Fires
- 3837.6%Structure Fires
- 109.9%Mobile Property/Vehicle Fires
- 109.9%Other
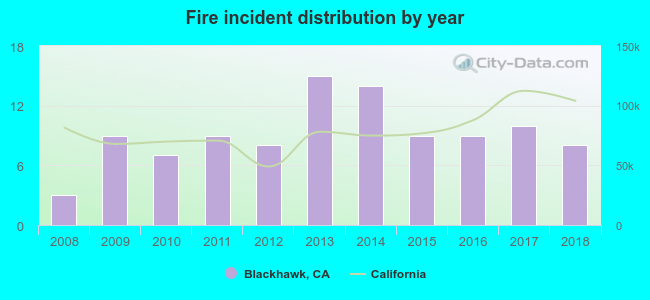 According to the data from the years 2008 - 2018 the average number of fires per year is 9. The highest number of reported fires - 15 took place in 2013, and the least - 3 in 2008. The data has a growing trend.
The average number of yearly fire incidents per 10k residents in Blackhawk, CA compared to nearest cities:
(Note: Based on data for the last 3 years, including only cities with population 5,000 and above)
| Blackhawk: | 9.6 |
| Danville: | 11.8 |
| Tassajara: | 1.3 |
| San Ramon: | 12.6 |
| Alamo: | 12.1 |
| Dublin: | 24.0 |
| Clayton: | 19.4 |
| Walnut Creek: | 13.3 |
| Pleasanton: | 20.6 |

 28.7% incidents where reported in the morning and 71.3% in the evening. The most fires (23.8%) took place on Wednesday, and the least (8.9%) on Sunday.
 According to the 101 reports from years 2008 - 2018 most fires (19.8%) took place during June, and the least (2.0%) in March.
 Out of all 2,442 cases reported during the years 2008 - 2018, the most belonged to the categories: Rescue & EMS (67.3%), Good Intent Call (10.9%), and Service Call (7.0%).
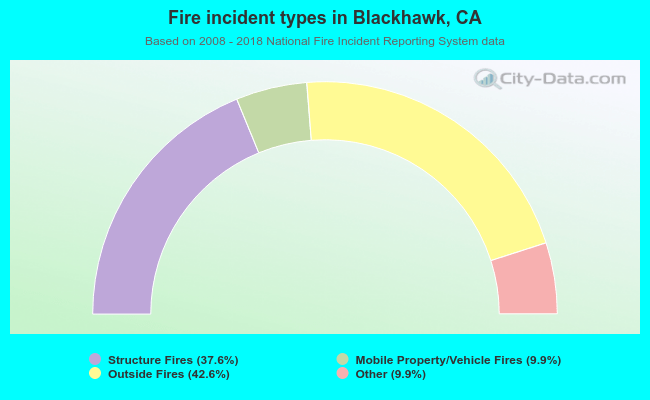 When looking into fire subcategories, the most reports belonged to: Outside Fires (42.6%), and Structure Fires (37.6%).