Cupertino: Fire Incidents, California (CA)
Where are fire incidents reported in Cupertino, CA
Something went wrong! Please refresh the page.
| Fire incidents reported | |
|---|---|
| Sreet name | Count |
| STEVENS CREEK BL | 140 |
| FY 280 | 86 |
| STEVENS CREEK | 72 |
| FY 85 | 66 |
| HOMESTEAD RD | 58 |
| STEVENS CANYON RD | 54 |
| WOLFE RD | 54 |
| MC CLELLAN RD | 40 |
| DE ANZA BL | 36 |
| MONTEBELLO RD | 28 |
| DE ANZA | 24 |
| VALLEY GREEN DR | 24 |
| BOLLINGER RD | 22 |
| STELLING RD | 22 |
| BUBB RD | 20 |
| CRISTO REY DR | 20 |
| CUPERTINO RD | 20 |
| FOOTHILL BL | 16 |
| RANDY LN | 16 |
| TANTAU | 16 |
| BLANEY AV | 14 |
| PARKWOOD DR | 14 |
| PORTAL AV | 14 |
| CALVERT DR | 12 |
| DEEPROSE PL | 12 |
| ESTATES DR | 12 |
| SUISUN DR | 12 |
| VIA PAVISO | 12 |
| VOSS AV | 12 |
| FINCH AV | 10 |
2005 - 2018 National Fire Incident Reporting System (NFIRS) incidents
- Incident types reported to NFIRS in Cupertino, CA
- 9,27658.2%Rescue & EMS
- 2,30814.5%Good Intent Call
- 1,4058.8%False Alarm
- 1,0326.5%Service Call
- 9656.1%Hazardous Condition
- 8995.6%Fire
- 350.2%Overpressure Rupture
- Fire incident types reported to NFIRS in Cupertino, CA
- 34738.6%Outside Fires
- 33737.5%Structure Fires
- 17018.9%Mobile Property/Vehicle Fires
- 455.0%Other
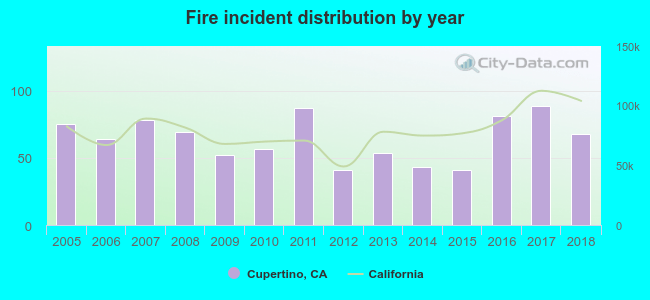 Based on the data from the years 2005 - 2018 the average number of fires per year is 64. The highest number of reported fire incidents - 89 took place in 2017, and the least - 41 in 2012. The data has a declining trend.
The average number of yearly fire incidents per 10k residents in Cupertino, CA compared to nearest cities:
(Note: Based on data for the last 3 years, including only cities with population 5,000 and above)
| Cupertino: | 13.1 |
| Saratoga: | 8.6 |
| Sunnyvale: | 9.6 |
| Los Altos: | 11.9 |
| Santa Clara: | 1.8 |
| Campbell: | 20.7 |
| Mountain View: | 5.5 |
| Los Altos Hills: | 22.2 |
| Los Gatos: | 32.2 |
 The median response time based on all reported fire incidents is 5 minutes. This is lower than the state median value.
The median response time in Cupertino, CA compared to nearest cities:
(Note: Based on data for all years, including only cities with at least 500 fire incidents)
| Cupertino: | 5 minutes |
| Sunnyvale: | 5 minutes |
| Campbell: | 5 minutes |
| Mountain View: | 5 minutes |
| Los Gatos: | 6 minutes |
| San Jose: | 6 minutes |
| Palo Alto: | 6 minutes |
| Milpitas: | 5 minutes |
| East Palo Alto: | 4 minutes |
 According to the data from the years 2005 - 2018 the average number of fire-related yearly deaths is 0. The highest number of reported deaths - 1 took place in 2008, and the lowest - 0 in 2005. The data has a constant trend.
 Based on the data from the years 2005 - 2018 the average number of fire-related casualties per year is 1. The highest number of casualties - 3 took place in 2010, and the lowest - 0 in 2005. The data has a constant trend.
The average number of injuries per 1,000 fire incidents is 14. This indicator was the highest - 53 in 2010, and the lowest 0 in 2005. The trend for injuries per 1,000 fires is decreasing. Compared to the state value the number of casualties per 1,000 incidents is much higher.
Based on the data from the years 2005 - 2018 the average number of fire-related casualties per year is 1. The highest number of casualties - 3 took place in 2010, and the lowest - 0 in 2005. The data has a constant trend.
The average number of injuries per 1,000 fire incidents is 14. This indicator was the highest - 53 in 2010, and the lowest 0 in 2005. The trend for injuries per 1,000 fires is decreasing. Compared to the state value the number of casualties per 1,000 incidents is much higher.Casualties per 1,000 incidents in Cupertino, CA compared to nearest cities:
(Note: Based on data for all years, including only cities with at least 500 fire incidents)
| Cupertino: | 13.3 |
| Sunnyvale: | 18.3 |
| Campbell: | 24.7 |
| Mountain View: | 4.7 |
| Los Gatos: | 19.7 |
| San Jose: | 8.7 |
| Palo Alto: | 3.0 |
| Milpitas: | 5.1 |
| East Palo Alto: | 6.1 |
 33.1% incidents where reported in the morning and 66.9% in the evening. The most fires (16.6%) took place on Wednesday, and the least (12.1%) on Sunday.
 According to the 899 fires from years 2005 - 2018 most fires (13.0%) took place during June, and the least (5.5%) in February.
 Out of all 15,929 cases reported during the years 2005 - 2018, the most belonged to the categories: Rescue & EMS (58.2%), Good Intent Call (14.5%), and False Alarm (8.8%).
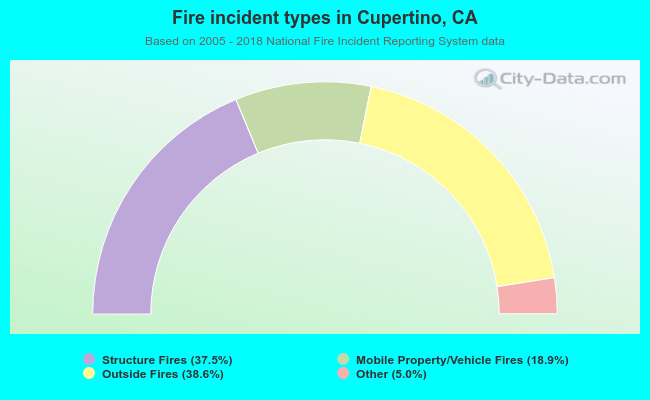 When looking into fire subcategories, the most incidents belonged to: Outside Fires (38.6%), and Structure Fires (37.5%).