Campbell: Fire Incidents, California (CA)
Where are fire incidents reported in Campbell, CA
Something went wrong! Please refresh the page.
| Fire incidents reported | |
|---|---|
| Sreet name | Count |
| HY 17 | 140 |
| HAMILTON AV | 118 |
| BASCOM AV | 108 |
| WINCHESTER BL | 76 |
| BASCOM | 72 |
| CAMPBELL AV | 62 |
| UNION AV | 58 |
| HACIENDA AV | 46 |
| HAMILTON | 44 |
| CAMPBELL | 40 |
| RINCON AV | 40 |
| SAN TOMAS EX | 40 |
| DOVER | 32 |
| SAN TOMAS AQUINO RD | 32 |
| FY 17 | 30 |
| WINCHESTER | 28 |
| CAMDEN AV | 26 |
| SHARMON PALMS LN | 22 |
| UNION | 22 |
| SAN TOMAS | 20 |
| ABBOTT AV | 18 |
| DILLON AV | 18 |
| NIDO DR | 18 |
| SUNNYOAKS AV | 18 |
| BUDD AV | 16 |
| MC GLINCY LN | 16 |
| DUNSTER DR | 14 |
| HOLLIS AV | 14 |
| 3RD ST | 12 |
| CROCKETT AV | 12 |
2005 - 2018 National Fire Incident Reporting System (NFIRS) incidents
- Incident types reported to NFIRS in Campbell, CA
- 9,02457.6%Rescue & EMS
- 2,51716.1%Good Intent Call
- 1,3068.3%Service Call
- 1,0516.7%Fire
- 8775.6%Hazardous Condition
- 8735.6%False Alarm
- Fire incident types reported to NFIRS in Campbell, CA
- 38336.4%Structure Fires
- 37635.8%Outside Fires
- 23122.0%Mobile Property/Vehicle Fires
- 615.8%Other
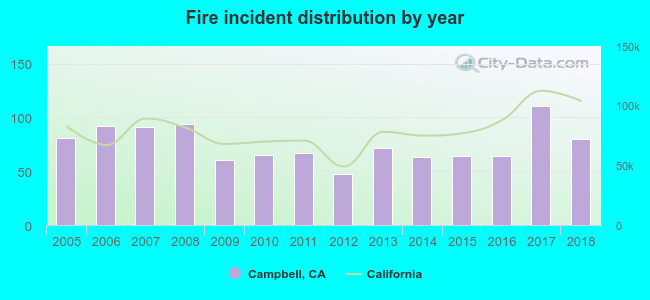 Based on the data from the years 2005 - 2018 the average number of fire incidents per year is 75. The highest number of reported fire incidents - 111 took place in 2017, and the least - 47 in 2012. The data has a declining trend.
The average number of yearly fire incidents per 10k residents in Campbell, CA compared to nearest cities:
(Note: Based on data for the last 3 years, including only cities with population 5,000 and above)
| Campbell: | 20.7 |
| Los Gatos: | 32.2 |
| Saratoga: | 8.6 |
| San Jose: | 15.6 |
| Santa Clara: | 1.8 |
| Cupertino: | 13.1 |
| Sunnyvale: | 9.6 |
| Los Altos: | 11.9 |
| Mountain View: | 5.5 |
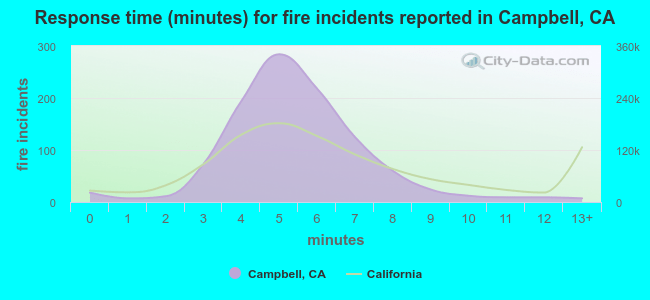 The median response time based on all reported fire incidents is 5 minutes. This is lower compared to the California median value.
The median response time in Campbell, CA compared to nearest cities:
(Note: Based on data for all years, including only cities with at least 500 fire incidents)
| Campbell: | 5 minutes |
| Los Gatos: | 6 minutes |
| San Jose: | 6 minutes |
| Cupertino: | 5 minutes |
| Sunnyvale: | 5 minutes |
| Mountain View: | 5 minutes |
| Milpitas: | 5 minutes |
| Palo Alto: | 6 minutes |
| East Palo Alto: | 4 minutes |
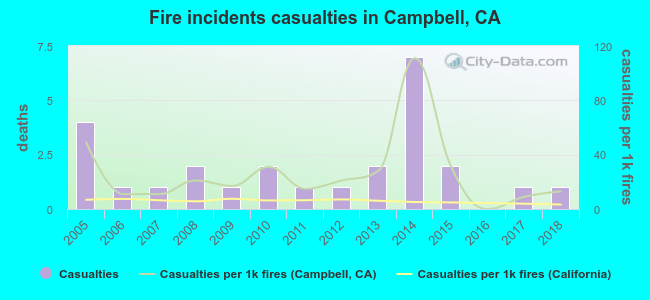 According to the data from the years 2005 - 2018 the average number of fire-related casualties per year is 2. The highest number of casualties - 7 took place in 2014, and the lowest - 0 in 2016. The data has a dropping trend.
The average number of casualties per 1,000 fires is 26. This indicator was the highest - 111 in 2014, and the lowest 0 in 2016. The trend for injuries per 1,000 incidents is dropping. Compared to the state value the number of injuries per 1,000 fires is much higher.
According to the data from the years 2005 - 2018 the average number of fire-related casualties per year is 2. The highest number of casualties - 7 took place in 2014, and the lowest - 0 in 2016. The data has a dropping trend.
The average number of casualties per 1,000 fires is 26. This indicator was the highest - 111 in 2014, and the lowest 0 in 2016. The trend for injuries per 1,000 incidents is dropping. Compared to the state value the number of injuries per 1,000 fires is much higher.Casualties per 1,000 incidents in Campbell, CA compared to nearest cities:
(Note: Based on data for all years, including only cities with at least 500 fire incidents)
| Campbell: | 24.7 |
| Los Gatos: | 19.7 |
| San Jose: | 8.7 |
| Cupertino: | 13.3 |
| Sunnyvale: | 18.3 |
| Mountain View: | 4.7 |
| Milpitas: | 5.1 |
| Palo Alto: | 3.0 |
| East Palo Alto: | 6.1 |
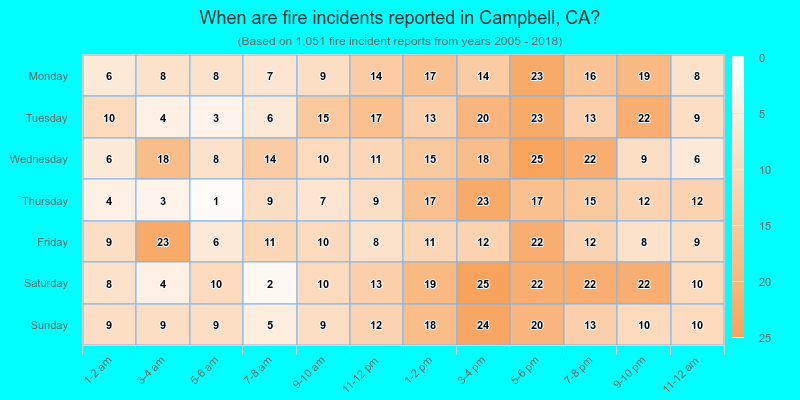
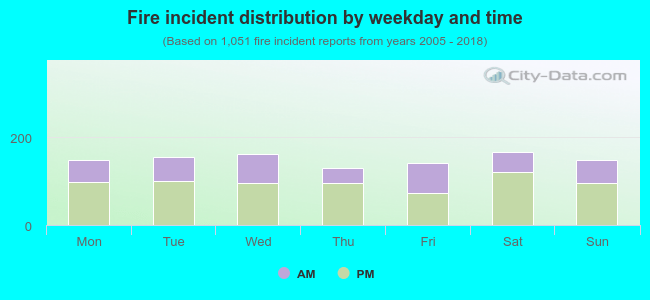 35.6% incidents where reported in the morning and 64.4% in the evening. The most fires (15.9%) took place on Saturday, and the least (12.3%) on Thursday.
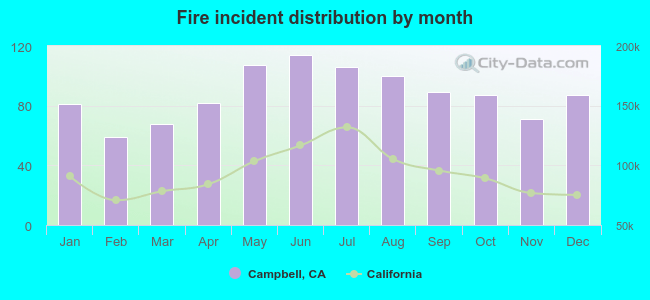 Based on the 1,051 incident reports from years 2005 - 2018 most fires (10.8%) took place during June, and the least (5.6%) in February.
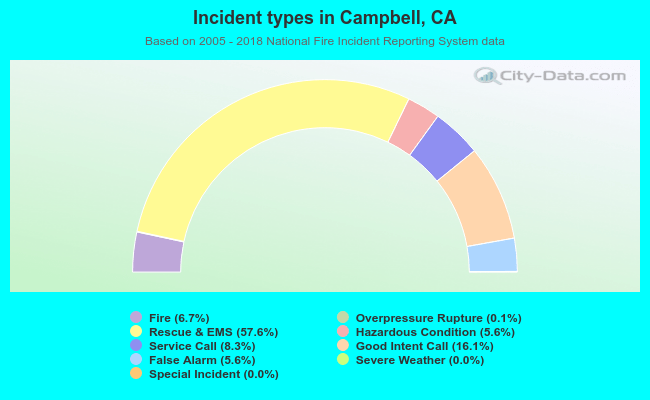 Out of all 15,668 cases reported during the years 2005 - 2018, the most belonged to the categories: Rescue & EMS (57.6%), Good Intent Call (16.1%), and Service Call (8.3%).
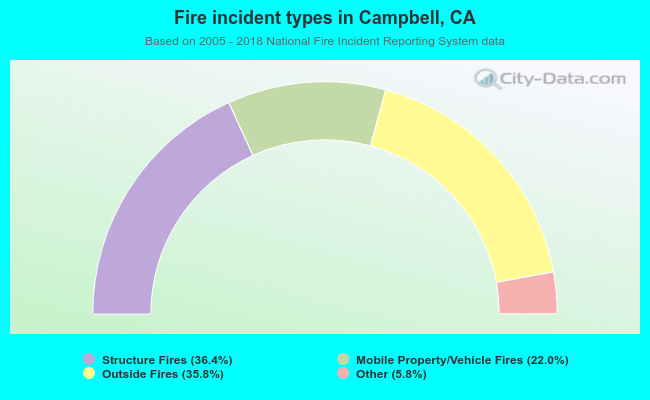 When looking into fire subcategories, the most reports belonged to: Structure Fires (36.4%), and Outside Fires (35.8%).