Los Altos: Fire Incidents, California (CA)
Where are fire incidents reported in Los Altos, CA
Something went wrong! Please refresh the page.
|
| |||||||||||||||||||||||||||||||||||||||||||||||||||||||||||||||||||||||||||||||||||||||||||||||||||||||||||||
2005 - 2018 National Fire Incident Reporting System (NFIRS) incidents
- Incident types reported to NFIRS in Los Altos, CA
- 5,63455.3%Rescue & EMS
- 1,38113.6%Good Intent Call
- 9469.3%False Alarm
- 9349.2%Service Call
- 8378.2%Hazardous Condition
- 4244.2%Fire
- 180.2%Overpressure Rupture
- Fire incident types reported to NFIRS in Los Altos, CA
- 18443.4%Structure Fires
- 15135.6%Outside Fires
- 5813.7%Mobile Property/Vehicle Fires
- 317.3%Other
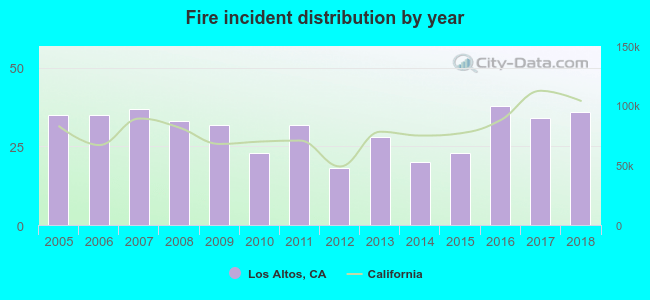 According to the data from the years 2005 - 2018 the average number of fire incidents per year is 30. The highest number of reported fire incidents - 38 took place in 2016, and the least - 18 in 2012. The data has a rising trend.
The average number of yearly fire incidents per 10k residents in Los Altos, CA compared to nearest cities:
(Note: Based on data for the last 3 years, including only cities with population 5,000 and above)
| Los Altos: | 11.9 |
| Mountain View: | 5.5 |
| Los Altos Hills: | 22.2 |
| Sunnyvale: | 9.6 |
| Cupertino: | 13.1 |
| Palo Alto: | 18.5 |
| Stanford: | 21.7 |
| Santa Clara: | 1.8 |
| East Palo Alto: | 20.3 |

 Based on the reports from the years 2005 - 2018 the average number of fire-related casualties per year is 0. The highest number of casualties - 2 took place in 2007, and the lowest - 0 in 2006. The data has a decreasing trend.
 32.5% incidents where reported in the morning and 67.5% in the evening. The most fires (18.9%) took place on Monday, and the least (11.6%) on Wednesday.
 According to the 424 fire incident reports from years 2005 - 2018 most fires (12.0%) took place during August, and the least (5.0%) in February.
 Out of all 10,183 cases reported during the years 2005 - 2018, the most belonged to the categories: Rescue & EMS (55.3%), Good Intent Call (13.6%), and False Alarm (9.3%).
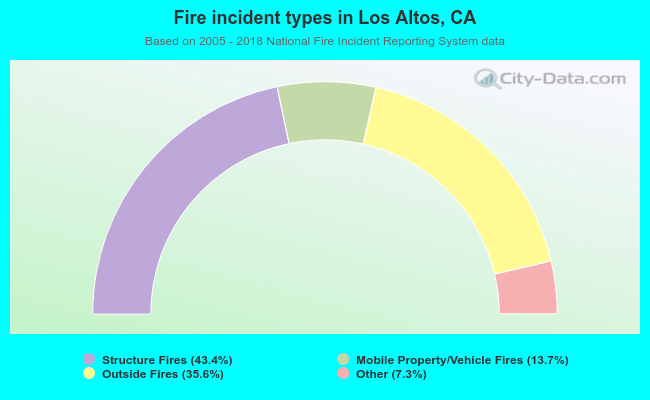 When looking into fire subcategories, the most reports belonged to: Structure Fires (43.4%), and Outside Fires (35.6%).