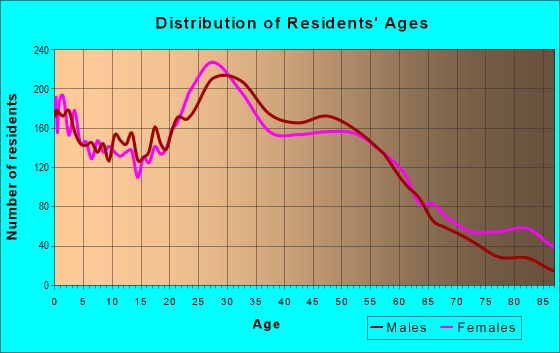
Estimated zip code population in 2022: 24,570 Zip code population in 2010: 22,851 Zip code population in 2000: 22,355
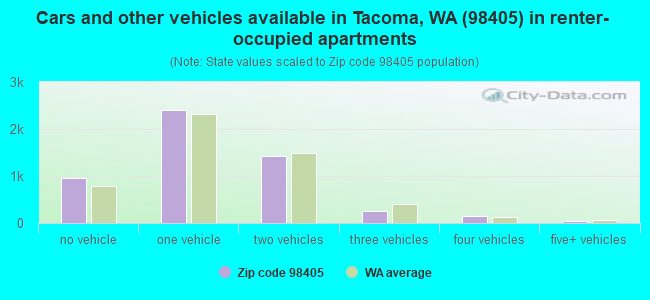
Houses and condos: 11,598 Renter-occupied apartments: 5,186
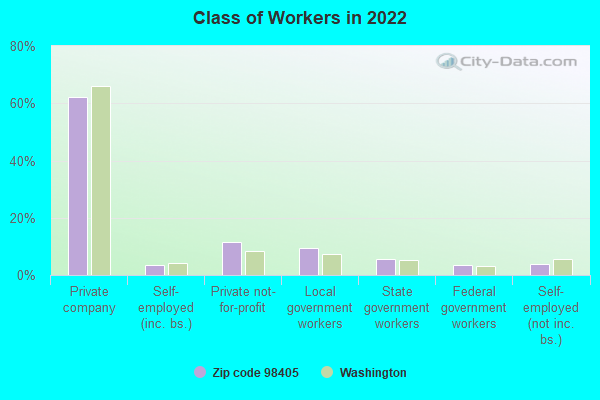
% of renters here:
49%
State:
36%
March 2022 cost of living index in zip code 98405: 109.8 (more than average, U.S. average is 100)
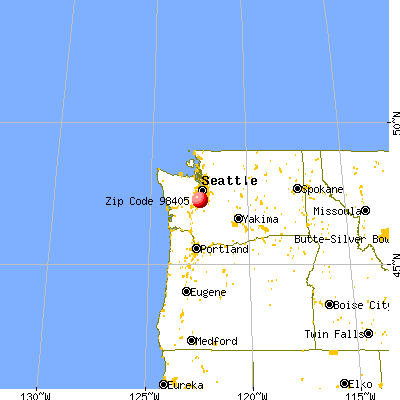
Land area: 4.1 sq. mi. Water area: 0.0 sq. mi.
Population density: 5,960 people per square mile
(average).
OSM Map
General Map
Google Map
MSN Map
OSM Map
General Map
Google Map
MSN Map
OSM Map
General Map
Google Map
MSN Map
OSM Map
General Map
Google Map
MSN Map
Please wait while loading the map...
Real estate property taxes paid for housing units in 2022:
This zip code:
0.8% ($3,759)
Washington:
0.8% ($4,283)
Median real estate property taxes paid for housing units with mortgages in 2022: $3,846 (0.8%) Median real estate property taxes paid for housing units with no mortgage in 2022: $3,608 (0.8%)
Averages for the 2020 tax year for zip code 98405, filed in 2021:
Average Adjusted Gross Income (AGI) in 2020: $55,005 (Individual Income Tax Returns)
Here:
$55,005
State:
$99,264
Salary/wage: $51,199 (reported on 86.2% of returns)
Here:
$51,199
State:
$80,347
(% of AGI for various income ranges: 1094.9% for AGIs below $25k, 3563.1% for AGIs $25k-50k, 6624.3% for AGIs $50k-75k, 9862.8% for AGIs $75k-100k, 17791.0% for AGIs $100k-200k, 62550.0% for AGIs over 200k)
Taxable interest for individuals: $667 (reported on 20.5% of returns)
This zip code:
$667
Washington:
$2,077
(% of AGI for various income ranges: 7.3% for AGIs below $25k, 9.3% for AGIs $25k-50k, 21.3% for AGIs $50k-75k, 17.7% for AGIs $75k-100k, 55.6% for AGIs $100k-200k, 255.0% for AGIs over 200k)
Ordinary dividends: $2,436 (reported on 12.5% of returns)
Here:
$2,436
State:
$10,013
(% of AGI for various income ranges: 13.3% for AGIs below $25k, 23.0% for AGIs $25k-50k, 42.0% for AGIs $50k-75k, 59.7% for AGIs $75k-100k, 110.6% for AGIs $100k-200k, 655.0% for AGIs over 200k)
Net capital gain/loss in AGI: +$9,274 (reported on 11.8% of returns)
Here:
+$9,274
State:
+$40,092
(% of AGI for various income ranges: 6.8% for AGIs below $25k, 16.8% for AGIs $25k-50k, 52.7% for AGIs $50k-75k, 97.8% for AGIs $75k-100k, 327.3% for AGIs $100k-200k, 12630.0% for AGIs over 200k)
Profit/loss from business: +$12,264 (reported on 12.0% of returns)
Here:
+$12,264
State:
+$18,312
(% of AGI for various income ranges: 66.1% for AGIs below $25k, 95.3% for AGIs $25k-50k, 200.0% for AGIs $50k-75k, 319.2% for AGIs $75k-100k, 588.8% for AGIs $100k-200k, 2653.3% for AGIs over 200k)
Taxable individual retirement arrangement distribution: $14,417 (reported on 4.5% of returns)
98405:
$14,417
Washington:
$24,221
(% of AGI for various income ranges: 29.5% for AGIs below $25k, 29.2% for AGIs $25k-50k, 92.7% for AGIs $50k-75k, 124.4% for AGIs $75k-100k, 396.2% for AGIs $100k-200k)
Self-employed (Keogh) retirement plans: $9,333 (reported on 0.3% of returns)
98405:
$9,333
Washington:
$24,166
(% of AGI for various income ranges: 32.2% for AGIs $75k-100k)
Total itemized deductions: $24,952 (reported on 7.2% of returns)
Here:
$24,952
State:
$39,068
(% of AGI for various income ranges: 30.9% for AGIs below $25k, 91.5% for AGIs $25k-50k, 274.0% for AGIs $50k-75k, 475.1% for AGIs $75k-100k, 748.2% for AGIs $100k-200k, 4168.3% for AGIs over 200k)
Charity contributions: $5,704 (reported on 4.6% of returns)
Here:
$5,704
State:
$15,331
(% of AGI for various income ranges: 2.0% for AGIs below $25k, 7.2% for AGIs $25k-50k, 20.9% for AGIs $50k-75k, 62.9% for AGIs $75k-100k, 154.9% for AGIs $100k-200k, 970.0% for AGIs over 200k)
Taxes paid: $6,152 (reported on 6.9% of returns)
98405:
$6,152
State:
$7,774
(% of AGI for various income ranges: 4.2% for AGIs below $25k, 19.5% for AGIs $25k-50k, 72.9% for AGIs $50k-75k, 125.1% for AGIs $75k-100k, 182.0% for AGIs $100k-200k, 798.3% for AGIs over 200k)
Earned income credit: $1,882 (reported on 14.1% of returns)
Here:
$1,882
State:
$2,020
(% of AGI for various income ranges: 72.6% for AGIs below $25k, 41.4% for AGIs $25k-50k)
Percentage of individuals using paid preparers for their 2020 taxes: 94.0%
Here:
94%
State:
93%
(% for various income ranges: 92.8% for AGIs below $25k, 94.6% for AGIs $25k-50k, 95.1% for AGIs $50k-75k, 94.1% for AGIs $75k-100k, 94.3% for AGIs $100k-200k, 89.5% for AGIs over 200k)
Averages for the 2012 tax year for zip code 98405, filed in 2013:
Average Adjusted Gross Income (AGI) in 2012: $39,043 (Individual Income Tax Returns)
Here:
$39,043
State:
$69,533
Salary/wage: $37,257 (reported on 86.4% of returns)
Here:
$37,257
State:
$57,267
(% of AGI for various income ranges: 77.3% for AGIs below $25k, 84.1% for AGIs $25k-50k, 84.8% for AGIs $50k-75k, 85.3% for AGIs $75k-100k, 82.5% for AGIs $100k-200k, 64.9% for AGIs over 200k)
Taxable interest for individuals: $573 (reported on 22.9% of returns)
This zip code:
$573
Washington:
$1,816
(% of AGI for various income ranges: 0.6% for AGIs below $25k, 0.2% for AGIs $25k-50k, 0.2% for AGIs $50k-75k, 0.5% for AGIs $75k-100k, 0.2% for AGIs $100k-200k, 0.4% for AGIs over 200k)
Ordinary dividends: $3,148 (reported on 10.6% of returns)
Here:
$3,148
State:
$8,163
(% of AGI for various income ranges: 1.3% for AGIs below $25k, 1.3% for AGIs $25k-50k, 0.5% for AGIs $50k-75k, 0.3% for AGIs $75k-100k, 0.7% for AGIs $100k-200k, 1.0% for AGIs over 200k)
Net capital gain/loss in AGI: +$2,626 (reported on 8.0% of returns)
Here:
+$2,626
State:
+$21,568
(% of AGI for various income ranges: 0.2% for AGIs $25k-50k, 0.3% for AGIs $50k-75k, 0.2% for AGIs $75k-100k, 1.4% for AGIs $100k-200k, 4.6% for AGIs over 200k)
Profit/loss from business: +$11,022 (reported on 10.5% of returns)
Here:
+$11,022
State:
+$16,521
(% of AGI for various income ranges: 5.7% for AGIs below $25k, 2.2% for AGIs $25k-50k, 2.1% for AGIs $50k-75k, 1.8% for AGIs $75k-100k, 4.9% for AGIs $100k-200k)
Taxable individual retirement arrangement distribution: $11,056 (reported on 5.2% of returns)
98405:
$11,056
Washington:
$18,648
(% of AGI for various income ranges: 1.4% for AGIs below $25k, 0.9% for AGIs $25k-50k, 1.5% for AGIs $50k-75k, 1.5% for AGIs $75k-100k, 2.8% for AGIs $100k-200k)
Total itemized deductions: $16,589 (24% of AGI, reported on 24.6% of returns)
Here:
$16,589
State:
$23,872
Here:
24.4% of AGI
State:
18.2% of AGI
(% of AGI for various income ranges: 7.1% for AGIs below $25k, 8.4% for AGIs $25k-50k, 12.2% for AGIs $50k-75k, 12.3% for AGIs $75k-100k, 12.7% for AGIs $100k-200k, 10.3% for AGIs over 200k)
Charity contributions: $2,815 (reported on 18.3% of returns)
Here:
$2,815
State:
$4,465
(% of AGI for various income ranges: 0.5% for AGIs below $25k, 0.8% for AGIs $25k-50k, 1.4% for AGIs $50k-75k, 1.7% for AGIs $75k-100k, 2.1% for AGIs $100k-200k, 2.8% for AGIs over 200k)
Taxes paid: $4,010 (reported on 24.3% of returns)
98405:
$4,010
State:
$6,400
(% of AGI for various income ranges: 1.3% for AGIs below $25k, 2.0% for AGIs $25k-50k, 2.9% for AGIs $50k-75k, 3.1% for AGIs $75k-100k, 3.2% for AGIs $100k-200k, 2.8% for AGIs over 200k)
Earned income credit: $2,051 (reported on 22.3% of returns)
Here:
$2,051
State:
$2,073
(% of AGI for various income ranges: 6.4% for AGIs below $25k, 0.9% for AGIs $25k-50k)
Percentage of individuals using paid preparers for their 2012 taxes: 35.4%
Here:
35%
State:
43%
(% for various income ranges: 32.5% for AGIs below $25k, 34.1% for AGIs $25k-50k, 37.2% for AGIs $50k-75k, 42.6% for AGIs $75k-100k, 49.0% for AGIs $100k-200k, 80.0% for AGIs over 200k)
Averages for the 2004 tax year for zip code 98405, filed in 2005:
Average Adjusted Gross Income (AGI) in 2004: $31,829 (Individual Income Tax Returns)
Here:
$31,829
State:
$54,331
Salary/wage: $30,743 (reported on 87.4% of returns)
Here:
$30,743
State:
$45,761
(% of AGI for various income ranges: 102.7% for AGIs below $10k, 79.8% for AGIs $10k-25k, 87.3% for AGIs $25k-50k, 87.0% for AGIs $50k-75k, 85.9% for AGIs $75k-100k, 70.6% for AGIs over 100k)
Taxable interest for individuals: $1,129 (reported on 26.6% of returns)
This zip code:
$1,129
Washington:
$2,110
(% of AGI for various income ranges: 2.2% for AGIs below $10k, 1.1% for AGIs $10k-25k, 0.8% for AGIs $25k-50k, 0.7% for AGIs $50k-75k, 0.7% for AGIs $75k-100k, 1.5% for AGIs over 100k)
Taxable dividends: $2,039 (reported on 12.4% of returns)
Here:
$2,039
State:
$5,879
(% of AGI for various income ranges: 1.7% for AGIs below $10k, 0.8% for AGIs $10k-25k, 0.5% for AGIs $25k-50k, 0.6% for AGIs $50k-75k, 0.5% for AGIs $75k-100k, 2.0% for AGIs over 100k)
Net capital gain/loss: +$5,387 (reported on 9.7% of returns)
Here:
+$5,387
State:
+$15,835
(% of AGI for various income ranges: -0.6% for AGIs below $10k, 0.0% for AGIs $10k-25k, 0.3% for AGIs $25k-50k, 1.0% for AGIs $50k-75k, 1.5% for AGIs $75k-100k, 10.0% for AGIs over 100k)
Profit/loss from business: +$8,370 (reported on 9.6% of returns)
Here:
+$8,370
State:
+$13,994
(% of AGI for various income ranges: 2.0% for AGIs below $10k, 3.7% for AGIs $10k-25k, 1.8% for AGIs $25k-50k, 1.7% for AGIs $50k-75k, 2.3% for AGIs $75k-100k, 5.1% for AGIs over 100k)
IRA payment deduction: $1,791 (reported on 1.3% of returns)
98405:
$1,791
Washington:
$3,001
Self-employed pension: $11,941 (reported on 0.2% of returns)
Here:
$11,941
Washington:
$14,244
Total itemized deductions: $14,496 (27% of AGI, reported on 27.9% of returns)
Here:
$14,496
State:
$19,669
Here:
26.5% of AGI
State:
20.7% of AGI
(% of AGI for various income ranges: 9.7% for AGIs below $10k, 8.3% for AGIs $10k-25k, 13.1% for AGIs $25k-50k, 15.6% for AGIs $50k-75k, 14.3% for AGIs $75k-100k, 10.9% for AGIs over 100k)
Charity contributions deductions: $2,159 (4% of AGI, reported on 22.9% of returns)
Here:
$2,159
State:
$3,569
Here:
3.8% of AGI
State:
3.5% of AGI
(% of AGI for various income ranges: 0.7% for AGIs below $10k, 0.9% for AGIs $10k-25k, 1.3% for AGIs $25k-50k, 2.1% for AGIs $50k-75k, 1.7% for AGIs $75k-100k, 2.2% for AGIs over 100k)
Total tax: $3,913 (reported on 69.2% of returns)
98405:
$3,913
State:
$9,065
(% of AGI for various income ranges: 2.0% for AGIs below $10k, 3.9% for AGIs $10k-25k, 6.8% for AGIs $25k-50k, 9.3% for AGIs $50k-75k, 11.0% for AGIs $75k-100k, 17.2% for AGIs over 100k)
Earned income credit: $1,762 (reported on 23.4% of returns)
Here:
$1,762
State:
$1,607
Percentage of individuals using paid preparers for their 2004 taxes: 51.4%
Here:
51%
State:
49%
(% for various income ranges: 50.3% for AGIs below $10k, 54.9% for AGIs $10k-25k, 49.3% for AGIs $25k-50k, 49.3% for AGIs $50k-75k, 49.0% for AGIs $75k-100k, 59.1% for AGIs over 100k)
Likely homosexual households (counted as self-reported same-sex unmarried-partner households)
Lesbian couples: 0.6% of all households
Gay men: 0.4% of all households
Household received Food Stamps/SNAP in the past 12 months: 2,138 Household did not receive Food Stamps/SNAP in the past 12 months: 8,522
Women who had a birth in the past 12 months: 277 (236 now married, 42 unmarried) Women who did not have a birth in the past 12 months: 6,165 (2,169 now married, 4,013 unmarried)
Housing units in zip code 98405 with a mortgage: 4,274 (612 second mortgage, 53 home equity loan, 341 both second mortgage and home equity loan) Houses without a mortgage: 81
Median monthly owner costs for units with a mortgage: $2,019 Median monthly owner costs for units without a mortgage: $771
Residents with income below the poverty level in 2022:
This zip code:
15.4%
Whole state:
10.0%
Residents with income below 50% of the poverty level in 2022:
This zip code:
9.3%
Whole state:
4.6%
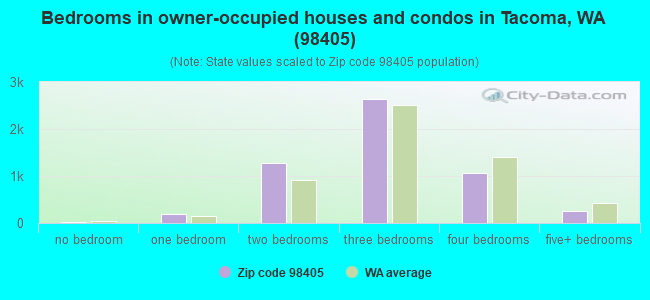
Median number of rooms in houses and condos:
Here:
6.0
State:
6.5
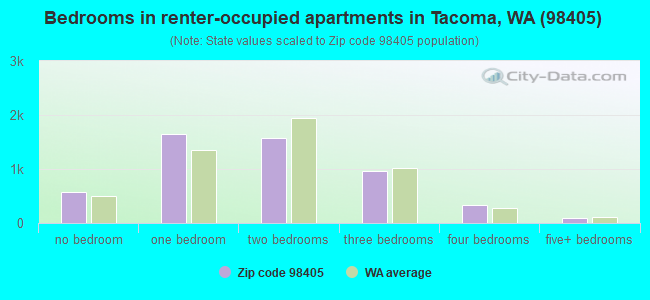
Median number of rooms in apartments:
Here:
3.9
State:
3.9
Notable locations in this zip code not listed on our city pages
Notable locations in zip code 98405: Allenmore Golf Club (A), University Place Center (B), Tacoma Center at Allenmore (C), Tacoma Stevens (D), Sixth Avenue Plaza (E), Park Rose Care Center Nursing Home (F), Tacoma Fire Department Station 4 (G), Karpeles Manuscript Library (H). Display/hide their locations on the map
Churches in zip code 98405 include: Mount Calvary Baptist Church (A), New Covenant Pentecostal Church (B), New Jerusalem Church of God (C), Saint Paul Baptist Church (D), Peace Lutheran Church (E), Prince Hall Masonic Temple (F), Saint Ritas Church (G), Saint John Baptist Church (H), Saint Leos Church (I). Display/hide their locations on the map
Tourist attractions (not listed on the city page) : Tacoma City - Community Libraries- Dr Martin Luther King Jr (Cultural Attractions- Events- & Facilities; 1902 South Cedar Street), Nature Center at Snake Lake (Nature Centers; 1919 South Tyler Street), The Metro Parks Tacoma - Facilities & Attractions- Tacoma Nature Ce (Nature Centers; Tacoma Nature Centre).
2,476 married couples with children.
1,061 single-parent households (425 men, 636 women).
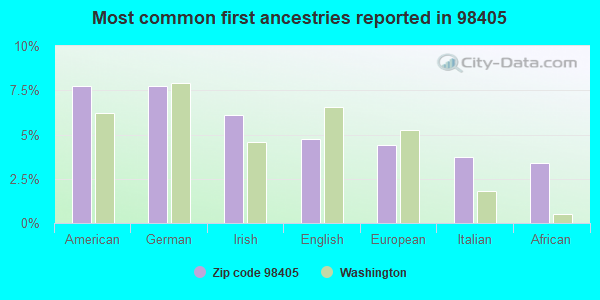
85.4% of residents of 98405 zip code speak English at home.
6.4% of residents speak Spanish at home (63% very well, 13% well, 7% not well, 17% not at all).
2.7% of residents speak other Indo-European language at home (72% very well, 18% well, 8% not well, 3% not at all).
4.4% of residents speak Asian or Pacific Island language at home (61% very well, 26% well, 10% not well, 3% not at all).
0.6% of residents speak other language at home (82% very well, 5% well, 13% not at all).
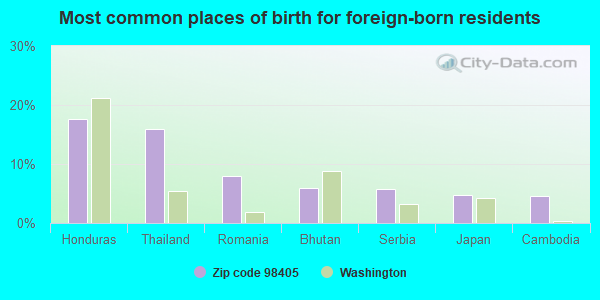
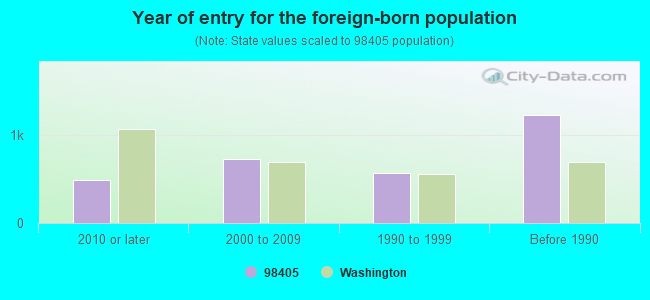
Foreign born population: 2,430 (9.9%) (58.4% of them are naturalized citizens)
Facilities with environmental interests located in this zip code:
7 ELEVEN STORE 19303 (1101 S 19TH ST in TACOMA, WA)
(Resource Conservation and Recovery Act (tracking hazardous waste)) STATE MASTER (Washington State Department of Ecology's Facility/Site identification system) - TOXICS-8622, UNDERGROUND STORAGE TANK PROGRAM, HAZWASTE-CRK000011940, EPCRA Business SIC classification: GROCERIES AND RELATED PRODUCTS; GASOLINE SERVICE STATIONS Alternative names: SPEED E MART
ALL AUTOMOTIVE & TRANSMISSION (2001 S 12TH ST in TACOMA, WA)
Conditionally Exempt Small Quantity Generators, less than 100 kg/month of hazardous waste (Resource Conservation and Recovery Act (tracking hazardous waste)) STATE MASTER (Washington State Department of Ecology's Facility/Site identification system) - TOXICS-101313, UNDERGROUND STORAGE TANK PROGRAM, HAZWASTE-WAD988493136, CESQG Business SIC classification: GENERAL AUTOMOTIVE REPAIR SHOPS Business NAICS classification: GENERAL AUTOMOTIVE REPAIR. Organizations: JIM SHARBONO (CONTACT/OPERATOR)
, SHAR ENT (CONTACT/OWNER)
Alternative names: CERTIFIED AUTO INC
ARCO 5299 (1101 S SPRAGUE AVE in TACOMA, WA)
(Resource Conservation and Recovery Act (tracking hazardous waste)) STATE MASTER (Washington State Department of Ecology's Facility/Site identification system) - TOXICS-97534, UNDERGROUND STORAGE TANK PROGRAM, HAZWASTE-WAD988514857, EPCRA, HAZARDOUS WASTE PROGRAM Business SIC classification: GASOLINE SERVICE STATIONS Organizations: BP WEST COAST PRODUCTS (CONTACT/OPERATOR)
Alternative names: ARCO 05299
CHEVRON 93914 (4401 S 19TH ST in TACOMA, WA)
(Resource Conservation and Recovery Act (tracking hazardous waste)) STATE MASTER (Washington State Department of Ecology's Facility/Site identification system) - HAZWASTE-WAD988485652, HAZARDOUS WASTE PROGRAM, TOXICS-5152, LEAKING STORAGE TANK, UNDERGROUND STORAGE TANK PROGRAM, HAZWASTE-WAD988485652, EPCRA Business SIC classification: GASOLINE SERVICE STATIONS Organizations: LAWRENCE DANBERG (CONTACT/OPERATOR)
Alternative names: LARRYS CHEVRON TACOMA
ARCO 1128 PSI 5529 (1201 S UNION in TACOMA, WA)
(Resource Conservation and Recovery Act (tracking hazardous waste)) STATE MASTER (Washington State Department of Ecology's Facility/Site identification system) - TOXICS-8744, LEAKING STORAGE TANK, UNDERGROUND STORAGE TANK PROGRAM, TOXICS-, VOLUNTARY CLEAN UP PROGRAM, HAZWASTE-WAD988484895, EPCRA, TOXICS-SW0255, VOLUNTARY CLEAN UP PROGRAM Business SIC classification: GASOLINE SERVICE STATIONS Alternative names: ARCO 01128
1218 SPRAGUE DRUG SITE (1218 SPRAGUE in TACOMA, WA)
Small Quantity Generators, between 100 kg and 1000 kg of hazardous waste/month (Resource Conservation and Recovery Act (tracking hazardous waste)) STATE MASTER (Washington State Department of Ecology's Facility/Site identification system) - HAZWASTE-WAH000020909, SQG Organizations: WA ECY (CONTACT/OPERATOR)
3007 S 12TH WASTE SITE (3007 S 12TH ST S in TACOMA, WA)
Small Quantity Generators, between 100 kg and 1000 kg of hazardous waste/month (Resource Conservation and Recovery Act (tracking hazardous waste)) STATE MASTER (Washington State Department of Ecology's Facility/Site identification system) - HAZWASTE-WAH000022334, SQG Organizations: WA ECY (CONTACT/OPERATOR)
ARCO 5485 (1901 S M L KING JR WAY in TACOMA, WA)
Conditionally Exempt Small Quantity Generators, less than 100 kg/month of hazardous waste (Resource Conservation and Recovery Act (tracking hazardous waste)) STATE MASTER (Washington State Department of Ecology's Facility/Site identification system) - HAZWASTE-WAD988514980, EPCRA, CESQG Business SIC classification: GASOLINE SERVICE STATIONS Alternative names: ARCO 05485
ALTERNATIVE SPCL NEEDS DIV OCC (601 S 8TH in TACOMA, WA)
(National Center for Education Statistics) - STATE ID-1514 Organizations: TACOMA SCH DIST 10 (SCHOOL DISTRICT)
BRYANT (717 S GRANT in TACOMA, WA)
(National Center for Education Statistics) - STATE ID-3397 Organizations: TACOMA SCH DIST 10 (SCHOOL DISTRICT)
COMM BASED TRANS PRO (601 SO 8TH in TACOMA, WA)
(National Center for Education Statistics) - STATE ID-1585 Organizations: TACOMA SCH DIST 10 (SCHOOL DISTRICT)
BRYAN ASSAY OFFICE (901 S 9TH ST in TACOMA, WA)
(Resource Conservation and Recovery Act (tracking hazardous waste))
CLEANERY TACOMA STEVENS (4505 S 19TH STE A in TACOMA, WA)
(Resource Conservation and Recovery Act (tracking hazardous waste)) Organizations: JOHN JOHNSON (CONTACT/OPERATOR)
, EARL ECKSTROM & ASSOCIATES INC (CONTACT/OWNER)
Housing units lacking complete plumbing facilities: 1.4% Housing units lacking complete kitchen facilities: 2.7%
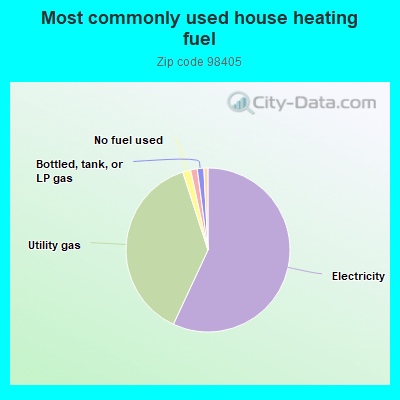
57.0%Electricity
38.1%Utility gas
1.6%No fuel used
1.3%Fuel oil, kerosene, etc.
1.3%Bottled, tank, or LP gas
Population in 1990: 23,918.
Place of birth for U.S.-born residents:
This state: 11,112
Northeast: 1,199
Midwest: 1,775
South: 3,014
West: 4,271
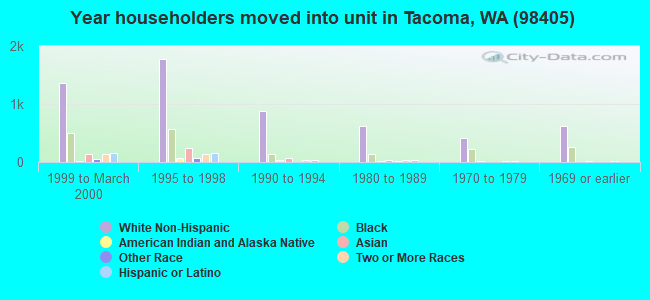
49% of the 98405 zip code residents lived in the same house 5 years ago. Out of people who lived in different houses, 71% lived in this county. Out of people who lived in different counties, 50% lived in Washington.
85% of the 98405 zip code residents lived in the same house 1 year ago. Out of people who lived in different houses, 46% moved from this county. Out of people who lived in different houses, 32% moved from different county within same state. Out of people who lived in different houses, 19% moved from different state. Out of people who lived in different houses, 3% moved from abroad.
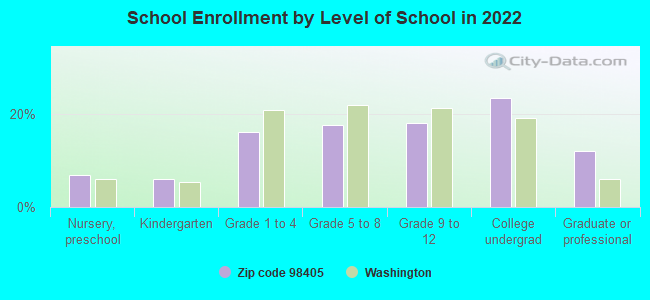
Private vs. public school enrollment:
Students in private schools in grades 1 to 8 (elementary and middle school): 231
Here:
13.7%
Washington:
12.4%
Students in private schools in grades 9 to 12 (high school): 32
Here:
3.6%
Washington:
9.2%
Students in private undergraduate colleges: 236
Here:
20.0%
Washington:
16.5%
Occupation by median earnings in the past 12 months ($)
81,403Life, physical, and social science occupations
77,898Business and financial operations occupations
77,373Architecture and engineering occupations
76,112Law enforcement workers including supervisors
73,905Legal occupations
70,998Computer and mathematical occupations
Companies with biggest federal contracts located in this zip code (TACOMA, WA):
AVALON CONTRACTING INC (3215 S 12TH ST; small business) : $1,425,506 in 27 contractsfrom 2000 to 2006
Contracts for Technical Representation Services -- Alarm, Signal, and Security Detection Systems, Maintenance, Repair and Rebuilding of Equipment -- Weapons, Maintenance, Repair and Rebuilding of Equipment -- Construction and Building Materials, Maintenance, Repair or Alteration of Real Property -- Miscellaneous Buildings, and moreby Army, Navy Signed by year:2000: $539,616; 2001: $209,137; 2002: $403,409; 2003: $54,409; 2004: $115,179; 2005: $53,860; 2006: $49,896.
Biggest contracts:
$449,352 with Army for Technical Representation Services -- Alarm, Signal, and Security Detection Systems. Signed on 2000-03-31. Completion date: 2001-04-02.
$239,871 with Army for Maintenance, Repair and Rebuilding of Equipment -- Weapons. Signed on 2002-04-08. Completion date: 2002-09-30.
$209,137, same as above.Signed on 2001-08-06. Completion date: 2002-09-30.
$100,420 with Army for Maintenance, Repair and Rebuilding of Equipment -- Construction and Building Materials. Signed on 2002-08-23. Completion date: 2002-11-29.
TACOMA-PIERCE COUNTY BLOOD BAN (220 SOUTH I ST) : $345,880 in 7 contractsfrom 2002 to 2006
Contracts for Blood, Blood Derivatives, Laboratory Equipment and Supplies, Medical and Surgical Instruments, Equipment, and Supplies by Army Signed by year:2000: $0; 2001: $0; 2002: $3,880; 2003: $85,000; 2004: $120,000; 2005: $0; 2006: $137,000.
Biggest contracts:
$160,000 with Army for Blood. Signed on 2006-02-28. Completion date: 2006-09-30.
$120,000 with Army for Blood Derivatives. Signed on 2004-10-06. Completion date: 2005-09-30.
$85,000 with Army for Laboratory Equipment and Supplies. Signed on 2003-10-23. Completion date: 2004-09-30.
$3,880 with Army for Medical and Surgical Instruments, Equipment, and Supplies. Signed on 2002-10-31. Completion date: 2002-10-30.
COMMUNITY & TECHNICAL COLLEGES (1101 YAKIMA AVE) : $230,661 in 6 contractsfrom 2003 to 2005
Contracts for Faculty Salaries for Dependent Schools, Education Services by Army Signed by year:2000: $0; 2001: $0; 2002: $0; 2003: $68,037; 2004: $67,090; 2005: $95,534; 2006: $0.
Biggest contracts:
$79,576 with Army for Faculty Salaries for Dependent Schools. Signed on 2003-02-11. Completion date: 2004-02-18.
$71,168 with Army for Education Services. Signed on 2005-06-23. Completion date: 2006-10-31.
$67,090 with Army for Faculty Salaries for Dependent Schools. Signed on 2004-03-16. Completion date: 2005-03-07.
$18,671 with Army for Education Services. Signed on 2005-03-28. Completion date: 2005-06-30.
LINEN RENTAL SUPPLY, INC (2902 S 12TH ST; small business) : $100,374 in 8 contractsfrom 2001 to 2005
Contracts for Laundry and DryCleaning Services by Navy, Army Signed by year:2000: $0; 2001: $50,664; 2002: $0; 2003: $0; 2004: $30,410; 2005: $19,300; 2006: $0.
Biggest contracts:
$50,664 with Navy for Laundry and DryCleaning Services. Signed on 2001-06-27. Completion date: 2001-07-02.
$19,210, same as above.Signed on 2004-10-21. Completion date: 2005-09-30.
$12,000, same as above.Signed on 2005-09-30. Completion date: 2005-09-30.
$7,500, same as above.Signed on 2004-10-07. Completion date: 2005-09-30.
GERVAIS, INC (4001 S 12TH ST; small business) : $85,868 in 3 contractsfrom 2005 to 2006
$80,000 with Air Force for Other Housekeeping Services. Signed on 2005-07-11. Completion date: 2005-07-07.
$5,018, same as above.Signed on 2006-06-26. Completion date: 2006-07-03.
$850, same as above.Signed on 2006-06-28. Completion date: 2006-07-03.
ELLIOTT SALES LLC, A DIVISION (2502 S 12TH ST; small business) : $35,562 in 4 contractsfrom 2004 to 2006
$20,875 with Army for Miscellaneous Items. Signed on 2005-08-04. Completion date: 2005-10-05.
$7,452 with Army for Signs, Advertising Displays, and Identification Plates. Signed on 2006-01-20. Completion date: 2006-01-23.
$3,860 with Army for Miscellaneous Printed Matter. Signed on 2004-08-28. Completion date: 2004-02-23.
$3,375 with Army for Collectors. and/or Historical Items. Signed on 2004-09-30. Completion date: 2004-10-01.
TACOMA TOFU INC (1302 MARTIN LUTHER KING JR; small business) : $28,090 in 6 contractsfrom 2004 to 2006
Contracts for Food Items For Resale, Non-Food Items For Resale by Defense Commissary Agency Signed by year:2000: $0; 2001: $0; 2002: $0; 2003: $0; 2004: $5,987; 2005: $16,725; 2006: $5,378.
Biggest contracts:
$8,336 with Defense Commissary Agency for Food Items For Resale. Signed on 2005-04-01. Completion date: 2005-08-31.
$5,987, same as above.Signed on 2004-10-01. Completion date: 2005-02-28.
$5,378 with Defense Commissary Agency for Non-Food Items For Resale. Signed on 2006-01-01. Completion date: 2006-03-31.
$3,548, same as above.Signed on 2005-10-01. Completion date: 2005-12-31.
MULTICARE HEALTH SYSTEM (315 MARTIN LUTHER KING JR; small business)
$28,000 with Army for Laboratory Equipment and Supplies. Signed on 2002-11-07. Completion date: 2003-09-30.
MOSAIC YOUTH MINISTRIES (4016 S 7TH ST; small business) : $24,760 in 7 contractsfrom 2004 to 2005
Contracts for Chaplain Services by Army Signed by year:2000: $0; 2001: $0; 2002: $0; 2003: $0; 2004: $24,760; 2005: $0; 2006: $0.
Biggest contracts:
$25,940 with Army for Chaplain Services. Signed on 2005-03-31. Completion date: 2006-02-28.
$22,850, same as above.Signed on 2004-10-21. Completion date: 2005-01-04.
$21,090, same as above.Signed on 2004-01-28. Completion date: 2004-09-30.
$6,760, same as above.Signed on 2004-10-25. Completion date: 2005-01-04.
JONES, GALE D (2913 S 12TH ST; small business)
$9,000 with Army for Musical Instruments. Signed on 2003-03-03. Completion date: 2003-03-14.
Top industries in this zip code by the number of employees in 2005:
Health Care and Social Assistance: Offices of Physicians (except Mental Health Specialists) (250-499 employees: 2 establishments, 100-249 employees: 3 establishments, 50-99 employees: 2 establishments, 20-49 employees: 14 establishments, 10-19 employees: 26 establishments, 5-9 employees: 34 establishments, 1-4 employees: 70 establishments)
Health Care and Social Assistance: General Medical and Surgical Hospitals (over 1000: 1, 250-499: 1)
Other Services (except Public Administration): Religious Organizations (100-249: 1, 20-49: 4, 10-19: 3, 5-9: 9, 1-4: 11)
Health Care and Social Assistance: Offices of Dentists (20-49: 3, 10-19: 9, 5-9: 24, 1-4: 12)
Health Care and Social Assistance: HMO Medical Centers (250-499: 1)
Health Care and Social Assistance: Other Individual and Family Services (100-249: 1, 20-49: 1, 5-9: 4, 1-4: 2)
Professional, Scientific, and Technical Services: Offices of Lawyers (20-49: 1, 10-19: 4, 5-9: 6, 1-4: 36)
Educational Services: Colleges, Universities, and Professional Schools (100-249: 1, 1-4: 1)
Health Care and Social Assistance: Nursing Care Facilities (100-249: 1)
People in group quarters in 2010:
371 people in other noninstitutional facilities
296 people in nursing facilities/skilled-nursing facilities
132 people in emergency and transitional shelters (with sleeping facilities) for people experiencing homelessness
117 people in group homes intended for adults
26 people in residential treatment centers for adults
23 people in correctional residential facilities
3 people in group homes for juveniles (non-correctional)
People in group quarters in 2000:
249 people in other noninstitutional group quarters
120 people in nursing homes
118 people in wards in general hospitals for patients who have no usual home elsewhere
79 people in other group homes
48 people in homes for the mentally ill
47 people in hospitals/wards and hospices for chronically ill
47 people in other hospitals or wards for chronically ill
27 people in homes or halfway houses for drug/alcohol abuse
20 people in halfway houses
15 people in institutions for the deaf
14 people in orthopedic wards and institutions for the physically handicapped
6 people in college dormitories (includes college quarters off campus)
Fatal accident statistics in 2014:
Fatal accident count: 1
Vehicles involved in fatal accidents: 2
Fatal accidents caused by drunken drivers: 0
Fatalities: 1
Persons involved in fatal accidents: 4
Pedestrians involved in fatal accidents: 0
Fatal accident statistics in 2011:
Fatal accident count: 3
Vehicles involved in fatal accidents: 5
Fatal accidents caused by drunken drivers: 2
Fatalities: 3
Persons involved in fatal accidents: 6
Pedestrians involved in fatal accidents: 0
Home Mortgage Disclosure Act Aggregated Statistics For Year 2009 (Based on 6 full and 6 partial tracts)
A) FHA, FSA/RHS & VA Home Purchase Loans
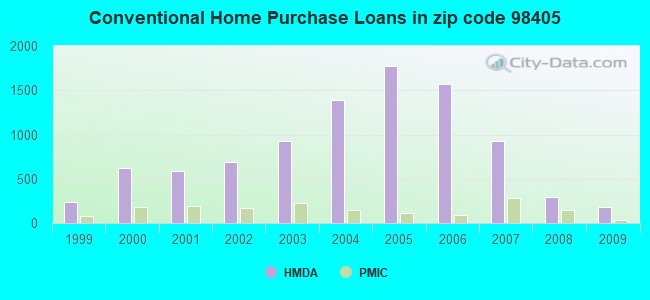
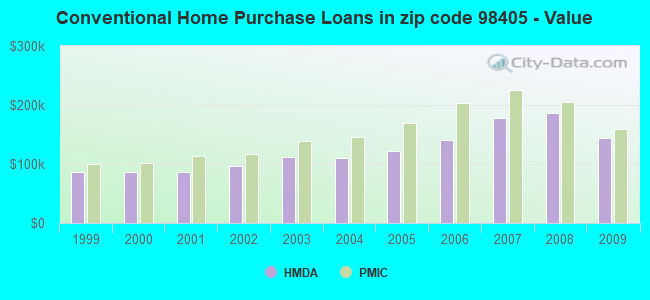
B) Conventional Home Purchase Loans
C) Refinancings
D) Home Improvement Loans
E) Loans on Dwellings For 5+ Families
F) Non-occupant Loans on < 5 Family Dwellings (A B C & D)
Number
Average Value
Number
Average Value
Number
Average Value
Number
Average Value
Number
Average Value
Number
Average Value
LOANS ORIGINATED
309
$184,083
179
$144,305
869
$182,106
39
$100,965
11
$1,703,794
152
$148,898
APPLICATIONS APPROVED, NOT ACCEPTED
35
$181,223
12
$164,791
145
$170,272
13
$69,113
2
$427,300
13
$129,910
APPLICATIONS DENIED
52
$168,096
35
$145,865
434
$182,779
33
$66,238
3
$796,557
81
$143,084
APPLICATIONS WITHDRAWN
64
$188,035
34
$124,896
286
$186,998
16
$114,306
1
$181,220
44
$150,386
FILES CLOSED FOR INCOMPLETENESS
2
$69,825
4
$182,312
70
$181,655
4
$70,915
2
$427,300
14
$128,788
Aggregated Statistics For Year 2008 (Based on 6 full and 6 partial tracts)
A) FHA, FSA/RHS & VA Home Purchase Loans
B) Conventional Home Purchase Loans
C) Refinancings
D) Home Improvement Loans
E) Loans on Dwellings For 5+ Families
F) Non-occupant Loans on < 5 Family Dwellings (A B C & D)
G) Loans On Manufactured Home Dwelling (A B C & D)
Number
Average Value
Number
Average Value
Number
Average Value
Number
Average Value
Number
Average Value
Number
Average Value
Number
Average Value
LOANS ORIGINATED
233
$213,073
296
$185,791
728
$188,544
88
$100,731
23
$1,883,526
179
$159,917
0
$0
APPLICATIONS APPROVED, NOT ACCEPTED
18
$195,971
61
$193,321
125
$186,072
25
$98,117
0
$0
41
$186,213
2
$57,140
APPLICATIONS DENIED
48
$214,186
112
$216,689
707
$196,984
151
$99,738
5
$1,013,028
118
$190,331
4
$146,470
APPLICATIONS WITHDRAWN
36
$235,996
50
$194,189
255
$187,145
22
$165,895
8
$4,026,904
30
$176,796
0
$0
FILES CLOSED FOR INCOMPLETENESS
3
$150,353
10
$254,094
79
$215,022
7
$31,369
0
$0
23
$227,922
0
$0
Aggregated Statistics For Year 2007 (Based on 6 full and 6 partial tracts)
A) FHA, FSA/RHS & VA Home Purchase Loans
B) Conventional Home Purchase Loans
C) Refinancings
D) Home Improvement Loans
E) Loans on Dwellings For 5+ Families
F) Non-occupant Loans on < 5 Family Dwellings (A B C & D)
G) Loans On Manufactured Home Dwelling (A B C & D)
Number
Average Value
Number
Average Value
Number
Average Value
Number
Average Value
Number
Average Value
Number
Average Value
Number
Average Value
LOANS ORIGINATED
47
$219,344
924
$178,461
1,363
$179,599
186
$92,423
26
$5,735,760
475
$173,815
0
$0
APPLICATIONS APPROVED, NOT ACCEPTED
5
$248,992
182
$183,334
257
$185,002
30
$125,605
1
$378,670
85
$202,491
0
$0
APPLICATIONS DENIED
15
$278,566
359
$179,936
891
$192,415
148
$91,517
2
$440,600
252
$190,207
8
$108,018
APPLICATIONS WITHDRAWN
13
$281,143
151
$159,286
389
$181,790
36
$106,483
0
$0
114
$163,151
0
$0
FILES CLOSED FOR INCOMPLETENESS
0
$0
24
$194,540
121
$205,524
7
$136,870
0
$0
28
$216,587
0
$0
Aggregated Statistics For Year 2006 (Based on 6 full and 6 partial tracts)
A) FHA, FSA/RHS & VA Home Purchase Loans
B) Conventional Home Purchase Loans
C) Refinancings
D) Home Improvement Loans
E) Loans on Dwellings For 5+ Families
F) Non-occupant Loans on < 5 Family Dwellings (A B C & D)
G) Loans On Manufactured Home Dwelling (A B C & D)
Number
Average Value
Number
Average Value
Number
Average Value
Number
Average Value
Number
Average Value
Number
Average Value
Number
Average Value
LOANS ORIGINATED
43
$203,034
1,574
$141,379
1,598
$159,807
197
$117,665
27
$862,785
726
$150,506
0
$0
APPLICATIONS APPROVED, NOT ACCEPTED
7
$212,129
261
$142,387
296
$158,437
27
$152,812
2
$246,300
124
$165,521
0
$0
APPLICATIONS DENIED
9
$213,944
477
$149,836
869
$161,996
183
$91,159
2
$352,480
247
$163,084
2
$14,735
APPLICATIONS WITHDRAWN
8
$181,598
245
$163,359
656
$161,350
61
$137,608
0
$0
119
$150,670
0
$0
FILES CLOSED FOR INCOMPLETENESS
0
$0
53
$132,002
150
$175,697
7
$56,761
0
$0
25
$140,095
0
$0
Aggregated Statistics For Year 2005 (Based on 6 full and 6 partial tracts)
A) FHA, FSA/RHS & VA Home Purchase Loans
B) Conventional Home Purchase Loans
C) Refinancings
D) Home Improvement Loans
E) Loans on Dwellings For 5+ Families
F) Non-occupant Loans on < 5 Family Dwellings (A B C & D)
G) Loans On Manufactured Home Dwelling (A B C & D)
Number
Average Value
Number
Average Value
Number
Average Value
Number
Average Value
Number
Average Value
Number
Average Value
Number
Average Value
LOANS ORIGINATED
42
$178,449
1,769
$122,176
1,800
$137,089
163
$72,059
16
$1,273,476
829
$130,659
4
$157,940
APPLICATIONS APPROVED, NOT ACCEPTED
5
$195,936
231
$131,013
289
$129,281
52
$76,904
6
$471,008
101
$128,479
4
$77,105
APPLICATIONS DENIED
12
$158,884
513
$133,010
1,065
$137,316
192
$69,020
0
$0
250
$133,796
9
$69,683
APPLICATIONS WITHDRAWN
5
$148,038
321
$127,370
752
$141,965
88
$98,720
2
$481,325
156
$136,386
0
$0
FILES CLOSED FOR INCOMPLETENESS
2
$222,000
52
$108,611
191
$142,442
4
$70,820
0
$0
23
$124,551
0
$0
Aggregated Statistics For Year 2004 (Based on 6 full and 6 partial tracts)
A) FHA, FSA/RHS & VA Home Purchase Loans
B) Conventional Home Purchase Loans
C) Refinancings
D) Home Improvement Loans
E) Loans on Dwellings For 5+ Families
F) Non-occupant Loans on < 5 Family Dwellings (A B C & D)
G) Loans On Manufactured Home Dwelling (A B C & D)
Number
Average Value
Number
Average Value
Number
Average Value
Number
Average Value
Number
Average Value
Number
Average Value
Number
Average Value
LOANS ORIGINATED
117
$155,125
1,390
$109,665
1,697
$117,323
141
$78,980
20
$444,708
661
$109,724
4
$103,365
APPLICATIONS APPROVED, NOT ACCEPTED
12
$158,258
224
$111,523
383
$128,911
26
$62,662
4
$270,048
134
$119,234
0
$0
APPLICATIONS DENIED
23
$131,746
364
$106,617
1,111
$121,628
148
$68,982
2
$453,470
168
$130,014
4
$129,650
APPLICATIONS WITHDRAWN
18
$127,346
188
$122,960
588
$123,977
42
$68,614
0
$0
104
$100,712
3
$143,733
FILES CLOSED FOR INCOMPLETENESS
2
$137,520
19
$96,567
224
$140,725
4
$50,640
0
$0
18
$170,382
0
$0
Aggregated Statistics For Year 2003 (Based on 6 full and 6 partial tracts)
A) FHA, FSA/RHS & VA Home Purchase Loans
B) Conventional Home Purchase Loans
C) Refinancings
D) Home Improvement Loans
E) Loans on Dwellings For 5+ Families
F) Non-occupant Loans on < 5 Family Dwellings (A B C & D)
Number
Average Value
Number
Average Value
Number
Average Value
Number
Average Value
Number
Average Value
Number
Average Value
LOANS ORIGINATED
176
$135,270
922
$111,477
2,661
$108,985
123
$32,180
28
$821,949
725
$97,421
APPLICATIONS APPROVED, NOT ACCEPTED
22
$127,738
174
$104,840
372
$114,457
37
$33,529
0
$0
102
$99,786
APPLICATIONS DENIED
39
$150,635
227
$101,279
912
$112,210
152
$26,641
5
$323,172
186
$113,860
APPLICATIONS WITHDRAWN
32
$161,903
150
$103,394
741
$123,221
14
$31,574
7
$410,993
101
$113,623
FILES CLOSED FOR INCOMPLETENESS
5
$141,274
26
$122,746
99
$116,033
2
$6,875
0
$0
22
$109,977
Aggregated Statistics For Year 2002 (Based on 6 full and 6 partial tracts)
A) FHA, FSA/RHS & VA Home Purchase Loans
B) Conventional Home Purchase Loans
C) Refinancings
D) Home Improvement Loans
E) Loans on Dwellings For 5+ Families
F) Non-occupant Loans on < 5 Family Dwellings (A B C & D)
Number
Average Value
Number
Average Value
Number
Average Value
Number
Average Value
Number
Average Value
Number
Average Value
LOANS ORIGINATED
221
$120,386
685
$96,862
1,696
$101,298
117
$25,037
15
$882,435
456
$90,784
APPLICATIONS APPROVED, NOT ACCEPTED
22
$110,129
92
$90,501
302
$98,911
46
$23,223
5
$212,094
65
$83,532
APPLICATIONS DENIED
35
$120,901
155
$87,979
765
$101,811
98
$15,428
4
$268,468
114
$92,198
APPLICATIONS WITHDRAWN
28
$115,763
82
$94,535
475
$107,135
26
$46,373
0
$0
73
$95,231
FILES CLOSED FOR INCOMPLETENESS
2
$101,930
28
$104,681
145
$103,605
0
$0
0
$0
23
$89,723
Aggregated Statistics For Year 2001 (Based on 6 full and 6 partial tracts)
A) FHA, FSA/RHS & VA Home Purchase Loans
B) Conventional Home Purchase Loans
C) Refinancings
D) Home Improvement Loans
E) Loans on Dwellings For 5+ Families
F) Non-occupant Loans on < 5 Family Dwellings (A B C & D)
Number
Average Value
Number
Average Value
Number
Average Value
Number
Average Value
Number
Average Value
Number
Average Value
LOANS ORIGINATED
302
$115,766
592
$87,230
1,461
$98,280
109
$23,089
21
$447,359
342
$83,011
APPLICATIONS APPROVED, NOT ACCEPTED
21
$105,556
118
$90,213
217
$89,371
36
$19,636
2
$151,720
73
$85,078
APPLICATIONS DENIED
18
$99,323
176
$82,619
736
$91,924
207
$16,597
2
$24,560
77
$88,955
APPLICATIONS WITHDRAWN
30
$112,542
116
$90,965
499
$105,336
34
$27,885
0
$0
54
$78,332
FILES CLOSED FOR INCOMPLETENESS
8
$99,360
26
$85,118
146
$100,945
11
$8,464
0
$0
11
$118,570
Aggregated Statistics For Year 2000 (Based on 6 full and 6 partial tracts)
A) FHA, FSA/RHS & VA Home Purchase Loans
B) Conventional Home Purchase Loans
C) Refinancings
D) Home Improvement Loans
E) Loans on Dwellings For 5+ Families
F) Non-occupant Loans on < 5 Family Dwellings (A B C & D)
Number
Average Value
Number
Average Value
Number
Average Value
Number
Average Value
Number
Average Value
Number
Average Value
LOANS ORIGINATED
216
$103,822
620
$85,886
609
$81,023
137
$21,642
23
$537,560
236
$73,801
APPLICATIONS APPROVED, NOT ACCEPTED
12
$91,678
176
$88,174
184
$77,424
42
$19,835
2
$146,795
62
$95,454
APPLICATIONS DENIED
42
$104,975
345
$72,178
470
$79,281
186
$24,366
8
$171,805
129
$71,023
APPLICATIONS WITHDRAWN
43
$104,405
142
$79,861
257
$77,943
31
$48,976
0
$0
62
$76,653
FILES CLOSED FOR INCOMPLETENESS
2
$55,380
16
$91,335
146
$93,635
2
$44,205
0
$0
17
$59,701
Aggregated Statistics For Year 1999 (Based on 2 full and 4 partial tracts)
A) FHA, FSA/RHS & VA Home Purchase Loans
B) Conventional Home Purchase Loans
C) Refinancings
D) Home Improvement Loans
E) Loans on Dwellings For 5+ Families
F) Non-occupant Loans on < 5 Family Dwellings (A B C & D)
2002 - 2018 National Fire Incident Reporting System (NFIRS) incidents
According to the data from the years 2002 - 2018 the average number of fire incidents per year is 128. The highest number of reported fires - 238 took place in 2002, and the least - 63 in 2013. The data has a declining trend.
When looking into fire subcategories, the most incidents belonged to: Outside Fires (59.8%), and Structure Fires (26.8%).
Fire incident types reported to NFIRS in Zip Code 98405


 Nearest zip codes: 98416, 98403, 98402, 98418, 98409, 98406.
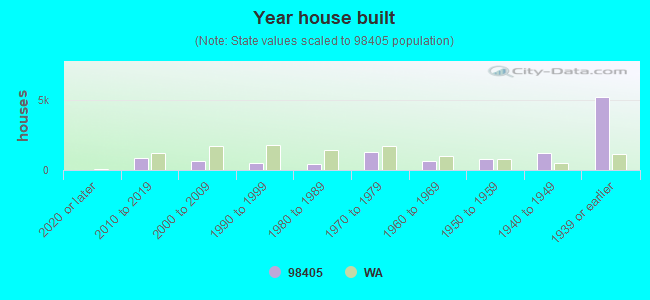


 According to the data from the years 2002 - 2018 the average number of fire incidents per year is 128. The highest number of reported fires - 238 took place in 2002, and the least - 63 in 2013. The data has a declining trend.
 When looking into fire subcategories, the most incidents belonged to: Outside Fires (59.8%), and Structure Fires (26.8%).