6th Avenue neighborhood in Tacoma, Washington (WA), 98405, 98406 detailed profile
Settings
X

Business Search - 14 Million verified businesses
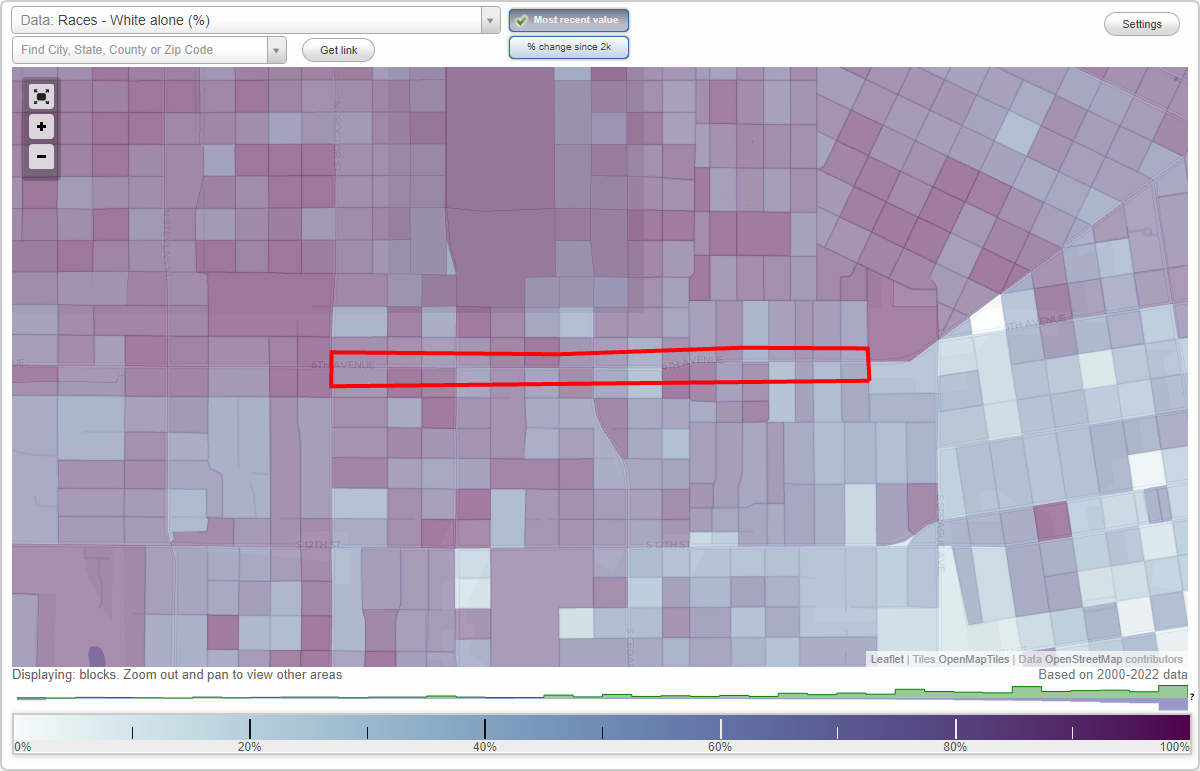
Area: 0.070 square miles
Population: 666
Population density:
| 6th Avenue: | 9,495 people per square mile |
| Tacoma: | 4,429 people per square mile |

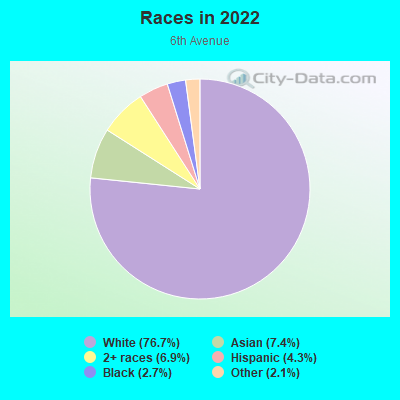
- 52176.7%White
- 507.4%Asian
- 476.9%Two or more races
- 294.3%Hispanic or Latino
- 182.7%Black
- 142.1%Some other race
Median household income in 2022:
| 6th Avenue: | $106,156 |
| Tacoma: | $80,784 |
Distribution of median household income
![Distribution of median household income]()
- 5Less than $10,000
- 29$10,000 to $19,999
- 34$20,000 to $29,999
- 37$30,000 to $39,999
- 23$40,000 to $49,999
- 33$50,000 to $59,999
- 11$60,000 to $74,999
- 34$75,000 to $99,999
- 32$100,000 to $124,999
- 24$125,000 to $149,999
- 52$150,000 to $199,999
- 41$200,000 or more

Distribution of owner-occupied house/condo value
![Distribution of owner-occupied house/condo value]()
- 2Less than $50,000
- 1$50,000 to $99,999
- 8$100,000 to $149,999
- 12$150,000 to $199,999
- 15$200,000 to $249,999
- 14$250,000 to $299,999
- 48$300,000 to $399,999
- 64$400,000 to $499,999
- 62$500,000 to $749,999
- 8$750,000 to $999,999
- 19$1,000,000 or more

Distribution of rent paid by renters
![Distribution of rent paid by renters]()
- 5$100 to $199
- 15$200 to $299
- 13$300 to $399
- 1$400 to $499
- 2$500 to $599
- 6$600 to $699
- 2$700 to $799
- 15$800 to $899
- 10$900 to $999
- 17$1,000 to $1,249
- 29$1,250 to $1,499
- 28$1,500 to $1,999
- 25$2,000 or more

Median rent in 2022:
| 6th Avenue: | $1,523 |
| Tacoma: | $1,426 |
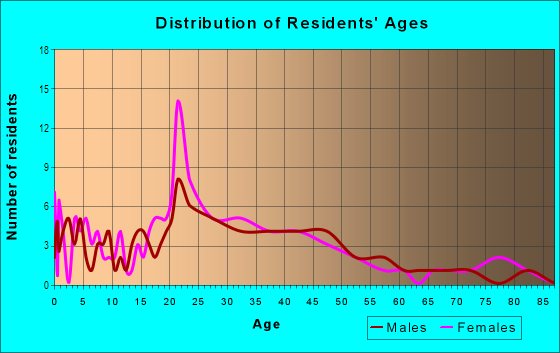
| Males: | 304 |
| Females: | 361 |
Males:
| This neighborhood: | 38.4 years |
| Whole city: | 36.0 years |
| This neighborhood: | 37.3 years |
| Whole city: | 38.1 years |
Average household size:
| 6th Avenue: | 2.4 people |
| Tacoma: | 2.4 people |
Percentage of family households:
| 6th Avenue: | 50.8% |
| Tacoma: | 43.7% |
| Here: | 59.6% |
| Tacoma: | 39.9% |
Percentage of married-couple families with children (among all households):
| 6th Avenue: | 37.7% |
| Tacoma: | 27.8% |
Percentage of single-mother households (among all households):
| 6th Avenue: | 4.7% |
| Tacoma: | 8.6% |
Percentage of never married males 15 years old and over:
Percentage of never married females 15 years old and over:
| 6th Avenue: | 15.5% |
| Tacoma: | 20.8% |
Percentage of never married females 15 years old and over:
| 6th Avenue: | 16.7% |
| city: | 17.5% |
Percentage of people that speak English not well or not at all:
| 6th Avenue: | 0.0% |
| Tacoma: | 3.1% |
Percentage of people born in this state:
Percentage of people born in another U.S. state:
Percentage of native residents but born outside the U.S.:
Percentage of foreign born residents:
| Here: | 43.3% |
| Tacoma: | 48.7% |
Percentage of people born in another U.S. state:
| 6th Avenue: | 47.2% |
| Tacoma: | 37.0% |
Percentage of native residents but born outside the U.S.:
| Here: | 2.5% |
| city: | 2.4% |
Percentage of foreign born residents:
| Here: | 7.0% |
| Tacoma: | 12.0% |
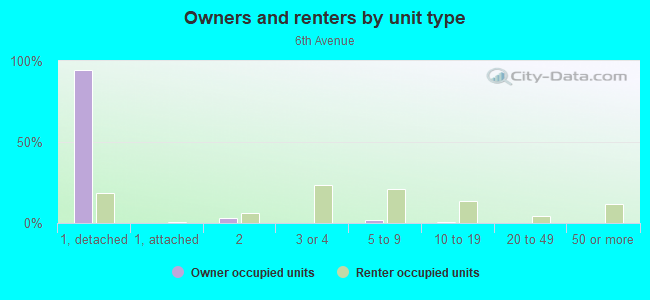
Owner-occupied
Renter-occupied

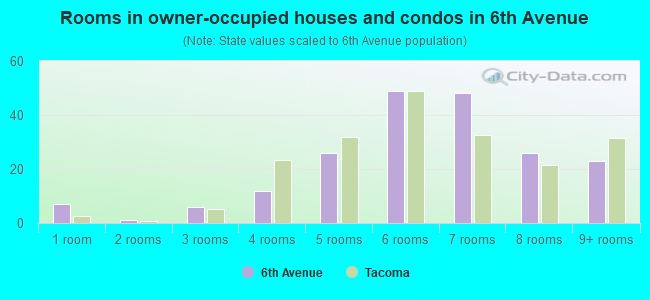
- Rooms in owner-occupied houses and condos in 6th Avenue
- 71 room
- 12 rooms
- 63 rooms
- 124 rooms
- 265 rooms
- 496 rooms
- 487 rooms
- 268 rooms
- 239+ rooms
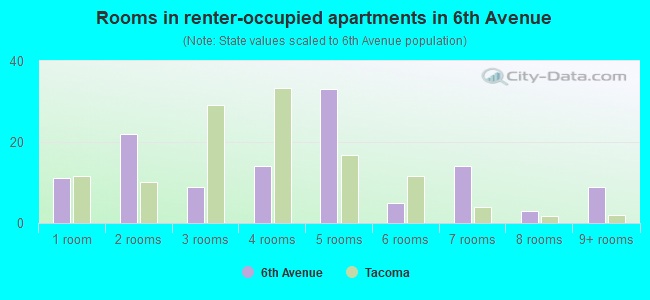
- Rooms in renter-occupied apartments in 6th Avenue
- 111 room
- 222 rooms
- 93 rooms
- 144 rooms
- 335 rooms
- 56 rooms
- 147 rooms
- 38 rooms
- 99+ rooms
Owner-occupied
Renter-occupied
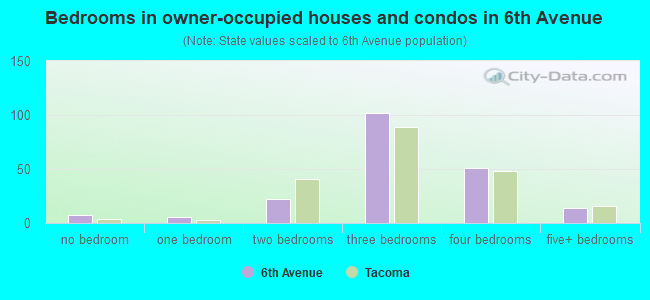
- Bedrooms in owner-occupied houses and condos in 6th Avenue
- 7no bedroom
- 61 bedroom
- 222 bedrooms
- 1023 bedrooms
- 514 bedrooms
- 145+ bedrooms
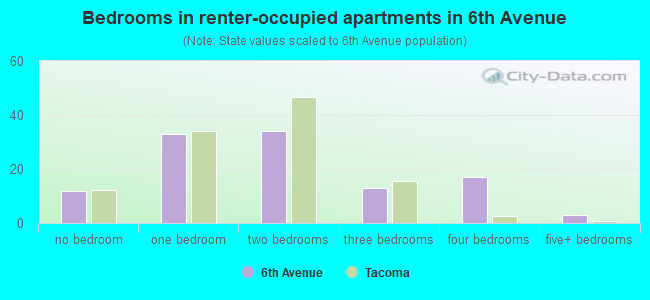
- Bedrooms in renter-occupied apartments in 6th Avenue
- 12no bedroom
- 331 bedroom
- 342 bedrooms
- 133 bedrooms
- 174 bedrooms
- 35+ bedrooms
Average number of cars or other vehicles available in houses/condos:
Average number of cars or other vehicles available in apartments:
| This neighborhood: | 2.1 |
| Tacoma: | 2.2 |
Average number of cars or other vehicles available in apartments:
| Here: | 1.6 |
| city: | 1.2 |
Percentage of units with a mortgage:
| 6th Avenue: | 79.5% |
| Tacoma: | 72.4% |
Average estimated value of detached houses in 2022 (83.0% of all units):
| 6th Avenue: | $494,845 |
| Washington: | $734,307 |
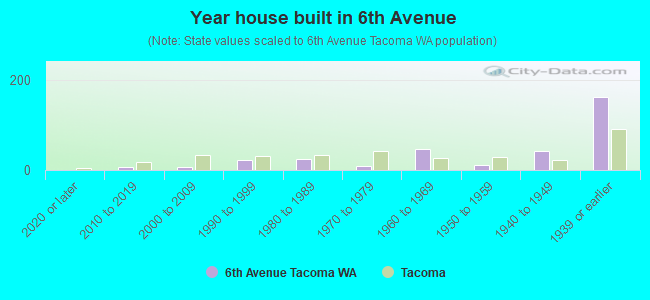
- Year house built in 6th Avenue
- 02020 or later
- 62010 to 2019
- 62000 to 2009
- 231990 to 1999
- 251980 to 1989
- 91970 to 1979
- 461960 to 1969
- 121950 to 1959
- 421940 to 1949
- 1611939 or earlier
City-data.com crime index for city in 2020 (higher means more crime):
| City: | 532.7 |
| U.S. average: | 219.5 |
Travel time to work (commute)
![Travel time to work (commute)]()
- 4Less than 5 minutes
- 355 to 9 minutes
- 4110 to 14 minutes
- 2215 to 19 minutes
- 1620 to 24 minutes
- 925 to 29 minutes
- 3230 to 34 minutes
- 735 to 39 minutes
- 540 to 44 minutes
- 3545 to 59 minutes
- 1660 to 89 minutes
- 1190 or more minutes

Means of transportation to work
![Means of transportation to work]()
- 62.9%262Drove a car alone
- 13.0%54Carpooled
- 1.2%5Bus
- 4.8%20Long-distance train or commuter rail
- 1.2%5Motorcycle
- 1.0%4Bicycle
- 4.1%17Walked
- 0.7%3Other means
- 21.8%91Worked at home

Time leaving home to go to work
![Time leaving home to go to work]()
- 1512:00 a.m. to 4:59 a.m.
- 85:00 a.m. to 5:29 a.m.
- 95:30 a.m. to 5:59 a.m.
- 156:00 a.m. to 6:29 a.m.
- 256:30 a.m. to 6:59 a.m.
- 277:00 a.m. to 7:29 a.m.
- 227:30 a.m. to 7:59 a.m.
- 228:00 a.m. to 8:29 a.m.
- 158:30 a.m. to 8:59 a.m.
- 139:00 a.m. to 9:59 a.m.
- 1010:00 a.m. to 10:59 a.m.
- 211:00 a.m. to 11:59 a.m.
- 1312:00 p.m. to 3:59 p.m.
- 124:00 p.m. to 11:59 p.m.

Occupations of males:
- Percentage of males in management occupations (except farmers):
Here: 13.6% city: 9.1%
- Percentage of males in business and financial operations occupations:
Here: 8.8% city: 5.1%
- Percentage of males in computer and mathematical occupations:
Here: 3.1% city: 4.4%
- Percentage of males in architecture and engineering occupations:
Here: 7.1% city: 2.7%
- Percentage of males in life, physical, and social science occupations:
Here: 2.0% city: 0.7%
- Percentage of males in community and social services occupations:
Here: 4.2% city: 1.7%
- Percentage of males in legal occupations:
Here: 1.4% city: 1.1%
- Percentage of males in education, training, and library occupations:
Here: 7.2% city: 3.2%
- Percentage of males in arts, design, entertainment, sports, and media occupations:
Here: 2.8% city: 1.3%
- Percentage of males in healthcare practitioners and technical occupations:
Here: 3.8% city: 3.5%
- Percentage of males in service occupations:
Here: 7.4% city: 15.1%
- Percentage of males in sales and office occupations:
Here: 13.9% city: 13.9%
- Percentage of males in farming, fishing, and forestry occupations:
Here: 1.4% city: 0.6%
- Percentage of males in construction, extraction, and maintenance occupations:
Here: 6.2% city: 9.4%
- Percentage of males in production occupations:
Here: 5.5% city: 6.3%
- Percentage of males in transportation occupations:
Here: 1.6% city: 7.7%
- Percentage of males in material moving occupations:
Here: 6.8% city: 8.1%
Occupations of females:
- Percentage of females in management occupations (except farmers):
Here: 12.0% city: 9.6%
- Percentage of females in business and financial operations occupations:
Here: 10.2% city: 7.0%
- Percentage of females in computer and mathematical occupations:
Here: 4.5% city: 1.9%
- Percentage of females in life, physical, and social science occupations:
Here: 2.0% city: 1.3%
- Percentage of females in community and social services occupations:
Here: 6.8% city: 3.4%
- Percentage of females in legal occupations:
Here: 2.9% city: 1.6%
- Percentage of females in education, training, and library occupations:
Here: 19.6% city: 10.0%
- Percentage of females in arts, design, entertainment, sports, and media occupations:
Here: 2.7% city: 1.8%
- Percentage of females in healthcare practitioners and technical occupations:
Here: 13.0% city: 9.0%
- Percentage of females in service occupations:
Here: 10.1% city: 20.7%
- Percentage of females in sales and office occupations:
Here: 18.3% city: 25.0%
Percentage of people 16-64 in Armed Forces:
| 6th Avenue: | 0.7% |
| Tacoma: | 1.4% |
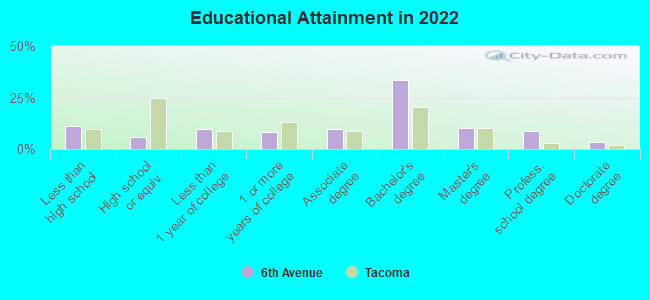
Education in this neighborhood (subdivision or community):
- Percentage of people 3 years and older in K-12 schools:
6th Avenue: 16.0% Tacoma: 14.0%
- Percentage of people 3 years and older in undergraduate colleges:
6th Avenue: 5.9% Tacoma: 5.4%
- Percentage of people 3 years and older in grad. or professional schools:
6th Avenue: 7.1% Tacoma: 1.6%
- Percentage of students K-12 enrolled in private schools:
6th Avenue: 30.1% Tacoma: 12.6%
Percentage of population below poverty level:
| 6th Avenue: | 6.1% |
| Tacoma: | 14.2% |
Median year owner moved in (as recorded in 2022):
Median year renter moved in (as recorded in 2022):
| 6th Avenue: | 2010 |
| Tacoma: | 2013 |
Median year renter moved in (as recorded in 2022):
| 6th Avenue: | 2019 |
| Tacoma: | 2020 |
Percentage of married-couple families with both working:
| 6th Avenue: | 102.9% |
| Tacoma: | 65.1% |
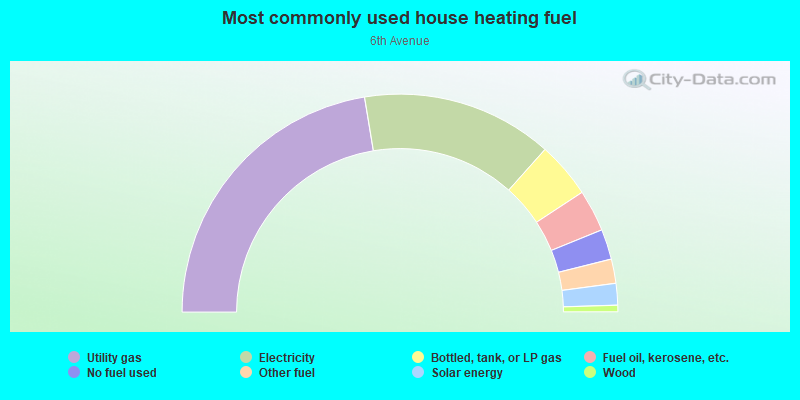
- 44.8%Utility gas
- 28.4%Electricity
- 8.3%Bottled, tank, or LP gas
- 6.2%Fuel oil, kerosene, etc.
- 4.5%No fuel used
- 3.6%Other fuel
- 3.2%Solar energy
- 1.0%Wood
Roads and streets:
6th Ave
Length: 1.42 miles
Direction: E-W
Address range: 2200 to 3799
Direction: E-W
Address range: 2200 to 3799