Estimated zip code population in 2022: 817 Zip code population in 2010: 600 Zip code population in 2000: 524
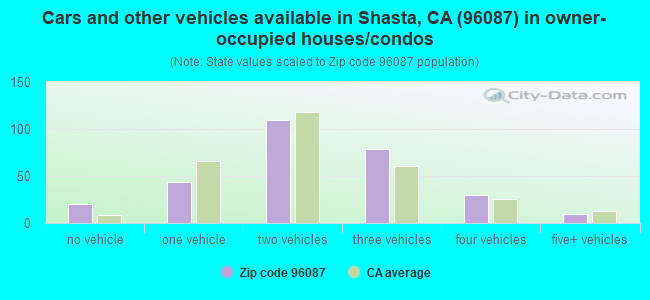
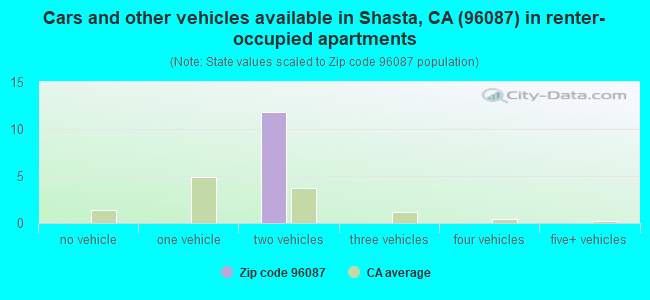
Houses and condos: 322 Renter-occupied apartments: 12
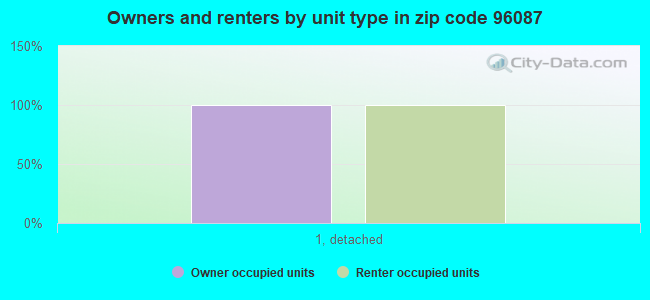
% of renters here:
4%
State:
44%
March 2022 cost of living index in zip code 96087: 92.7 (less than average, U.S. average is 100)
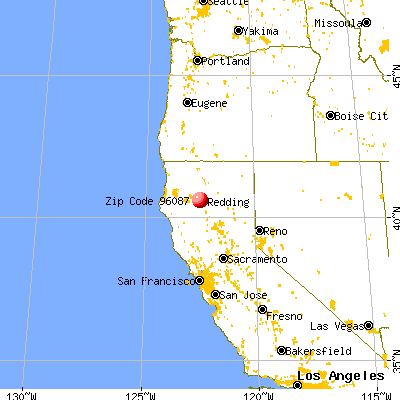
Land area: 78.3 sq. mi. Water area: 5.0 sq. mi.
Population density: 10 people per square mile
(very low).
OSM Map
General Map
Google Map
MSN Map
OSM Map
General Map
Google Map
MSN Map
OSM Map
General Map
Google Map
MSN Map
OSM Map
General Map
Google Map
MSN Map
Please wait while loading the map...
Real estate property taxes paid for housing units in 2022:
This zip code:
0.5% ($2,156)
California:
0.7% ($4,831)
Median real estate property taxes paid for housing units with mortgages in 2022: $2,364 (0.6%) Median real estate property taxes paid for housing units with no mortgage in 2022: $1,944 (0.5%)
Business Search- 14 Million verified businesses
Males: 487
(59.7%)
Females: 329
(40.3%)
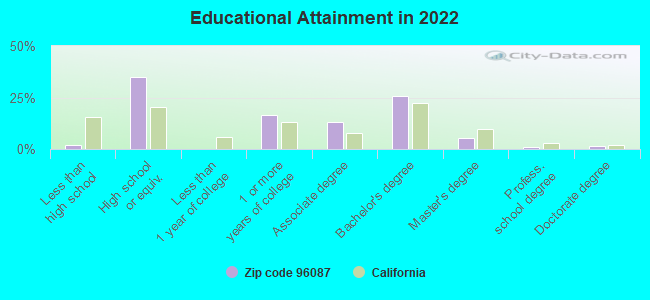
For population 25 years and over in 96087:
High school or higher: 98.0%
Bachelor's degree or higher: 34.0%
Graduate or professional degree: 8.5%
Unemployed: 10.0%
Mean travel time to work (commute): 28.5 minutes
For population 15 years and over in 96087:
Never married: 24.7%
Now married: 42.0%
Separated: 9.2%
Widowed: 1.2%
Divorced: 22.8%
Zip code 96087 compared to state average:
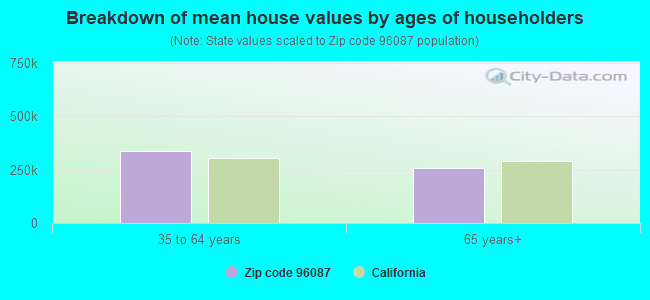
Median house value below state average.
Unemployed percentage above state average.
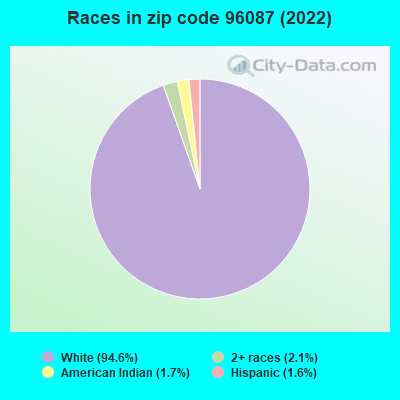
Black race population percentage significantly below state average.
Hispanic race population percentage significantly below state average.
Median age significantly above state average.
Foreign-born population percentage significantly below state average.
Renting percentage significantly below state average.
Length of stay since moving in below state average.
Averages for the 2004 tax year for zip code 96087, filed in 2005:
Average Adjusted Gross Income (AGI) in 2004: $52,103 (Individual Income Tax Returns)
Here:
$52,103
State:
$58,600
Salary/wage: $40,266 (reported on 75.0% of returns)
Here:
$40,266
State:
$49,455
(% of AGI for various income ranges: 70.9% for AGIs below $10k, 63.3% for AGIs $10k-25k, 69.8% for AGIs $25k-50k, 69.8% for AGIs $50k-75k, 72.2% for AGIs $75k-100k, 41.6% for AGIs over 100k)
Taxable interest for individuals: $1,546 (reported on 50.6% of returns)
This zip code:
$1,546
California:
$2,365
(% of AGI for various income ranges: 8.8% for AGIs below $10k, 2.3% for AGIs $10k-25k, 1.3% for AGIs $25k-50k, 2.1% for AGIs $50k-75k, 1.0% for AGIs $75k-100k, 1.1% for AGIs over 100k)
Taxable dividends: $2,909 (reported on 25.5% of returns)
Here:
$2,909
State:
$4,746
(% of AGI for various income ranges: 2.9% for AGIs below $10k, 0.3% for AGIs $10k-25k, 0.9% for AGIs $25k-50k, 2.2% for AGIs $50k-75k, 1.1% for AGIs $75k-100k, 1.6% for AGIs over 100k)
Net capital gain/loss: +$14,323 (reported on 22.6% of returns)
Here:
+$14,323
State:
+$23,418
(% of AGI for various income ranges: 2.3% for AGIs below $10k, -0.7% for AGIs $10k-25k, 0.4% for AGIs $25k-50k, 0.9% for AGIs $50k-75k, 2.0% for AGIs $75k-100k, 13.7% for AGIs over 100k)
Profit/loss from business: +$19,816 (reported on 20.3% of returns)
Here:
+$19,816
State:
+$16,826
(% of AGI for various income ranges: -4.3% for AGIs below $10k, 10.1% for AGIs $10k-25k, 7.0% for AGIs $25k-50k, 1.2% for AGIs $50k-75k, 15.4% for AGIs $75k-100k, 7.4% for AGIs over 100k)
IRA payment deduction: $2,667 (reported on 2.1% of returns)
96087:
$2,667
California:
$3,192
Self-employed pension: $9,000 (reported on 2.0% of returns)
Here:
$9,000
California:
$17,688
Total itemized deductions: $19,401 (21% of AGI, reported on 38.7% of returns)
Here:
$19,401
State:
$28,113
Here:
21.1% of AGI
State:
25.3% of AGI
(% of AGI for various income ranges: 16.3% for AGIs $10k-25k, 12.4% for AGIs $25k-50k, 18.5% for AGIs $50k-75k, 17.5% for AGIs $75k-100k, 12.5% for AGIs over 100k)
Charity contributions deductions: $2,528 (3% of AGI, reported on 34.4% of returns)
Here:
$2,528
State:
$3,923
Here:
2.6% of AGI
State:
3.3% of AGI
(% of AGI for various income ranges: 2.2% for AGIs $10k-25k, 1.2% for AGIs $25k-50k, 1.2% for AGIs $50k-75k, 2.0% for AGIs $75k-100k, 1.8% for AGIs over 100k)
Total tax: $6,888 (reported on 79.3% of returns)
96087:
$6,888
State:
$10,761
(% of AGI for various income ranges: 2.9% for AGIs below $10k, 4.4% for AGIs $10k-25k, 8.4% for AGIs $25k-50k, 9.1% for AGIs $50k-75k, 11.4% for AGIs $75k-100k, 12.9% for AGIs over 100k)
Earned income credit: $1,478 (reported on 11.9% of returns)
Here:
$1,478
State:
$1,763
Percentage of individuals using paid preparers for their 2004 taxes: 60.1%
Here:
60%
State:
66%
(% for various income ranges: 49.1% for AGIs below $10k, 56.3% for AGIs $10k-25k, 61.3% for AGIs $25k-50k, 67.1% for AGIs $50k-75k, 63.8% for AGIs $75k-100k, 74.1% for AGIs over 100k)
Household received Food Stamps/SNAP in the past 12 months: 59 Household did not receive Food Stamps/SNAP in the past 12 months: 249
Women who did not have a birth in the past 12 months: 146 (47 now married, 99 unmarried)
Housing units in zip code 96087 with a mortgage: 204 (16 second mortgage, 17 both second mortgage and home equity loan) Median monthly owner costs for units with a mortgage: $1,574 Median monthly owner costs for units without a mortgage: $842
Residents with income below the poverty level in 2022:
This zip code:
9.6%
Whole state:
12.2%
Residents with income below 50% of the poverty level in 2022:
This zip code:
7.9%
Whole state:
6.2%
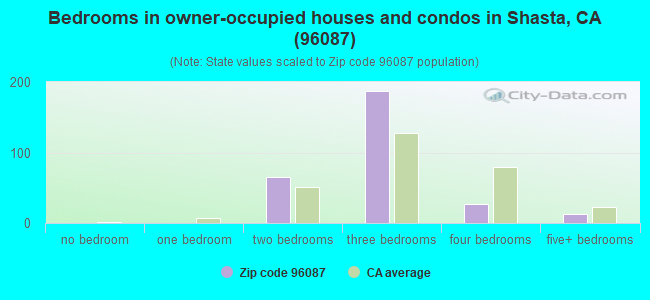
Median number of rooms in houses and condos:
Here:
5.9
State:
6.0
Notable locations in this zip code not listed on our city pages
Notable locations in zip code 96087: Crystal Creek Conservation Camp (A), Judge Carr Powerplant (B), Tower House (C), Oak Bottom Campground (D), Oak Bottom Campround (E), Dry Creek Campground (F), Brandy Creek Campground (G), Dry Creek Campground (H), Sheep Camp (I). Display/hide their locations on the map
Streams, rivers, and creeks: Boulder Creek (A), Brandy Creek (B), Crystal Creek (C), Dry Creek (D), Mill Creek (E), Willow Creek (F), Whiskey Creek (G), Salt Creek (H), Papoose Creek (I). Display/hide their locations on the map
Parks in zip code 96087 include: Shasta State Historic Park (1), Coggins Park (2), Whiskeytown-Shasta-Trinity National Recreation Area (3). Display/hide their locations on the map
Size of family households: 138 2-persons, 19 3-persons, 33 4-persons, 11 5-persons, 17 6-persons
Size of nonfamily households: 18 1-person, 65 2-persons
52 married couples with children.
38 single-parent households (38 men).
99.2% of residents of 96087 zip code speak English at home.
Foreign born population: 0 (0.0%)
:
0.0%
Whole state:
26.7%
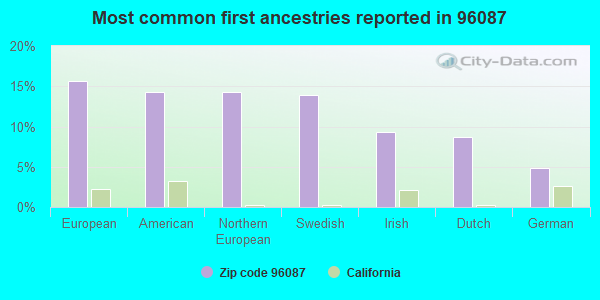
16%European
14%American
14%Northern European
14%Swedish
9%Irish
9%Dutch
5%German
Facilities with environmental interests located in this zip code:
LITTLE SHASTA (T44N, R5W, S4 MDM in SHASTA, CA)
CRITERIA AND HAZARDOUS AIR POLLUTANT INVENTORY (Inventory of air pollution sources) Business SIC classification: REFUSE SYSTEMS Business NAICS classification: SOLID WASTE LANDFILL.
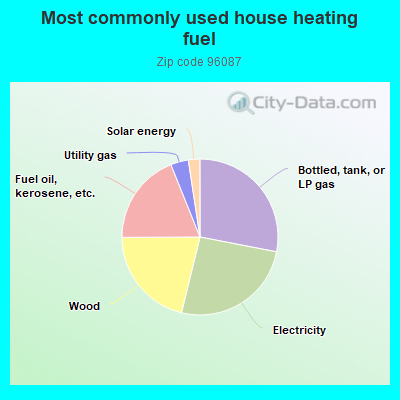
28.2%Bottled, tank, or LP gas
25.9%Electricity
21.2%Wood
19.1%Fuel oil, kerosene, etc.
3.7%Utility gas
2.4%Solar energy
Population in 1990: 294. Population change in the 1990s: +230 (+78.2%).
Place of birth for U.S.-born residents:
This state: 615
Northeast: 51
Midwest: 78
South: 21
West: 46
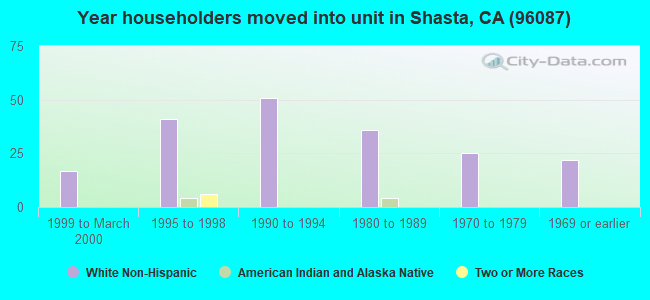
64% of the 96087 zip code residents lived in the same house 5 years ago. Out of people who lived in different houses, 75% lived in this county. Out of people who lived in different counties, 50% lived in California.
95% of the 96087 zip code residents lived in the same house 1 year ago. Out of people who lived in different houses, 100% moved from this county.
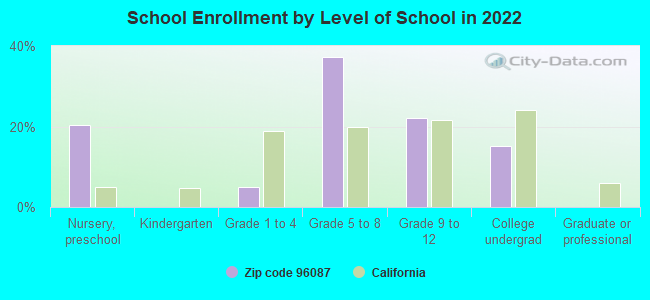
Private vs. public school enrollment:
Students in private schools in grades 1 to 8 (elementary and middle school): 17
Here:
34.0%
California:
10.5%
Students in private schools in grades 9 to 12 (high school):
Here:
0.0%
California:
8.5%
Students in private undergraduate colleges:
Here:
0.0%
California:
15.9%
Top industries in this zip code by the number of employees in 2005:
Utilities: Electric Power Distribution (100-249 employees: 1 establishment)
Construction: Electrical Contractors (20-49: 1)
Construction: Tile and Terrazzo Contractors (5-9: 1)
Construction: New Single-Family Housing Construction (except Operative Builders) (1-4: 2)
Professional, Scientific, and Technical Services: Veterinary Services (1-4: 1)
Construction: Site Preparation Contractors (1-4: 1)
Administrative and Support and Waste Management and Remediation Services: Landscaping Services (1-4: 1)
Professional, Scientific, and Technical Services: Architectural Services (1-4: 1)
Fatal accident statistics in 2010:
Fatal accident count: 1
Vehicles involved in fatal accidents: 1
Fatal accidents caused by drunken drivers: 1
Fatalities: 1
Persons involved in fatal accidents: 1
Pedestrians involved in fatal accidents: 0
Home Mortgage Disclosure Act Aggregated Statistics For Year 2009 (Based on 2 partial tracts)
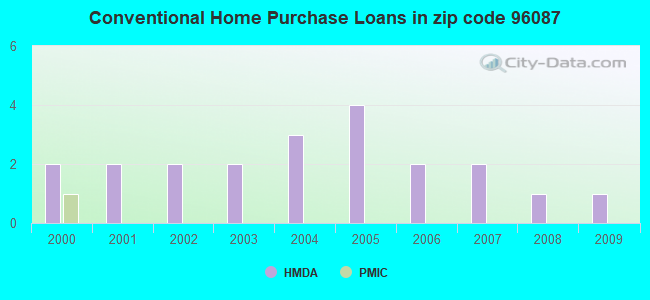
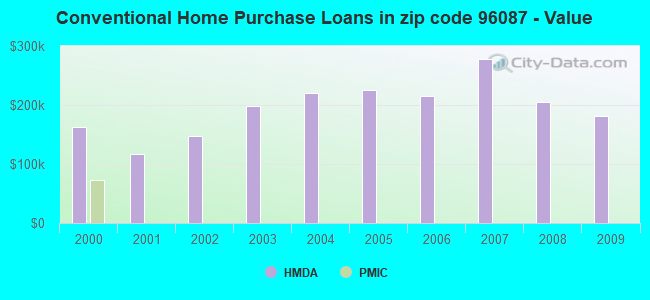
B) Conventional Home Purchase Loans
C) Refinancings
Number
Average Value
Number
Average Value
LOANS ORIGINATED
1
$181,020
4
$211,850
APPLICATIONS APPROVED, NOT ACCEPTED
0
$0
0
$0
APPLICATIONS DENIED
0
$0
1
$360,570
APPLICATIONS WITHDRAWN
0
$0
1
$292,990
FILES CLOSED FOR INCOMPLETENESS
0
$0
0
$0
Aggregated Statistics For Year 2008 (Based on 2 partial tracts)
B) Conventional Home Purchase Loans
C) Refinancings
D) Home Improvement Loans
Number
Average Value
Number
Average Value
Number
Average Value
LOANS ORIGINATED
1
$204,910
2
$224,400
0
$0
APPLICATIONS APPROVED, NOT ACCEPTED
0
$0
0
$0
0
$0
APPLICATIONS DENIED
0
$0
1
$232,660
1
$99,070
APPLICATIONS WITHDRAWN
0
$0
0
$0
0
$0
FILES CLOSED FOR INCOMPLETENESS
0
$0
0
$0
0
$0
Aggregated Statistics For Year 2007 (Based on 2 partial tracts)
B) Conventional Home Purchase Loans
C) Refinancings
D) Home Improvement Loans
G) Loans On Manufactured Home Dwelling (A B C & D)
Number
Average Value
Number
Average Value
Number
Average Value
Number
Average Value
LOANS ORIGINATED
2
$277,225
3
$271,367
1
$80,400
1
$73,110
APPLICATIONS APPROVED, NOT ACCEPTED
0
$0
1
$137,250
0
$0
0
$0
APPLICATIONS DENIED
0
$0
2
$217,010
1
$100,770
1
$63,920
APPLICATIONS WITHDRAWN
0
$0
1
$202,340
0
$0
0
$0
FILES CLOSED FOR INCOMPLETENESS
0
$0
0
$0
0
$0
0
$0
Aggregated Statistics For Year 2006 (Based on 2 partial tracts)
B) Conventional Home Purchase Loans
C) Refinancings
D) Home Improvement Loans
F) Non-occupant Loans on < 5 Family Dwellings (A B C & D)
Number
Average Value
Number
Average Value
Number
Average Value
Number
Average Value
LOANS ORIGINATED
2
$215,780
4
$280,552
1
$137,630
1
$182,760
APPLICATIONS APPROVED, NOT ACCEPTED
0
$0
1
$262,860
0
$0
0
$0
APPLICATIONS DENIED
0
$0
3
$195,690
1
$113,510
0
$0
APPLICATIONS WITHDRAWN
0
$0
1
$414,510
0
$0
0
$0
FILES CLOSED FOR INCOMPLETENESS
0
$0
1
$110,260
0
$0
0
$0
Aggregated Statistics For Year 2005 (Based on 2 partial tracts)
B) Conventional Home Purchase Loans
C) Refinancings
D) Home Improvement Loans
F) Non-occupant Loans on < 5 Family Dwellings (A B C & D)
G) Loans On Manufactured Home Dwelling (A B C & D)
Number
Average Value
Number
Average Value
Number
Average Value
Number
Average Value
Number
Average Value
LOANS ORIGINATED
4
$225,950
5
$233,604
1
$101,490
1
$160,230
1
$99,150
APPLICATIONS APPROVED, NOT ACCEPTED
0
$0
1
$172,030
0
$0
0
$0
0
$0
APPLICATIONS DENIED
1
$230,880
2
$179,645
1
$92,310
0
$0
0
$0
APPLICATIONS WITHDRAWN
1
$164,050
2
$186,070
0
$0
0
$0
0
$0
FILES CLOSED FOR INCOMPLETENESS
0
$0
1
$92,690
0
$0
0
$0
0
$0
Aggregated Statistics For Year 2004 (Based on 2 partial tracts)
B) Conventional Home Purchase Loans
C) Refinancings
D) Home Improvement Loans
G) Loans On Manufactured Home Dwelling (A B C & D)
Number
Average Value
Number
Average Value
Number
Average Value
Number
Average Value
LOANS ORIGINATED
3
$220,650
4
$206,530
1
$103,990
1
$60,290
APPLICATIONS APPROVED, NOT ACCEPTED
0
$0
2
$149,065
0
$0
0
$0
APPLICATIONS DENIED
1
$147,460
3
$152,283
1
$54,320
0
$0
APPLICATIONS WITHDRAWN
0
$0
2
$164,240
0
$0
0
$0
FILES CLOSED FOR INCOMPLETENESS
0
$0
0
$0
0
$0
0
$0
Aggregated Statistics For Year 2003 (Based on 2 partial tracts)
B) Conventional Home Purchase Loans
C) Refinancings
D) Home Improvement Loans
Number
Average Value
Number
Average Value
Number
Average Value
LOANS ORIGINATED
2
$199,150
11
$176,368
0
$0
APPLICATIONS APPROVED, NOT ACCEPTED
0
$0
2
$140,900
0
$0
APPLICATIONS DENIED
1
$134,420
4
$155,245
1
$15,990
APPLICATIONS WITHDRAWN
0
$0
3
$140,453
0
$0
FILES CLOSED FOR INCOMPLETENESS
0
$0
0
$0
0
$0
Aggregated Statistics For Year 2002 (Based on 2 partial tracts)
B) Conventional Home Purchase Loans
C) Refinancings
Number
Average Value
Number
Average Value
LOANS ORIGINATED
2
$146,870
7
$177,466
APPLICATIONS APPROVED, NOT ACCEPTED
0
$0
1
$141,260
APPLICATIONS DENIED
0
$0
2
$127,195
APPLICATIONS WITHDRAWN
0
$0
2
$124,550
FILES CLOSED FOR INCOMPLETENESS
0
$0
0
$0
Aggregated Statistics For Year 2001 (Based on 2 partial tracts)
B) Conventional Home Purchase Loans
C) Refinancings
Number
Average Value
Number
Average Value
LOANS ORIGINATED
2
$117,010
5
$132,762
APPLICATIONS APPROVED, NOT ACCEPTED
0
$0
1
$66,040
APPLICATIONS DENIED
1
$79,150
2
$106,840
APPLICATIONS WITHDRAWN
0
$0
1
$113,170
FILES CLOSED FOR INCOMPLETENESS
0
$0
0
$0
Aggregated Statistics For Year 2000 (Based on 2 partial tracts)
B) Conventional Home Purchase Loans
C) Refinancings
Number
Average Value
Number
Average Value
LOANS ORIGINATED
2
$162,160
2
$89,945
APPLICATIONS APPROVED, NOT ACCEPTED
1
$65,470
0
$0
APPLICATIONS DENIED
1
$65,200
1
$101,420
APPLICATIONS WITHDRAWN
0
$0
0
$0
FILES CLOSED FOR INCOMPLETENESS
0
$0
0
$0
Aggregated Statistics For Year 1999 (Based on 1 partial tract)
Detailed HMDA statistics for the following Tracts:0124.00
Private Mortgage Insurance Companies Aggregated Statistics For Year 2000 (Based on 2 partial tracts)
A) Conventional Home Purchase Loans
Number
Average Value
LOANS ORIGINATED
1
$72,310
APPLICATIONS APPROVED, NOT ACCEPTED
0
$0
APPLICATIONS DENIED
0
$0
APPLICATIONS WITHDRAWN
0
$0
FILES CLOSED FOR INCOMPLETENESS
0
$0
Detailed PMIC statistics for the following Tracts:0124.00
2006 - 2018 National Fire Incident Reporting System (NFIRS) incidents
Based on the data from the years 2006 - 2018 the average number of fires per year is 11. The highest number of fire incidents - 19 took place in 2007, and the least - 2 in 2006. The data has a rising trend.
When looking into fire subcategories, the most incidents belonged to: Outside Fires (73.2%), and Structure Fires (14.8%).
Fire incident types reported to NFIRS in Zip Code 96087


 Nearest zip codes: 96047, 96033, 96001, 96052, 96024, 96019.
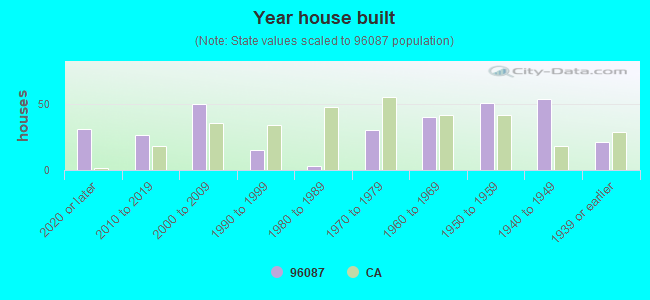


 Based on the data from the years 2006 - 2018 the average number of fires per year is 11. The highest number of fire incidents - 19 took place in 2007, and the least - 2 in 2006. The data has a rising trend.
 When looking into fire subcategories, the most incidents belonged to: Outside Fires (73.2%), and Structure Fires (14.8%).