Estimated zip code population in 2022: 2,516 Zip code population in 2010: 1,460 Zip code population in 2000: 1,837
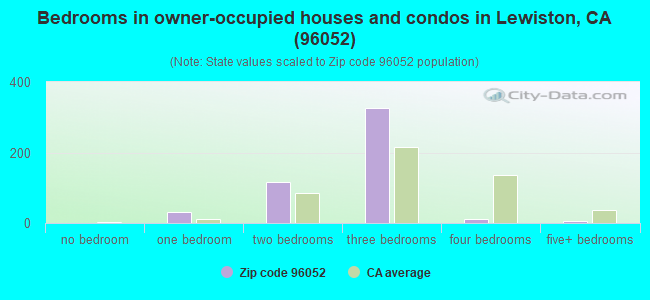
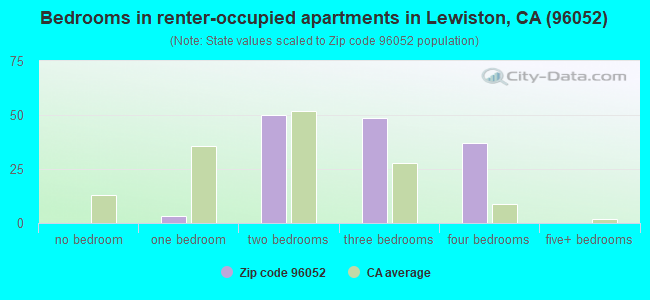
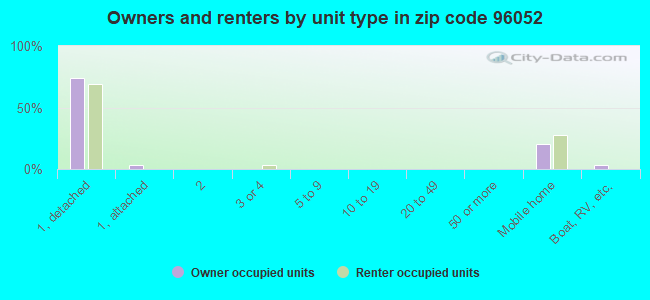
Houses and condos: 964 Renter-occupied apartments: 138
% of renters here:
22%
State:
44%
March 2022 cost of living index in zip code 96052: 96.4 (near average, U.S. average is 100)
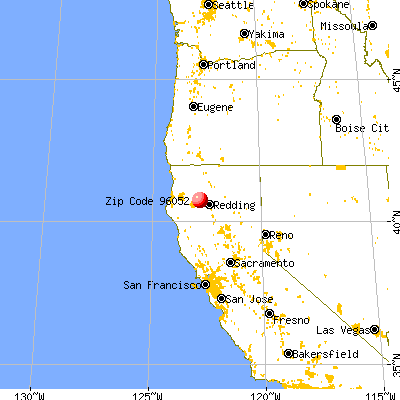
Land area: 77.1 sq. mi. Water area: 1.8 sq. mi.
Population density: 33 people per square mile
(very low).
OSM Map
General Map
Google Map
MSN Map
OSM Map
General Map
Google Map
MSN Map
OSM Map
General Map
Google Map
MSN Map
OSM Map
General Map
Google Map
MSN Map
Please wait while loading the map...
Real estate property taxes paid for housing units in 2022:
This zip code:
0.5% ($1,706)
California:
0.7% ($4,831)
Median real estate property taxes paid for housing units with mortgages in 2022: $1,848 (0.5%) Median real estate property taxes paid for housing units with no mortgage in 2022: $1,367 (0.4%)
Business Search- 14 Million verified businesses
Males: 1,147
(45.6%)
Females: 1,369
(54.4%)
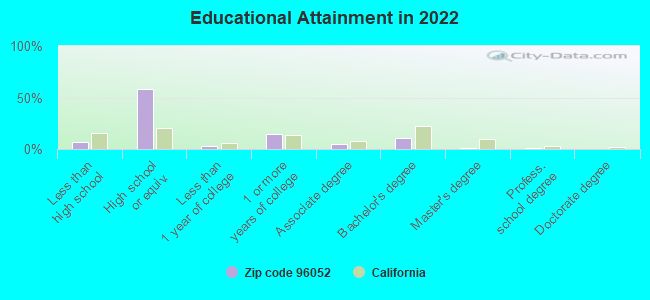
For population 25 years and over in 96052:
High school or higher: 92.1%
Bachelor's degree or higher: 12.5%
Graduate or professional degree: 2.1%
Unemployed: 3.0%
Mean travel time to work (commute): 64.4 minutes
For population 15 years and over in 96052:
Never married: 24.3%
Now married: 45.7%
Separated: 0.8%
Widowed: 6.3%
Divorced: 22.9%
Zip code 96052 compared to state average:
Median household income below state average.
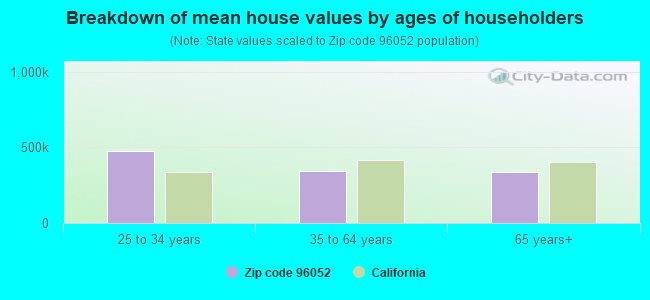
Median house value below state average.
Unemployed percentage below state average.
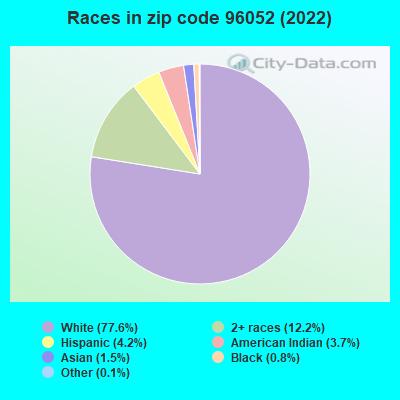
Black race population percentage significantly below state average.
Hispanic race population percentage significantly below state average.
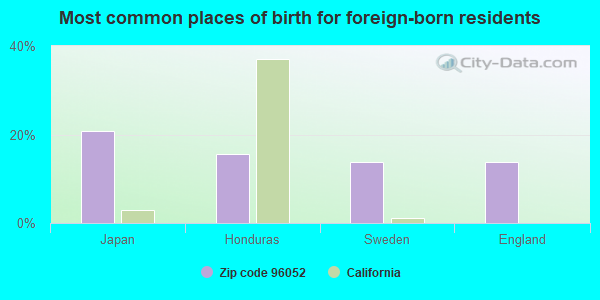
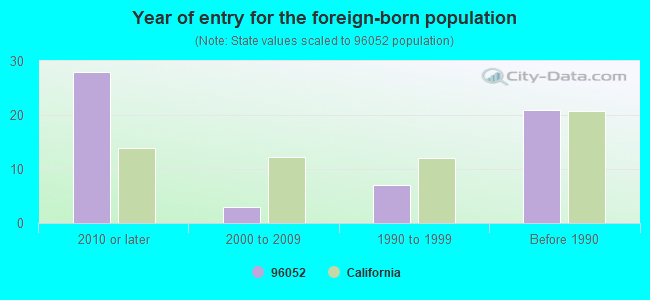
Foreign-born population percentage significantly below state average.
Renting percentage below state average.
Length of stay since moving in below state average.
Number of college students significantly below state average.
Percentage of population with a bachelor's degree or higher significantly below state average.
Averages for the 2020 tax year for zip code 96052, filed in 2021:
Average Adjusted Gross Income (AGI) in 2020: $49,622 (Individual Income Tax Returns)
Here:
$49,622
State:
$95,910
Salary/wage: $37,265 (reported on 63.3% of returns)
Here:
$37,265
State:
$77,331
(% of AGI for various income ranges: 997.3% for AGIs below $25k, 3395.6% for AGIs $25k-50k, 4044.0% for AGIs $50k-75k, 18275.0% for AGIs $100k-200k)
Taxable interest for individuals: $1,094 (reported on 32.7% of returns)
This zip code:
$1,094
California:
$2,294
(% of AGI for various income ranges: 20.0% for AGIs below $25k, 52.2% for AGIs $25k-50k, 14.0% for AGIs $50k-75k, 495.0% for AGIs $100k-200k)
Ordinary dividends: $3,157 (reported on 14.3% of returns)
Here:
$3,157
State:
$10,949
(% of AGI for various income ranges: 84.4% for AGIs $25k-50k, 186.0% for AGIs $50k-75k, 260.0% for AGIs $100k-200k)
Net capital gain/loss in AGI: +$12,486 (reported on 14.3% of returns)
Here:
+$12,486
State:
+$49,306
(% of AGI for various income ranges: 108.2% for AGIs below $25k, 532.0% for AGIs $50k-75k, 2445.0% for AGIs $100k-200k)
Profit/loss from business: +$12,600 (reported on 18.4% of returns)
Here:
+$12,600
State:
+$15,671
(% of AGI for various income ranges: 95.5% for AGIs below $25k, 498.9% for AGIs $25k-50k)
Taxable individual retirement arrangement distribution: $15,220 (reported on 10.2% of returns)
96052:
$15,220
California:
$23,505
(% of AGI for various income ranges: 356.7% for AGIs $25k-50k)
Earned income credit: $2,200 (reported on 16.3% of returns)
Here:
$2,200
State:
$2,074
(% of AGI for various income ranges: 86.4% for AGIs below $25k, 90.0% for AGIs $25k-50k)
Percentage of individuals using paid preparers for their 2020 taxes: 91.8%
Here:
92%
State:
92%
(% for various income ranges: 88.9% for AGIs below $25k, 93.3% for AGIs $25k-50k, 83.3% for AGIs $50k-75k, 100.0% for AGIs $75k-100k, 100.0% for AGIs $100k-200k)
Averages for the 2012 tax year for zip code 96052, filed in 2013:
Average Adjusted Gross Income (AGI) in 2012: $38,204 (Individual Income Tax Returns)
Here:
$38,204
State:
$72,726
Salary/wage: $28,200 (reported on 63.0% of returns)
Here:
$28,200
State:
$59,079
(% of AGI for various income ranges: 59.3% for AGIs below $25k, 46.1% for AGIs $25k-50k, 46.9% for AGIs $50k-75k, 95.0% for AGIs $75k-100k)
Taxable interest for individuals: $937 (reported on 41.3% of returns)
This zip code:
$937
California:
$2,146
(% of AGI for various income ranges: 1.6% for AGIs below $25k, 2.4% for AGIs $25k-50k, 0.2% for AGIs $50k-75k, 0.9% for AGIs $75k-100k)
Ordinary dividends: $3,211 (reported on 19.6% of returns)
Here:
$3,211
State:
$9,308
(% of AGI for various income ranges: 2.7% for AGIs below $25k, 3.2% for AGIs $25k-50k, 2.0% for AGIs $50k-75k)
Net capital gain/loss in AGI: +$689 (reported on 19.6% of returns)
Here:
+$689
State:
+$30,460
(% of AGI for various income ranges: 0.7% for AGIs $25k-50k, 1.3% for AGIs $50k-75k)
Profit/loss from business: +$11,633 (reported on 19.6% of returns)
Here:
+$11,633
State:
+$17,064
(% of AGI for various income ranges: 4.8% for AGIs below $25k, 9.1% for AGIs $25k-50k, 12.3% for AGIs $50k-75k)
Taxable individual retirement arrangement distribution: $11,500 (reported on 13.0% of returns)
96052:
$11,500
California:
$19,557
Total itemized deductions: $22,109 (31% of AGI, reported on 23.9% of returns)
Here:
$22,109
State:
$34,004
Here:
31.4% of AGI
State:
22.7% of AGI
(% of AGI for various income ranges: 11.8% for AGIs below $25k, 10.4% for AGIs $25k-50k, 15.4% for AGIs $50k-75k, 15.2% for AGIs $75k-100k, 16.4% for AGIs $100k-200k)
Charity contributions: $2,257 (reported on 15.2% of returns)
Here:
$2,257
State:
$4,659
(% of AGI for various income ranges: 1.0% for AGIs below $25k, 1.0% for AGIs $50k-75k, 3.2% for AGIs $75k-100k)
Taxes paid: $6,082 (reported on 23.9% of returns)
96052:
$6,082
State:
$14,448
(% of AGI for various income ranges: 2.0% for AGIs below $25k, 2.6% for AGIs $25k-50k, 3.5% for AGIs $50k-75k, 4.1% for AGIs $75k-100k, 6.6% for AGIs $100k-200k)
Earned income credit: $1,622 (reported on 19.6% of returns)
Here:
$1,622
State:
$2,286
(% of AGI for various income ranges: 6.0% for AGIs below $25k)
Percentage of individuals using paid preparers for their 2012 taxes: 58.7%
Here:
59%
State:
64%
(% for various income ranges: 47.6% for AGIs below $25k, 58.3% for AGIs $25k-50k, 71.4% for AGIs $50k-75k, 166.7% for AGIs $75k-100k)
Averages for the 2004 tax year for zip code 96052, filed in 2005:
Average Adjusted Gross Income (AGI) in 2004: $42,745 (Individual Income Tax Returns)
Here:
$42,745
State:
$58,600
Salary/wage: $32,818 (reported on 70.0% of returns)
Here:
$32,818
State:
$49,455
(% of AGI for various income ranges: 52.9% for AGIs $10k-25k, 64.7% for AGIs $25k-50k, 48.0% for AGIs $50k-75k, 68.7% for AGIs $75k-100k, 37.8% for AGIs over 100k)
Taxable interest for individuals: $1,508 (reported on 60.5% of returns)
This zip code:
$1,508
California:
$2,365
(% of AGI for various income ranges: 5.0% for AGIs $10k-25k, 1.8% for AGIs $25k-50k, 2.4% for AGIs $50k-75k, 0.9% for AGIs $75k-100k, 1.0% for AGIs over 100k)
Taxable dividends: $2,638 (reported on 23.5% of returns)
Here:
$2,638
State:
$4,746
(% of AGI for various income ranges: 3.6% for AGIs $10k-25k, 1.1% for AGIs $25k-50k, 2.1% for AGIs $50k-75k, 1.1% for AGIs $75k-100k)
Net capital gain/loss: +$9,080 (reported on 21.8% of returns)
Here:
+$9,080
State:
+$23,418
(% of AGI for various income ranges: -0.2% for AGIs $10k-25k, 1.5% for AGIs $25k-50k, 5.0% for AGIs $50k-75k, 14.4% for AGIs over 100k)
Profit/loss from business: +$11,075 (reported on 20.0% of returns)
Here:
+$11,075
State:
+$16,826
IRA payment deduction: $3,500 (reported on 4.0% of returns)
96052:
$3,500
California:
$3,192
Total itemized deductions: $17,639 (28% of AGI, reported on 30.5% of returns)
Here:
$17,639
State:
$28,113
Here:
28.4% of AGI
State:
25.3% of AGI
(% of AGI for various income ranges: 13.3% for AGIs $10k-25k, 12.5% for AGIs $25k-50k, 11.7% for AGIs $50k-75k, 17.1% for AGIs $75k-100k, 11.0% for AGIs over 100k)
Charity contributions deductions: $2,146 (3% of AGI, reported on 25.8% of returns)
Here:
$2,146
State:
$3,923
Here:
3.4% of AGI
State:
3.3% of AGI
(% of AGI for various income ranges: 1.4% for AGIs $10k-25k, 1.0% for AGIs $25k-50k, 1.5% for AGIs $50k-75k, 1.1% for AGIs $75k-100k, 1.6% for AGIs over 100k)
Total tax: $4,647 (reported on 84.2% of returns)
96052:
$4,647
State:
$10,761
(% of AGI for various income ranges: 4.6% for AGIs $10k-25k, 6.2% for AGIs $25k-50k, 9.6% for AGIs $50k-75k, 9.3% for AGIs $75k-100k, 15.8% for AGIs over 100k)
Earned income credit: $1,714 (reported on 10.5% of returns)
Here:
$1,714
State:
$1,763
Percentage of individuals using paid preparers for their 2004 taxes: 66.5%
Here:
66%
State:
66%
(% for various income ranges: 56.2% for AGIs $10k-25k, 69.2% for AGIs $25k-50k, 76.0% for AGIs $50k-75k, 68.2% for AGIs $75k-100k, 78.3% for AGIs over 100k)
Household received Food Stamps/SNAP in the past 12 months: 144 Household did not receive Food Stamps/SNAP in the past 12 months: 499
Women who had a birth in the past 12 months: 6 (6 now married, 0 unmarried) Women who did not have a birth in the past 12 months: 675 (340 now married, 331 unmarried)
Housing units in zip code 96052 with a mortgage: 296 (11 second mortgage, 11 both second mortgage and home equity loan) Median monthly owner costs for units with a mortgage: $1,981 Median monthly owner costs for units without a mortgage: $525
Residents with income below the poverty level in 2022:
This zip code:
16.0%
Whole state:
12.2%
Residents with income below 50% of the poverty level in 2022:
This zip code:
11.5%
Whole state:
6.2%
Median number of rooms in houses and condos:
Here:
5.2
State:
6.0
Median number of rooms in apartments:
Here:
5.8
State:
3.9
Notable locations in this zip code not listed on our city pages
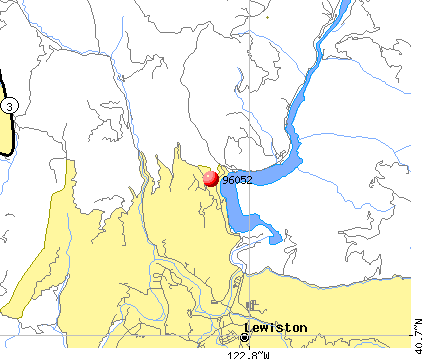
Notable locations in zip code 96052: Ackerman Campground (A), Cooper Gulch Campground (B), Independent Order of Odd Fellows Camp (C), Mary Smith Campground (D), Trinity River Fish Hatchery (E), Tunnel Rock Campground (F), Lakeview Terrace Campground (G), Fawn Lodge Forest Service Station (H), Pine Cove Boat Launching Ramp (I), Pine Cove (J), Trinity Alps Marina (K), Buckhorn Station (L), Fawn Lodge (M), Lowden Ranch (N), Trinity Visitor Center (O), Lewiston Volunteer Fire Department (P). Display/hide their locations on the map
In group quarters: 77 (-1 institutionalized population)
Size of family households: 160 2-persons, 77 3-persons, 35 4-persons, 32 5-persons, 91 6-persons, 8 7-or-more-persons
Size of nonfamily households: 195 1-person, 30 2-persons
134 married couples with children.
342 single-parent households (185 men, 157 women).
96.7% of residents of 96052 zip code speak English at home.
0.6% of residents speak Spanish at home (64% very well, 21% well, 14% not at all).
1.6% of residents speak Asian or Pacific Island language at home (43% very well, 57% well).
Foreign born population: 58 (2.3%) (53.0% of them are naturalized citizens)
This zip code:
2.3%
Whole state:
26.7%
21%Japan
16%Honduras
14%Sweden
14%England
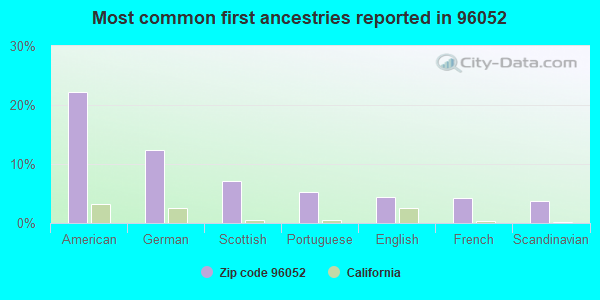
22%American
12%German
7%Scottish
5%Portuguese
4%English
4%French
4%Scandinavian
Year of entry for the foreign-born population
282010 or later
32000 to 2009
71990 to 1999
21Before 1990
Facilities with environmental interests located in this zip code:
LEWISTON ELEMENTARY (120 OLD LEWISTON ROAD in LEWISTON, CA)
(National Center for Education Statistics) - STATE ID-6053789
CAL TRANS BUCKHORN MAINT STATION (HWY 299 AT BUCKHORN SOUTH OF in LEWISTON, CA)
Small Quantity Generators, between 100 kg and 1000 kg of hazardous waste/month (Resource Conservation and Recovery Act (tracking hazardous waste))
Housing units lacking complete kitchen facilities: 0.5%
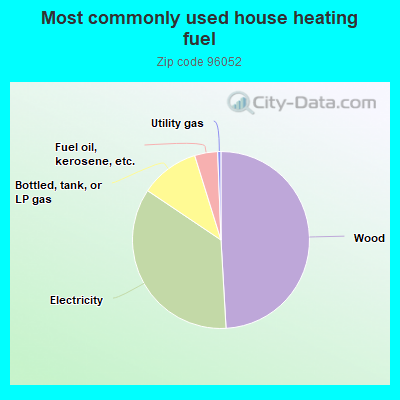
49.2%Wood
35.4%Electricity
10.8%Bottled, tank, or LP gas
4.2%Fuel oil, kerosene, etc.
0.6%Utility gas
Population in 1990: 2,461.
Place of birth for U.S.-born residents:
This state: 1,761
Northeast: 78
Midwest: 105
South: 135
West: 360
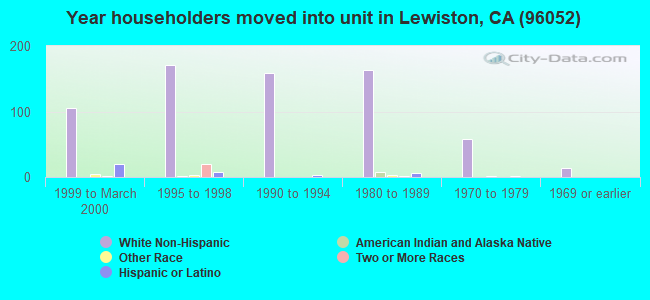
53% of the 96052 zip code residents lived in the same house 5 years ago. Out of people who lived in different houses, 35% lived in this county. Out of people who lived in different counties, 50% lived in California.
73% of the 96052 zip code residents lived in the same house 1 year ago. Out of people who lived in different houses, 90% moved from different county within same state. Out of people who lived in different houses, 10% moved from different state.
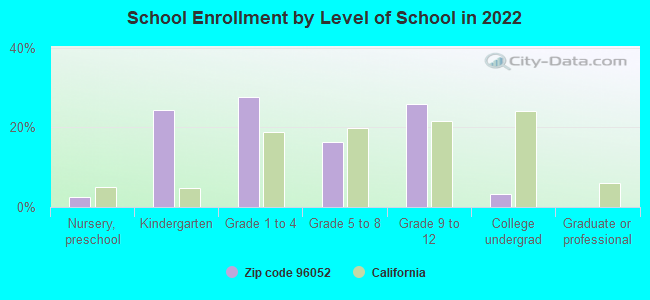
Private vs. public school enrollment:
Students in private schools in grades 1 to 8 (elementary and middle school):
Here:
0.0%
California:
10.5%
Students in private schools in grades 9 to 12 (high school): 4
Here:
3.7%
California:
8.5%
Students in private undergraduate colleges:
Here:
0.0%
California:
15.9%
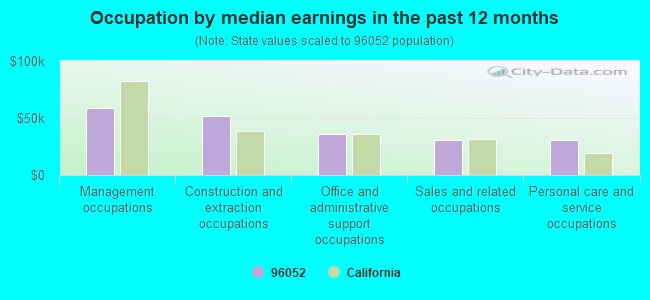
Occupation by median earnings in the past 12 months ($)
59,087Management occupations
51,711Construction and extraction occupations
35,761Office and administrative support occupations
30,781Sales and related occupations
30,694Personal care and service occupations
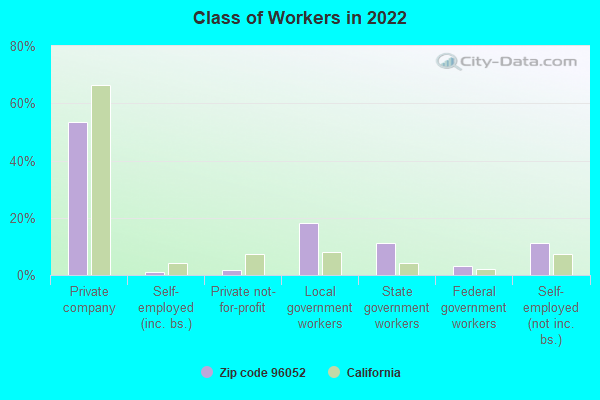
Top industries in this zip code by the number of employees in 2005:
Construction: Commercial and Institutional Building Construction (20-49 employees: 1 establishment)
Construction: New Single-Family Housing Construction (except Operative Builders) (10-19: 1)
Accommodation and Food Services: Hotels (except Casino Hotels) and Motels (10-19: 1)
Accommodation and Food Services: Full-Service Restaurants (5-9: 1, 1-4: 1)
Professional, Scientific, and Technical Services: Veterinary Services (5-9: 1)
Other Services (except Public Administration): Automotive Glass Replacement Shops (5-9: 1)
Construction: Drywall and Insulation Contractors (1-4: 2)
Utilities: Water Supply and Irrigation Systems (1-4: 2)
People in group quarters in 2010:
102 people in state prisons
People in group quarters in 2000:
129 people in state prisons
Fatal accident statistics in 2014:
Fatal accident count: 1
Vehicles involved in fatal accidents: 1
Fatal accidents caused by drunken drivers: 1
Fatalities: 1
Persons involved in fatal accidents: 1
Pedestrians involved in fatal accidents: 0
Fatal accident statistics in 2010:
Fatal accident count: 2
Vehicles involved in fatal accidents: 3
Fatal accidents caused by drunken drivers: 1
Fatalities: 2
Persons involved in fatal accidents: 3
Pedestrians involved in fatal accidents: 0
2005 - 2018 National Fire Incident Reporting System (NFIRS) incidents
Based on the data from the years 2005 - 2018 the average number of fires per year is 11. The highest number of fires - 27 took place in 2009, and the least - 1 in 2005. The data has an increasing trend.
When looking into fire subcategories, the most incidents belonged to: Outside Fires (60.4%), and Structure Fires (26.4%).
Fire incident types reported to NFIRS in Zip Code 96052


 Nearest zip codes: 96093, 96024, 96087, 96048, 96033, 96091.


 Based on the data from the years 2005 - 2018 the average number of fires per year is 11. The highest number of fires - 27 took place in 2009, and the least - 1 in 2005. The data has an increasing trend.
 When looking into fire subcategories, the most incidents belonged to: Outside Fires (60.4%), and Structure Fires (26.4%).