Estimated zip code population in 2022: 1,967 Zip code population in 2010: 1,323 Zip code population in 2000: 795
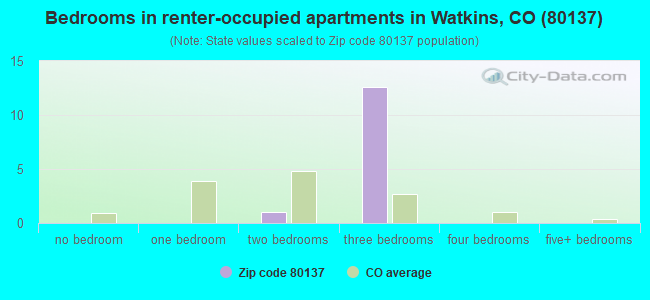
Houses and condos: 578 Renter-occupied apartments: 13
% of renters here:
2%
State:
34%
March 2022 cost of living index in zip code 80137: 98.1 (near average, U.S. average is 100)
Land area: 104.6 sq. mi. Water area: 0.6 sq. mi.
Population density: 19 people per square mile
(very low).
OSM Map
General Map
Google Map
MSN Map
OSM Map
General Map
Google Map
MSN Map
OSM Map
General Map
Google Map
MSN Map
OSM Map
General Map
Google Map
MSN Map
Please wait while loading the map...
Real estate property taxes paid for housing units in 2022:
This zip code:
0.4% ($2,670)
Colorado:
0.5% ($2,422)
Median real estate property taxes paid for housing units with mortgages in 2022: $2,771 (0.4%) Median real estate property taxes paid for housing units with no mortgage in 2022: $1,913 (0.4%)
Business Search- 14 Million verified businesses
Males: 1,133
(57.6%)
Females: 833
(42.4%)
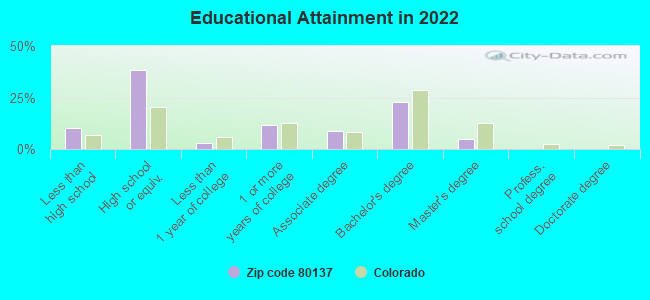
For population 25 years and over in 80137:
High school or higher: 86.9%
Bachelor's degree or higher: 27.0%
Graduate or professional degree: 4.9%
Unemployed: 3.3%
Mean travel time to work (commute): 35.8 minutes
For population 15 years and over in 80137:
Never married: 35.7%
Now married: 52.5%
Separated: 0.0%
Widowed: 1.9%
Divorced: 9.8%
Zip code 80137 compared to state average:
Median household income above state average.
Black race population percentage above state average.
Median age below state average.
Renting percentage significantly below state average.
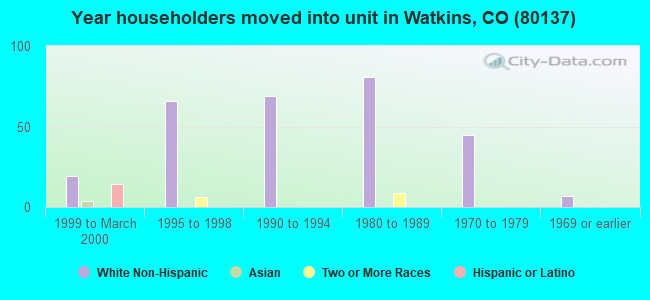
Length of stay since moving in below state average.
House age below state average.
Percentage of population with a bachelor's degree or higher below state average.
Estimated median house/condo value in 2022: $693,086
80137:
$693,086
Colorado:
$531,100
According to our research of Colorado and other state lists, there were 4 registered sex offenders living in 80137 zip code as of July 02, 2024. The ratio of all residents to sex offenders in zip code 80137 is 395 to 1. The ratio of registered sex offenders to all residents in this zip code is near the state average.
Median resident age:
This zip code:
30.3 years
Colorado median age:
37.7 years
Average household size:
This zip code:
2.8 people
Colorado:
2.4 people
Averages for the 2020 tax year for zip code 80137, filed in 2021:
Average Adjusted Gross Income (AGI) in 2020: $96,975 (Individual Income Tax Returns)
Here:
$96,975
State:
$89,260
Salary/wage: $73,918 (reported on 78.1% of returns)
Here:
$73,918
State:
$70,330
(% of AGI for various income ranges: 1148.0% for AGIs below $25k, 4058.8% for AGIs $25k-50k, 6822.9% for AGIs $50k-75k, 10795.0% for AGIs $75k-100k, 15925.0% for AGIs $100k-200k)
Taxable interest for individuals: $668 (reported on 39.1% of returns)
This zip code:
$668
Colorado:
$2,176
(% of AGI for various income ranges: 11.0% for AGIs below $25k, 13.8% for AGIs $25k-50k, 41.4% for AGIs $50k-75k, 17.5% for AGIs $75k-100k, 60.0% for AGIs $100k-200k)
Ordinary dividends: $2,123 (reported on 20.3% of returns)
Here:
$2,123
State:
$8,820
(% of AGI for various income ranges: 30.0% for AGIs below $25k, 91.4% for AGIs $50k-75k, 136.2% for AGIs $100k-200k)
Net capital gain/loss in AGI: +$13,738 (reported on 20.3% of returns)
Here:
+$13,738
State:
+$37,276
(% of AGI for various income ranges: 47.0% for AGIs below $25k, 60.0% for AGIs $50k-75k, 323.8% for AGIs $100k-200k)
Profit/loss from business: +$16,058 (reported on 18.8% of returns)
Here:
+$16,058
State:
+$15,295
(% of AGI for various income ranges: 221.0% for AGIs below $25k, 410.0% for AGIs $25k-50k, 665.7% for AGIs $50k-75k, 1140.0% for AGIs $100k-200k)
Taxable individual retirement arrangement distribution: $16,200 (reported on 7.8% of returns)
80137:
$16,200
Colorado:
$23,785
(% of AGI for various income ranges: 282.5% for AGIs $25k-50k, 730.0% for AGIs $100k-200k)
Total itemized deductions: $30,112 (reported on 12.5% of returns)
Here:
$30,112
State:
$35,141
(% of AGI for various income ranges: 813.7% for AGIs $25k-50k, 1175.0% for AGIs $100k-200k)
Charity contributions: $6,800 (reported on 7.8% of returns)
Here:
$6,800
State:
$12,103
(% of AGI for various income ranges: 225.0% for AGIs $100k-200k)
Taxes paid: $9,157 (reported on 10.9% of returns)
80137:
$9,157
State:
$7,710
(% of AGI for various income ranges: 165.0% for AGIs $25k-50k, 338.8% for AGIs $100k-200k)
Earned income credit: $2,120 (reported on 7.8% of returns)
Here:
$2,120
State:
$2,053
(% of AGI for various income ranges: 106.0% for AGIs below $25k)
Percentage of individuals using paid preparers for their 2020 taxes: 90.6%
Here:
91%
State:
93%
(% for various income ranges: 86.7% for AGIs below $25k, 92.3% for AGIs $25k-50k, 100.0% for AGIs $50k-75k, 85.7% for AGIs $75k-100k, 92.3% for AGIs $100k-200k, 83.3% for AGIs over 200k)
Averages for the 2012 tax year for zip code 80137, filed in 2013:
Average Adjusted Gross Income (AGI) in 2012: $70,340 (Individual Income Tax Returns)
Here:
$70,340
State:
$69,103
Salary/wage: $60,818 (reported on 84.5% of returns)
Here:
$60,818
State:
$54,794
(% of AGI for various income ranges: 69.1% for AGIs below $25k, 79.3% for AGIs $25k-50k, 74.0% for AGIs $50k-75k, 74.1% for AGIs $75k-100k, 79.2% for AGIs $100k-200k, 63.0% for AGIs over 200k)
Taxable interest for individuals: $1,032 (reported on 37.9% of returns)
This zip code:
$1,032
Colorado:
$1,971
(% of AGI for various income ranges: 1.3% for AGIs below $25k, 0.3% for AGIs $25k-50k, 1.5% for AGIs $50k-75k, 0.4% for AGIs $75k-100k, 0.7% for AGIs over 200k)
Ordinary dividends: $2,275 (reported on 20.7% of returns)
Here:
$2,275
State:
$7,140
(% of AGI for various income ranges: 1.5% for AGIs $25k-50k, 1.0% for AGIs $75k-100k, 1.2% for AGIs $100k-200k)
Net capital gain/loss in AGI: +$1,220 (reported on 17.2% of returns)
Here:
+$1,220
State:
+$23,009
(% of AGI for various income ranges: 0.6% for AGIs $75k-100k, 0.8% for AGIs $100k-200k)
Profit/loss from business: +$13,164 (reported on 19.0% of returns)
Here:
+$13,164
State:
+$13,514
(% of AGI for various income ranges: 14.0% for AGIs below $25k, 9.1% for AGIs $50k-75k, 5.4% for AGIs $100k-200k)
Taxable individual retirement arrangement distribution: $13,575 (reported on 6.9% of returns)
80137:
$13,575
Colorado:
$17,927
Total itemized deductions: $24,962 (20% of AGI, reported on 41.4% of returns)
Here:
$24,962
State:
$24,621
Here:
20.2% of AGI
State:
18.5% of AGI
(% of AGI for various income ranges: 22.6% for AGIs below $25k, 7.3% for AGIs $25k-50k, 14.3% for AGIs $50k-75k, 17.2% for AGIs $75k-100k, 16.5% for AGIs $100k-200k, 12.8% for AGIs over 200k)
Charity contributions: $3,026 (reported on 32.8% of returns)
Here:
$3,026
State:
$4,449
(% of AGI for various income ranges: 0.8% for AGIs $50k-75k, 2.5% for AGIs $75k-100k, 1.8% for AGIs $100k-200k, 1.5% for AGIs over 200k)
Taxes paid: $7,125 (reported on 41.4% of returns)
80137:
$7,125
State:
$7,641
(% of AGI for various income ranges: 2.8% for AGIs below $25k, 1.3% for AGIs $25k-50k, 3.2% for AGIs $50k-75k, 4.6% for AGIs $75k-100k, 5.0% for AGIs $100k-200k, 5.0% for AGIs over 200k)
Earned income credit: $1,517 (reported on 10.3% of returns)
Here:
$1,517
State:
$2,095
(% of AGI for various income ranges: 4.3% for AGIs below $25k)
Percentage of individuals using paid preparers for their 2012 taxes: 51.7%
Here:
52%
State:
49%
(% for various income ranges: 38.9% for AGIs below $25k, 50.0% for AGIs $25k-50k, 66.7% for AGIs $50k-75k, 57.1% for AGIs $75k-100k, 55.6% for AGIs $100k-200k, 66.7% for AGIs over 200k)
Averages for the 2004 tax year for zip code 80137, filed in 2005:
Average Adjusted Gross Income (AGI) in 2004: $51,670 (Individual Income Tax Returns)
Here:
$51,670
State:
$55,014
Salary/wage: $48,642 (reported on 82.6% of returns)
Here:
$48,642
State:
$46,010
(% of AGI for various income ranges: 70.7% for AGIs $10k-25k, 74.2% for AGIs $25k-50k, 80.2% for AGIs $50k-75k, 81.9% for AGIs $75k-100k, 70.4% for AGIs over 100k)
Taxable interest for individuals: $1,264 (reported on 52.8% of returns)
This zip code:
$1,264
Colorado:
$2,127
(% of AGI for various income ranges: 1.3% for AGIs $10k-25k, 0.9% for AGIs $25k-50k, 1.7% for AGIs $50k-75k, 0.5% for AGIs $75k-100k, 1.4% for AGIs over 100k)
Taxable dividends: $1,264 (reported on 25.3% of returns)
Here:
$1,264
State:
$3,782
(% of AGI for various income ranges: 1.4% for AGIs $10k-25k, 1.4% for AGIs $25k-50k, 0.3% for AGIs $50k-75k, 0.4% for AGIs $75k-100k, 0.4% for AGIs over 100k)
Net capital gain/loss: +$7,516 (reported on 19.2% of returns)
Here:
+$7,516
State:
+$17,882
(% of AGI for various income ranges: 0.3% for AGIs $10k-25k, 0.6% for AGIs $25k-50k, 3.6% for AGIs $50k-75k, 1.4% for AGIs $75k-100k, 4.5% for AGIs over 100k)
Profit/loss from business: +$9,576 (reported on 18.6% of returns)
Here:
+$9,576
State:
+$11,247
(% of AGI for various income ranges: 6.8% for AGIs $10k-25k, 7.1% for AGIs $25k-50k, 4.0% for AGIs $50k-75k, 3.0% for AGIs over 100k)
Total itemized deductions: $20,538 (25% of AGI, reported on 48.6% of returns)
Here:
$20,538
State:
$20,560
Here:
25.3% of AGI
State:
21.4% of AGI
(% of AGI for various income ranges: 14.6% for AGIs $10k-25k, 16.4% for AGIs $25k-50k, 23.3% for AGIs $50k-75k, 23.1% for AGIs $75k-100k, 16.6% for AGIs over 100k)
Charity contributions deductions: $2,425 (3% of AGI, reported on 41.9% of returns)
Here:
$2,425
State:
$3,518
Here:
2.9% of AGI
State:
3.4% of AGI
(% of AGI for various income ranges: 1.6% for AGIs $25k-50k, 3.2% for AGIs $50k-75k, 1.7% for AGIs $75k-100k, 1.9% for AGIs over 100k)
Total tax: $7,175 (reported on 81.2% of returns)
80137:
$7,175
State:
$9,173
(% of AGI for various income ranges: 5.4% for AGIs $10k-25k, 7.6% for AGIs $25k-50k, 8.2% for AGIs $50k-75k, 9.8% for AGIs $75k-100k, 15.4% for AGIs over 100k)
Earned income credit: $1,472 (reported on 7.3% of returns)
Here:
$1,472
State:
$1,595
Percentage of individuals using paid preparers for their 2004 taxes: 60.3%
Here:
60%
State:
55%
(% for various income ranges: 56.1% for AGIs below $10k, 53.4% for AGIs $10k-25k, 62.5% for AGIs $25k-50k, 61.0% for AGIs $50k-75k, 59.0% for AGIs $75k-100k, 71.0% for AGIs over 100k)
Likely homosexual households (counted as self-reported same-sex unmarried-partner households)
Lesbian couples: 0.0% of all households
Gay men: 0.6% of all households
Household received Food Stamps/SNAP in the past 12 months: 30 Household did not receive Food Stamps/SNAP in the past 12 months: 517
Women who had a birth in the past 12 months: 23 (24 now married, 0 unmarried) Women who did not have a birth in the past 12 months: 410 (253 now married, 155 unmarried)
Housing units in zip code 80137 with a mortgage: 423 (20 second mortgage, 21 both second mortgage and home equity loan) Houses without a mortgage: 8
Residents with income below the poverty level in 2022:
This zip code:
7.4%
Whole state:
9.4%
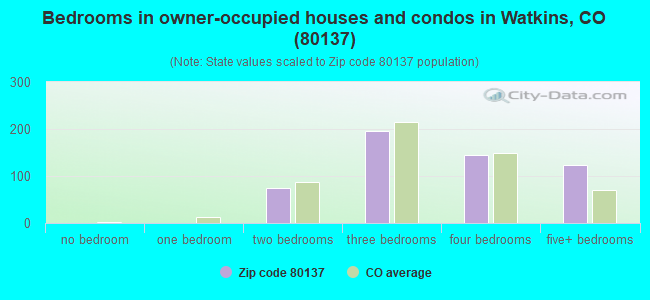
Median number of rooms in houses and condos:
Here:
7.0
State:
6.8
Notable locations in this zip code not listed on our city pages
Notable locations in zip code 80137: Bennett Fire Protection District Station 95 (A), Bennett Fire Protection District Station 92 (B). Display/hide their locations on the map
In group quarters: 413 (-1 institutionalized population)
Size of family households: 250 2-persons, 48 3-persons, 77 4-persons, 62 5-persons, 12 6-persons
Size of nonfamily households: 72 1-person, 19 2-persons
262 married couples with children.
0 single-parent households ().
74.4% of residents of 80137 zip code speak English at home.
22.7% of residents speak Spanish at home (98% very well, 2% well).
2.7% of residents speak other Indo-European language at home (69% very well, 31% well).
0.2% of residents speak other language at home (100% not well).
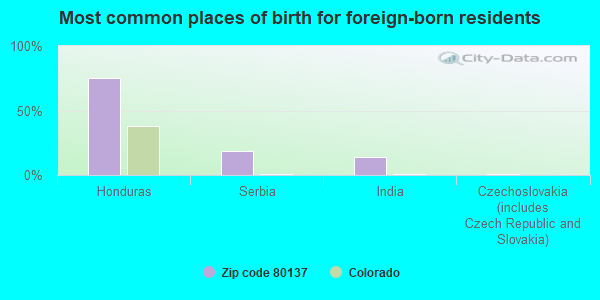
Foreign born population: 265 (13.5%) (29.4% of them are naturalized citizens)
This zip code:
13.5%
Whole state:
9.5%
75%Honduras
18%Serbia
14%India
1%Czechoslovakia (includes Czech Republic and Slovakia)
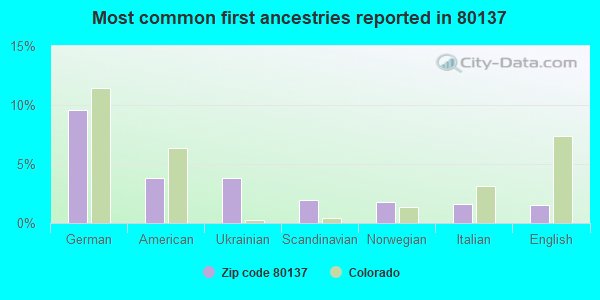
10%German
4%American
4%Ukrainian
2%Scandinavian
2%Norwegian
2%Italian
2%English
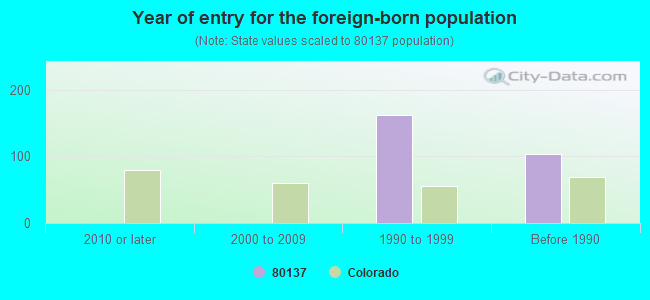
Year of entry for the foreign-born population
02010 or later
02000 to 2009
1621990 to 1999
103Before 1990
Facilities with environmental interests located in this zip code:
ALPINE DIESEL TOMAHAWK TRUCK SERVICE (1695 LESSIG DRIVE in WATKINS, CO)
AIR MINOR (AIRS/AFS) ENFORCEMENT/COMPLIANCE ACTIVITY (Integrated Compliance Information System) (Resource Conservation and Recovery Act (tracking hazardous waste)) Business SIC classification: AUTOMOBILES AND OTHER MOTOR VEHICLES; GASOLINE SERVICE STATIONS Organizations: HAUCK GERRY (CONTACT/OWNER)
Alternative names: TOMAHAWK TRUCK STOP, TOMAHAWK TRUCK STOPS, TOMAHAWK TRUCKS STOPS, TOMOHAWK TRUCK STOP
BRADLEY PETROLEUM INC NO 467 (810 US HIGHWAY 40 in WATKINS, CO)
AIR MINOR (AIRS/AFS) CRITERIA AND HAZARDOUS AIR POLLUTANT INVENTORY (Inventory of air pollution sources) Business SIC classification: GASOLINE SERVICE STATIONS
AMOCO - WATTENBERG GAS PROCESSING PLANT (4 MI E OF WATKINS in WATKINS, CO)
(Resource Conservation and Recovery Act (tracking hazardous waste)) Organizations: AMOCO PRODUCTION COMPANY (CONTACT/OWNER)
AEROSPACE REFINISH SERVICE INC. (5100 QUALL RUN #3 in WATKINS, CO)
(Resource Conservation and Recovery Act (tracking hazardous waste))
AIR CRAFTERS (51000 QUAL RD in WATKINS, CO)
(Resource Conservation and Recovery Act (tracking hazardous waste))
APPLIED RESEARCH ASSOCIATES (41801A E. QUINCY AVE in WATKINS, CO)
Conditionally Exempt Small Quantity Generators, less than 100 kg/month of hazardous waste (Resource Conservation and Recovery Act (tracking hazardous waste)) - notification HAZARDOUS WASTE BIENNIAL REPORTER (Resource Conservation and Recovery Act (tracking hazardous waste)) Organizations: JIMMIE BRATTON (CONTACT/OWNER)
BONANZA CREEK OIL - HANSON NO. 1 (SW SEC 30 T2S R64W in AURORA, CO)
AIR MINOR (AIRS/AFS) Business SIC classification: CRUDE PETROLEUM AND NATURAL GAS
BOX ELDER CREEK SAND PIT (4900 HUDSON MILE ROAD in WATKINS, CO)
National Pollutant Discharge Elimination System NON-MAJOR (Tracking pollutant discharge elimination systems) - permit Business SIC classification: CONSTRUCTION SAND AND GRAVEL Alternative names: RIO GRANDE COMPANY
BRADLEY PETROLEUM INCORPORATED NUMBER 467 (1710 LESSIG STREET in WATKINS, CO)
CRITERIA AND HAZARDOUS AIR POLLUTANT INVENTORY (Inventory of air pollution sources) Business SIC classification: GASOLINE SERVICE STATIONS
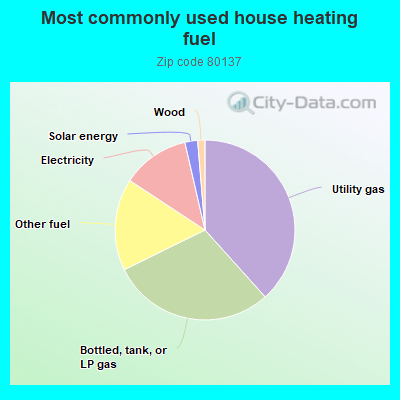
38.5%Utility gas
29.5%Bottled, tank, or LP gas
16.6%Other fuel
12.2%Electricity
2.3%Solar energy
1.3%Wood
Population in 1990: 406. Population change in the 1990s: +389 (+95.8%).
Place of birth for U.S.-born residents:
This state: 1,007
Northeast: 60
Midwest: 297
South: 113
West: 212
66% of the 80137 zip code residents lived in the same house 5 years ago. Out of people who lived in different houses, 26% lived in this county. Out of people who lived in different counties, 50% lived in Colorado.
97% of the 80137 zip code residents lived in the same house 1 year ago. Out of people who lived in different houses, 42% moved from this county. Out of people who lived in different houses, 45% moved from different county within same state. Out of people who lived in different houses, 19% moved from different state. Out of people who lived in different houses, 16% moved from abroad.
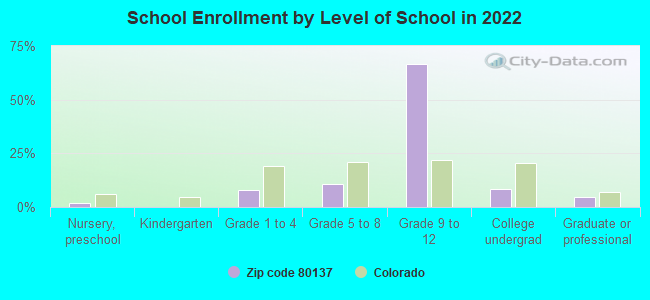
Private vs. public school enrollment:
Students in private schools in grades 1 to 8 (elementary and middle school): 16
Here:
13.1%
Colorado:
11.4%
Students in private schools in grades 9 to 12 (high school): 285
Here:
61.5%
Colorado:
8.5%
Students in private undergraduate colleges: 10
Here:
18.6%
Colorado:
14.0%
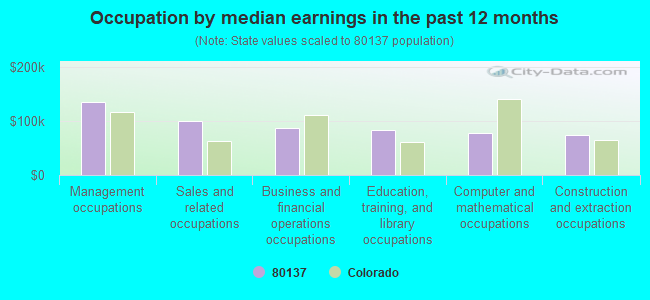
Occupation by median earnings in the past 12 months ($)
135,493Management occupations
99,379Sales and related occupations
87,560Business and financial operations occupations
83,425Education, training, and library occupations
77,172Computer and mathematical occupations
73,430Construction and extraction occupations
Top industries in this zip code by the number of employees in 2005:
Health Care and Social Assistance: Child and Youth Services (100-249 employees: 1 establishment)
Management of Companies and Enterprises: Corporate, Subsidiary, and Regional Managing Offices (50-99: 1)
Construction: Poured Concrete Foundation and Structure Contractors (20-49: 1, 10-19: 1)
Wholesale Trade: Other Chemical and Allied Products Merchant Wholesalers (10-19: 1)
Construction: Water and Sewer Line and Related Structures Construction (10-19: 1)
Other Services (except Public Administration): Pet Care (except Veterinary) Services (10-19: 1)
People in group quarters in 2010:
284 people in correctional facilities intended for juveniles
Fatal accident statistics in 2013:
Fatal accident count: 1
Vehicles involved in fatal accidents: 2
Fatal accidents caused by drunken drivers: 0
Fatalities: 1
Persons involved in fatal accidents: 1
Pedestrians involved in fatal accidents: 1
Fatal accident statistics in 2012:
Fatal accident count: 1
Vehicles involved in fatal accidents: 1
Fatal accidents caused by drunken drivers: 1
Fatalities: 1
Persons involved in fatal accidents: 1
Pedestrians involved in fatal accidents: 0
Home Mortgage Disclosure Act Aggregated Statistics For Year 2009 (Based on 6 partial tracts)
A) FHA, FSA/RHS & VA Home Purchase Loans
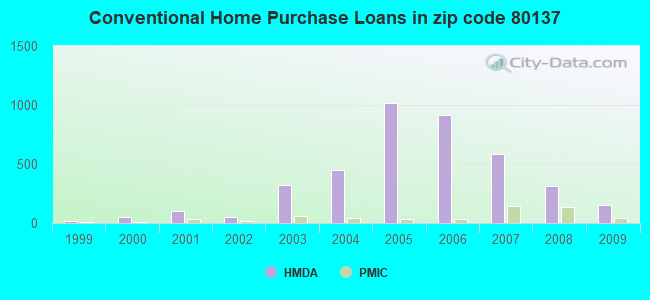
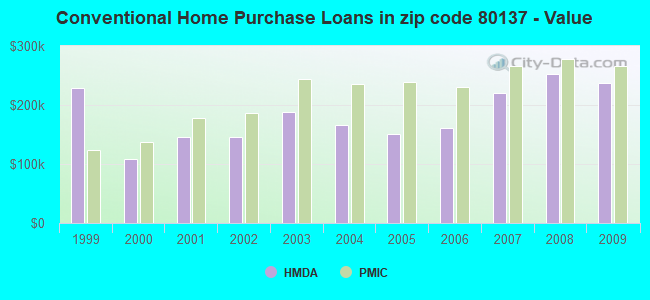
B) Conventional Home Purchase Loans
C) Refinancings
D) Home Improvement Loans
F) Non-occupant Loans on < 5 Family Dwellings (A B C & D)
G) Loans On Manufactured Home Dwelling (A B C & D)
Number
Average Value
Number
Average Value
Number
Average Value
Number
Average Value
Number
Average Value
Number
Average Value
LOANS ORIGINATED
282
$242,300
154
$237,524
628
$256,197
15
$65,080
23
$157,168
2
$125,895
APPLICATIONS APPROVED, NOT ACCEPTED
18
$235,414
18
$256,197
53
$232,791
3
$23,553
3
$212,210
2
$22,820
APPLICATIONS DENIED
47
$272,573
24
$227,242
212
$254,640
20
$65,692
12
$169,257
5
$155,856
APPLICATIONS WITHDRAWN
23
$268,962
19
$218,049
144
$259,132
2
$92,090
6
$154,165
0
$0
FILES CLOSED FOR INCOMPLETENESS
5
$289,044
6
$287,178
29
$270,456
1
$206,360
1
$295,650
0
$0
Aggregated Statistics For Year 2008 (Based on 6 partial tracts)
A) FHA, FSA/RHS & VA Home Purchase Loans
B) Conventional Home Purchase Loans
C) Refinancings
D) Home Improvement Loans
F) Non-occupant Loans on < 5 Family Dwellings (A B C & D)
G) Loans On Manufactured Home Dwelling (A B C & D)
Number
Average Value
Number
Average Value
Number
Average Value
Number
Average Value
Number
Average Value
Number
Average Value
LOANS ORIGINATED
242
$232,094
314
$252,682
257
$244,888
26
$66,540
49
$166,871
4
$201,030
APPLICATIONS APPROVED, NOT ACCEPTED
19
$255,307
67
$273,726
51
$229,683
8
$26,672
6
$140,380
0
$0
APPLICATIONS DENIED
50
$221,891
80
$231,246
209
$240,116
41
$59,437
23
$142,297
5
$80,286
APPLICATIONS WITHDRAWN
22
$239,987
50
$240,139
98
$241,739
4
$87,312
17
$160,269
0
$0
FILES CLOSED FOR INCOMPLETENESS
1
$135,690
4
$312,030
23
$233,840
3
$121,350
1
$220,310
0
$0
Aggregated Statistics For Year 2007 (Based on 6 partial tracts)
A) FHA, FSA/RHS & VA Home Purchase Loans
B) Conventional Home Purchase Loans
C) Refinancings
D) Home Improvement Loans
F) Non-occupant Loans on < 5 Family Dwellings (A B C & D)
G) Loans On Manufactured Home Dwelling (A B C & D)
Number
Average Value
Number
Average Value
Number
Average Value
Number
Average Value
Number
Average Value
Number
Average Value
LOANS ORIGINATED
90
$232,789
588
$220,256
312
$203,690
43
$56,956
67
$167,640
5
$125,842
APPLICATIONS APPROVED, NOT ACCEPTED
4
$266,985
97
$211,415
72
$201,467
13
$61,335
11
$147,975
1
$120,570
APPLICATIONS DENIED
20
$219,069
121
$217,720
331
$209,876
47
$81,144
34
$186,571
5
$88,128
APPLICATIONS WITHDRAWN
27
$208,394
160
$201,618
114
$212,681
9
$180,587
21
$162,265
0
$0
FILES CLOSED FOR INCOMPLETENESS
1
$228,840
15
$262,085
43
$215,724
3
$94,463
5
$243,826
0
$0
Aggregated Statistics For Year 2006 (Based on 6 partial tracts)
A) FHA, FSA/RHS & VA Home Purchase Loans
B) Conventional Home Purchase Loans
C) Refinancings
D) Home Improvement Loans
F) Non-occupant Loans on < 5 Family Dwellings (A B C & D)
G) Loans On Manufactured Home Dwelling (A B C & D)
Number
Average Value
Number
Average Value
Number
Average Value
Number
Average Value
Number
Average Value
Number
Average Value
LOANS ORIGINATED
71
$224,951
913
$160,930
406
$173,614
41
$54,091
145
$136,892
5
$113,650
APPLICATIONS APPROVED, NOT ACCEPTED
6
$237,948
132
$179,542
112
$178,671
14
$75,488
27
$201,238
3
$114,560
APPLICATIONS DENIED
8
$151,266
161
$160,533
324
$189,965
47
$72,636
52
$129,882
12
$52,080
APPLICATIONS WITHDRAWN
21
$195,220
167
$171,073
190
$194,929
7
$162,960
22
$152,846
1
$129,990
FILES CLOSED FOR INCOMPLETENESS
1
$192,440
14
$162,129
46
$198,281
1
$52,250
1
$215,090
0
$0
Aggregated Statistics For Year 2005 (Based on 6 partial tracts)
A) FHA, FSA/RHS & VA Home Purchase Loans
B) Conventional Home Purchase Loans
C) Refinancings
D) Home Improvement Loans
E) Loans on Dwellings For 5+ Families
F) Non-occupant Loans on < 5 Family Dwellings (A B C & D)
G) Loans On Manufactured Home Dwelling (A B C & D)
Number
Average Value
Number
Average Value
Number
Average Value
Number
Average Value
Number
Average Value
Number
Average Value
Number
Average Value
LOANS ORIGINATED
89
$199,550
1,019
$151,060
448
$180,072
39
$62,040
1
$236,780
128
$138,310
8
$77,174
APPLICATIONS APPROVED, NOT ACCEPTED
6
$207,355
114
$146,214
98
$176,240
8
$33,402
0
$0
15
$148,477
1
$20,500
APPLICATIONS DENIED
7
$202,297
194
$143,272
326
$186,561
46
$68,945
0
$0
26
$109,865
21
$67,926
APPLICATIONS WITHDRAWN
13
$216,077
193
$158,643
232
$191,955
20
$109,790
1
$100,010
23
$160,770
2
$147,065
FILES CLOSED FOR INCOMPLETENESS
1
$319,290
22
$143,285
38
$200,602
4
$55,498
0
$0
1
$314,800
0
$0
Aggregated Statistics For Year 2004 (Based on 6 partial tracts)
A) FHA, FSA/RHS & VA Home Purchase Loans
B) Conventional Home Purchase Loans
C) Refinancings
D) Home Improvement Loans
F) Non-occupant Loans on < 5 Family Dwellings (A B C & D)
G) Loans On Manufactured Home Dwelling (A B C & D)
Number
Average Value
Number
Average Value
Number
Average Value
Number
Average Value
Number
Average Value
Number
Average Value
LOANS ORIGINATED
105
$184,245
448
$166,825
437
$183,103
34
$61,522
43
$141,493
6
$90,145
APPLICATIONS APPROVED, NOT ACCEPTED
11
$212,761
65
$174,478
101
$187,305
9
$68,186
10
$121,914
10
$83,278
APPLICATIONS DENIED
11
$186,195
107
$156,221
312
$182,080
33
$39,452
9
$163,043
25
$82,956
APPLICATIONS WITHDRAWN
14
$187,911
61
$165,736
180
$199,682
6
$151,192
6
$179,712
1
$265,970
FILES CLOSED FOR INCOMPLETENESS
0
$0
13
$157,423
41
$198,050
2
$83,770
1
$235,300
0
$0
Aggregated Statistics For Year 2003 (Based on 6 partial tracts)
A) FHA, FSA/RHS & VA Home Purchase Loans
B) Conventional Home Purchase Loans
C) Refinancings
D) Home Improvement Loans
F) Non-occupant Loans on < 5 Family Dwellings (A B C & D)
Number
Average Value
Number
Average Value
Number
Average Value
Number
Average Value
Number
Average Value
LOANS ORIGINATED
135
$190,398
321
$188,248
653
$173,254
30
$38,727
39
$129,208
APPLICATIONS APPROVED, NOT ACCEPTED
5
$168,090
39
$166,109
109
$167,948
5
$41,076
6
$149,182
APPLICATIONS DENIED
15
$184,093
68
$161,506
259
$180,893
31
$29,300
11
$159,839
APPLICATIONS WITHDRAWN
16
$190,702
57
$185,891
159
$177,919
3
$54,537
5
$139,396
FILES CLOSED FOR INCOMPLETENESS
1
$125,000
9
$174,854
31
$193,621
2
$46,090
1
$148,820
Aggregated Statistics For Year 2002 (Based on 2 partial tracts)
A) FHA, FSA/RHS & VA Home Purchase Loans
B) Conventional Home Purchase Loans
C) Refinancings
D) Home Improvement Loans
E) Loans on Dwellings For 5+ Families
F) Non-occupant Loans on < 5 Family Dwellings (A B C & D)
Number
Average Value
Number
Average Value
Number
Average Value
Number
Average Value
Number
Average Value
Number
Average Value
LOANS ORIGINATED
65
$182,490
47
$145,387
236
$139,347
15
$22,057
1
$77,850
14
$120,206
APPLICATIONS APPROVED, NOT ACCEPTED
1
$184,890
8
$136,839
40
$136,191
5
$17,840
0
$0
1
$72,440
APPLICATIONS DENIED
4
$200,698
19
$115,916
81
$122,743
10
$14,488
0
$0
1
$135,150
APPLICATIONS WITHDRAWN
4
$198,130
7
$171,447
57
$144,663
2
$58,655
0
$0
2
$168,395
FILES CLOSED FOR INCOMPLETENESS
2
$145,690
1
$167,590
27
$148,845
1
$14,060
0
$0
1
$121,630
Aggregated Statistics For Year 2001 (Based on 2 partial tracts)
A) FHA, FSA/RHS & VA Home Purchase Loans
B) Conventional Home Purchase Loans
C) Refinancings
D) Home Improvement Loans
F) Non-occupant Loans on < 5 Family Dwellings (A B C & D)
Number
Average Value
Number
Average Value
Number
Average Value
Number
Average Value
Number
Average Value
LOANS ORIGINATED
99
$174,767
98
$146,199
205
$126,669
22
$25,040
15
$113,634
APPLICATIONS APPROVED, NOT ACCEPTED
3
$179,840
4
$120,282
30
$117,130
4
$26,625
1
$92,980
APPLICATIONS DENIED
3
$184,163
14
$104,181
99
$119,604
17
$22,165
2
$109,470
APPLICATIONS WITHDRAWN
2
$178,940
11
$139,868
59
$119,390
5
$36,760
2
$48,925
FILES CLOSED FOR INCOMPLETENESS
1
$176,780
2
$118,120
7
$123,951
1
$13,510
1
$71,360
Aggregated Statistics For Year 2000 (Based on 2 partial tracts)
A) FHA, FSA/RHS & VA Home Purchase Loans
B) Conventional Home Purchase Loans
C) Refinancings
D) Home Improvement Loans
E) Loans on Dwellings For 5+ Families
F) Non-occupant Loans on < 5 Family Dwellings (A B C & D)
Number
Average Value
Number
Average Value
Number
Average Value
Number
Average Value
Number
Average Value
Number
Average Value
LOANS ORIGINATED
57
$139,958
47
$108,534
71
$85,057
23
$24,609
1
$70,820
4
$135,150
APPLICATIONS APPROVED, NOT ACCEPTED
2
$94,605
11
$76,126
18
$94,034
8
$15,610
0
$0
2
$80,010
APPLICATIONS DENIED
1
$160,020
18
$92,473
55
$90,644
16
$17,908
0
$0
2
$84,605
APPLICATIONS WITHDRAWN
3
$132,987
9
$106,378
29
$81,183
4
$50,275
0
$0
2
$92,445
FILES CLOSED FOR INCOMPLETENESS
1
$142,720
1
$71,900
8
$109,269
1
$12,970
0
$0
0
$0
Aggregated Statistics For Year 1999 (Based on 1 full and 1 partial tracts)
A) FHA, FSA/RHS & VA Home Purchase Loans
B) Conventional Home Purchase Loans
C) Refinancings
D) Home Improvement Loans
F) Non-occupant Loans on < 5 Family Dwellings (A B C & D)
2003 - 2018 National Fire Incident Reporting System (NFIRS) incidents
According to the data from the years 2003 - 2018 the average number of fire incidents per year is 21. The highest number of fire incidents - 37 took place in 2016, and the least - 4 in 2014. The data has a growing trend.
When looking into fire subcategories, the most reports belonged to: Outside Fires (63.3%), and Mobile Property/Vehicle Fires (18.4%).
Fire incident types reported to NFIRS in Zip Code 80137

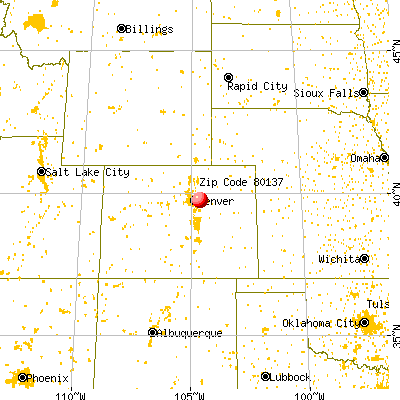


 Nearest zip codes: 80019, 80018, 80249, 80102, 80011, 80013.
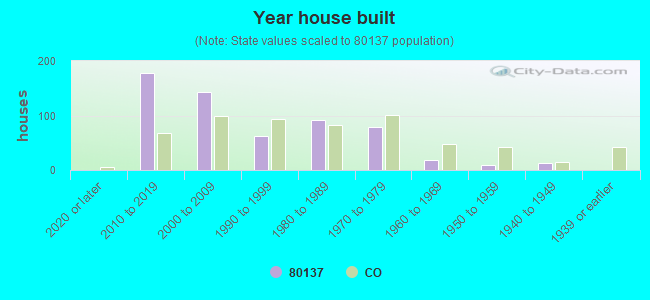


 According to the data from the years 2003 - 2018 the average number of fire incidents per year is 21. The highest number of fire incidents - 37 took place in 2016, and the least - 4 in 2014. The data has a growing trend.
 When looking into fire subcategories, the most reports belonged to: Outside Fires (63.3%), and Mobile Property/Vehicle Fires (18.4%).