Estimated zip code population in 2022: 4,866 Zip code population in 2010: 1,690 Zip code population in 2000: 61
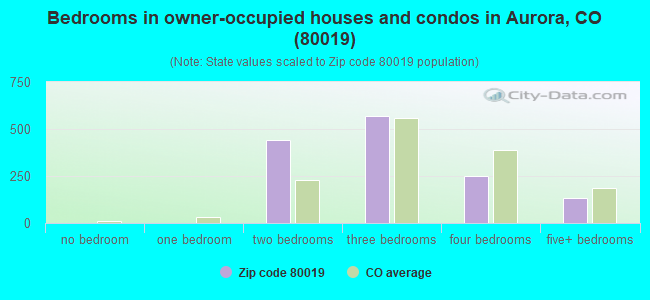
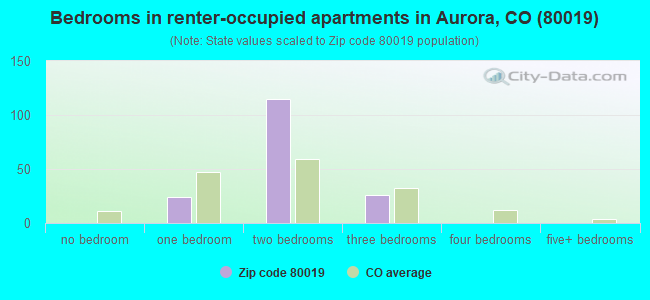
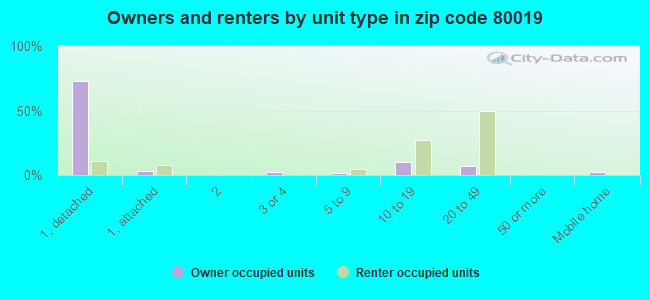
Houses and condos: 1,664 Renter-occupied apartments: 170
% of renters here:
11%
State:
34%
March 2022 cost of living index in zip code 80019: 106.6 (more than average, U.S. average is 100)
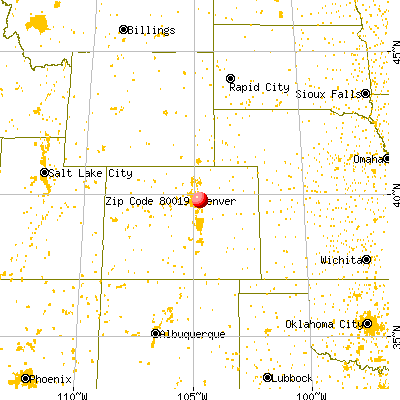
Land area: 24.6 sq. mi. Water area: 0.0 sq. mi.
Population density: 198 people per square mile
(very low).
OSM Map
General Map
Google Map
MSN Map
OSM Map
General Map
Google Map
MSN Map
OSM Map
General Map
Google Map
MSN Map
OSM Map
General Map
Google Map
MSN Map
Please wait while loading the map...
Real estate property taxes paid for housing units in 2022:
This zip code:
0.8% ($4,167)
Colorado:
0.5% ($2,422)
Median real estate property taxes paid for housing units with mortgages in 2022: $3,998 (0.8%) Median real estate property taxes paid for housing units with no mortgage in 2022: $4,458 (0.8%)
Business Search- 14 Million verified businesses
Males: 2,359
(48.5%)
Females: 2,507
(51.5%)
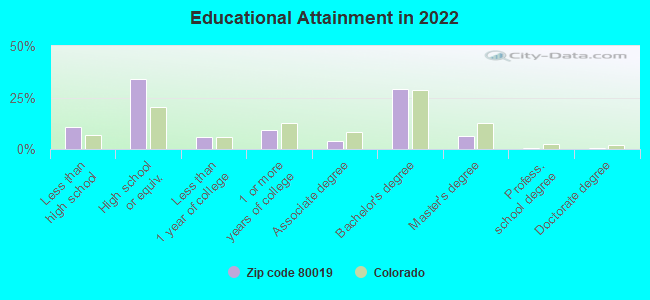
For population 25 years and over in 80019:
High school or higher: 89.5%
Bachelor's degree or higher: 36.4%
Graduate or professional degree: 7.0%
Unemployed: 1.2%
Mean travel time to work (commute): 25.5 minutes
For population 15 years and over in 80019:
Never married: 38.4%
Now married: 47.1%
Separated: 1.9%
Widowed: 3.1%
Divorced: 9.5%
Zip code 80019 compared to state average:
Unemployed percentage significantly below state average.
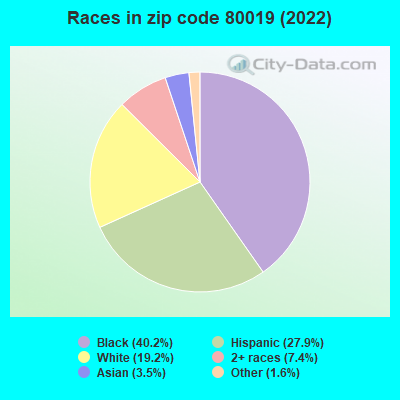
Black race population percentage significantly above state average.
Median age below state average.
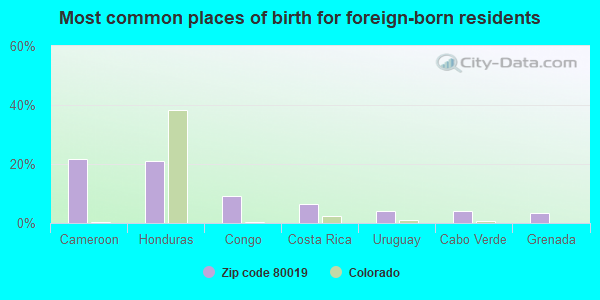
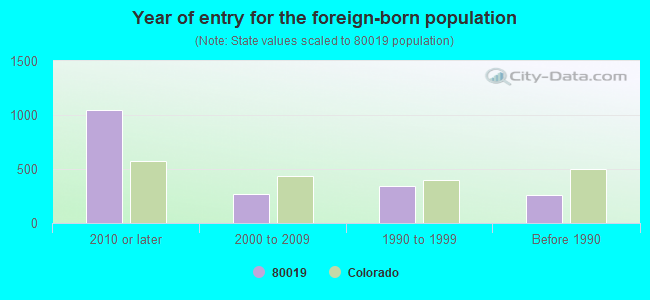
Foreign-born population percentage significantly above state average.
Renting percentage significantly below state average.
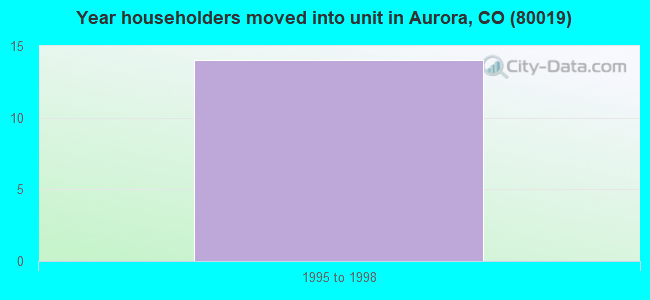
Length of stay since moving in significantly below state average.
Averages for the 2020 tax year for zip code 80019, filed in 2021:
Average Adjusted Gross Income (AGI) in 2020: $64,402 (Individual Income Tax Returns)
Here:
$64,402
State:
$89,260
Salary/wage: $59,790 (reported on 89.7% of returns)
Here:
$59,790
State:
$70,330
(% of AGI for various income ranges: 1204.4% for AGIs below $25k, 3861.8% for AGIs $25k-50k, 7348.0% for AGIs $50k-75k, 11163.9% for AGIs $75k-100k, 19923.3% for AGIs $100k-200k, 63075.0% for AGIs over 200k)
Taxable interest for individuals: $341 (reported on 16.4% of returns)
This zip code:
$341
Colorado:
$2,176
(% of AGI for various income ranges: 1.6% for AGIs below $25k, 3.5% for AGIs $25k-50k, 6.2% for AGIs $50k-75k, 9.1% for AGIs $75k-100k, 18.9% for AGIs $100k-200k, 155.0% for AGIs over 200k)
Ordinary dividends: $796 (reported on 8.2% of returns)
Here:
$796
State:
$8,820
(% of AGI for various income ranges: 4.3% for AGIs $25k-50k, 8.0% for AGIs $50k-75k, 5.7% for AGIs $75k-100k, 30.7% for AGIs $100k-200k, 145.0% for AGIs over 200k)
Net capital gain/loss in AGI: +$5,915 (reported on 9.6% of returns)
Here:
+$5,915
State:
+$37,276
(% of AGI for various income ranges: 12.0% for AGIs $25k-50k, 30.5% for AGIs $50k-75k, 54.3% for AGIs $75k-100k, 320.0% for AGIs $100k-200k, 2070.0% for AGIs over 200k)
Profit/loss from business: +$9,300 (reported on 18.9% of returns)
Here:
+$9,300
State:
+$15,295
(% of AGI for various income ranges: 142.2% for AGIs below $25k, 82.2% for AGIs $25k-50k, 240.5% for AGIs $50k-75k, 314.8% for AGIs $75k-100k, 755.2% for AGIs $100k-200k)
Taxable individual retirement arrangement distribution: $11,211 (reported on 3.2% of returns)
80019:
$11,211
Colorado:
$23,785
(% of AGI for various income ranges: 38.0% for AGIs $25k-50k, 57.0% for AGIs $50k-75k, 204.8% for AGIs $100k-200k)
Total itemized deductions: $25,574 (reported on 15.3% of returns)
Here:
$25,574
State:
$35,141
(% of AGI for various income ranges: 197.8% for AGIs $25k-50k, 527.2% for AGIs $50k-75k, 997.8% for AGIs $75k-100k, 1465.6% for AGIs $100k-200k, 7245.0% for AGIs over 200k)
Charity contributions: $4,834 (reported on 10.3% of returns)
Here:
$4,834
State:
$12,103
(% of AGI for various income ranges: 14.0% for AGIs $25k-50k, 51.7% for AGIs $50k-75k, 107.4% for AGIs $75k-100k, 254.1% for AGIs $100k-200k, 890.0% for AGIs over 200k)
Taxes paid: $7,228 (reported on 15.3% of returns)
80019:
$7,228
State:
$7,710
(% of AGI for various income ranges: 47.0% for AGIs $25k-50k, 154.2% for AGIs $50k-75k, 283.9% for AGIs $75k-100k, 482.6% for AGIs $100k-200k, 1265.0% for AGIs over 200k)
Earned income credit: $2,212 (reported on 14.6% of returns)
Here:
$2,212
State:
$2,053
(% of AGI for various income ranges: 101.4% for AGIs below $25k, 66.7% for AGIs $25k-50k)
Percentage of individuals using paid preparers for their 2020 taxes: 94.3%
Here:
94%
State:
93%
(% for various income ranges: 93.8% for AGIs below $25k, 93.3% for AGIs $25k-50k, 94.4% for AGIs $50k-75k, 94.1% for AGIs $75k-100k, 95.7% for AGIs $100k-200k, 100.0% for AGIs over 200k)
Averages for the 2012 tax year for zip code 80019, filed in 2013:
Average Adjusted Gross Income (AGI) in 2012: $47,864 (Individual Income Tax Returns)
Here:
$47,864
State:
$69,103
Salary/wage: $46,551 (reported on 92.1% of returns)
Here:
$46,551
State:
$54,794
(% of AGI for various income ranges: 82.2% for AGIs below $25k, 92.3% for AGIs $25k-50k, 90.2% for AGIs $50k-75k, 92.7% for AGIs $75k-100k, 87.3% for AGIs $100k-200k)
Taxable interest for individuals: $118 (reported on 19.1% of returns)
This zip code:
$118
Colorado:
$1,971
(% of AGI for various income ranges: )
Ordinary dividends: $671 (reported on 7.9% of returns)
Here:
$671
State:
$7,140
Profit/loss from business: +$6,620 (reported on 11.2% of returns)
Here:
+$6,620
State:
+$13,514
(% of AGI for various income ranges: 7.1% for AGIs below $25k, 2.6% for AGIs $25k-50k, 1.2% for AGIs $50k-75k)
Taxable individual retirement arrangement distribution: $6,500 (reported on 2.2% of returns)
80019:
$6,500
Colorado:
$17,927
Total itemized deductions: $16,595 (24% of AGI, reported on 42.7% of returns)
Here:
$16,595
State:
$24,621
Here:
23.6% of AGI
State:
18.5% of AGI
(% of AGI for various income ranges: 15.8% for AGIs $25k-50k, 18.4% for AGIs $50k-75k, 17.0% for AGIs $75k-100k, 14.4% for AGIs $100k-200k)
Charity contributions: $2,646 (reported on 29.2% of returns)
Here:
$2,646
State:
$4,449
(% of AGI for various income ranges: 1.1% for AGIs $25k-50k, 1.8% for AGIs $50k-75k, 2.1% for AGIs $75k-100k, 2.1% for AGIs $100k-200k)
Taxes paid: $4,565 (reported on 41.6% of returns)
80019:
$4,565
State:
$7,641
(% of AGI for various income ranges: 3.3% for AGIs $25k-50k, 4.3% for AGIs $50k-75k, 4.9% for AGIs $75k-100k, 5.0% for AGIs $100k-200k)
Earned income credit: $2,240 (reported on 16.9% of returns)
Here:
$2,240
State:
$2,095
(% of AGI for various income ranges: 5.8% for AGIs below $25k, 1.1% for AGIs $25k-50k)
Percentage of individuals using paid preparers for their 2012 taxes: 47.2%
Here:
47%
State:
49%
(% for various income ranges: 44.4% for AGIs below $25k, 46.7% for AGIs $25k-50k, 50.0% for AGIs $50k-75k, 57.1% for AGIs $75k-100k, 44.4% for AGIs $100k-200k)
Averages for the 2004 tax year for zip code 80019, filed in 2005:
Average Adjusted Gross Income (AGI) in 2004: $45,434 (Individual Income Tax Returns)
Here:
$45,434
State:
$55,014
Salary/wage: $43,054 (reported on 96.4% of returns)
Here:
$43,054
State:
$46,010
(% of AGI for various income ranges: 99.0% for AGIs below $10k, 93.4% for AGIs $10k-25k, 93.9% for AGIs $25k-50k, 95.6% for AGIs $50k-75k, 89.8% for AGIs $75k-100k, 83.0% for AGIs over 100k)
Taxable interest for individuals: $196 (reported on 29.1% of returns)
This zip code:
$196
Colorado:
$2,127
(% of AGI for various income ranges: 0.2% for AGIs $10k-25k, 0.1% for AGIs $25k-50k, 0.0% for AGIs $50k-75k, 0.1% for AGIs $75k-100k, 0.3% for AGIs over 100k)
Taxable dividends: $345 (reported on 9.4% of returns)
Here:
$345
State:
$3,782
(% of AGI for various income ranges: 0.1% for AGIs $25k-50k, 0.0% for AGIs $50k-75k, 0.0% for AGIs $75k-100k, 0.1% for AGIs over 100k)
Net capital gain/loss: +$365 (reported on 8.5% of returns)
Here:
+$365
State:
+$17,882
Profit/loss from business: +$5,115 (reported on 9.9% of returns)
Here:
+$5,115
State:
+$11,247
Total itemized deductions: $16,981 (29% of AGI, reported on 59.3% of returns)
Here:
$16,981
State:
$20,560
Here:
28.7% of AGI
State:
21.4% of AGI
(% of AGI for various income ranges: 18.7% for AGIs $10k-25k, 24.1% for AGIs $25k-50k, 22.3% for AGIs $50k-75k, 24.5% for AGIs $75k-100k, 19.6% for AGIs over 100k)
Charity contributions deductions: $2,157 (3% of AGI, reported on 44.6% of returns)
Here:
$2,157
State:
$3,518
Here:
3.4% of AGI
State:
3.4% of AGI
(% of AGI for various income ranges: 1.5% for AGIs $10k-25k, 2.3% for AGIs $25k-50k, 1.5% for AGIs $50k-75k, 3.1% for AGIs $75k-100k, 2.0% for AGIs over 100k)
Total tax: $4,935 (reported on 80.5% of returns)
80019:
$4,935
State:
$9,173
(% of AGI for various income ranges: 3.0% for AGIs below $10k, 3.3% for AGIs $10k-25k, 7.1% for AGIs $25k-50k, 8.2% for AGIs $50k-75k, 9.3% for AGIs $75k-100k, 13.6% for AGIs over 100k)
Earned income credit: $1,776 (reported on 12.4% of returns)
Here:
$1,776
State:
$1,595
Percentage of individuals using paid preparers for their 2004 taxes: 49.4%
Here:
49%
State:
55%
(% for various income ranges: 45.0% for AGIs below $10k, 47.4% for AGIs $10k-25k, 48.7% for AGIs $25k-50k, 58.3% for AGIs $50k-75k, 42.9% for AGIs $75k-100k, 52.2% for AGIs over 100k)
Likely homosexual households (counted as self-reported same-sex unmarried-partner households)
Lesbian couples: 0.0% of all households
Gay men: 1.0% of all households
Household received Food Stamps/SNAP in the past 12 months: 57 Household did not receive Food Stamps/SNAP in the past 12 months: 1,502
Women who had a birth in the past 12 months: 98 (88 now married, 11 unmarried) Women who did not have a birth in the past 12 months: 1,519 (649 now married, 870 unmarried)
Housing units in zip code 80019 with a mortgage: 1,128 (15 second mortgage, 16 both second mortgage and home equity loan) Median monthly owner costs for units with a mortgage: $2,347 Median monthly owner costs for units without a mortgage: $765
Residents with income below the poverty level in 2022:
This zip code:
0.6%
Whole state:
9.4%
Median number of rooms in houses and condos:
Here:
5.8
State:
6.8
Median number of rooms in apartments:
Here:
4.9
State:
4.0
Notable locations in this zip code not listed on our city pages
Size of family households: 389 2-persons, 244 3-persons, 192 4-persons, 36 5-persons, 132 6-persons, 87 7-or-more-persons
Size of nonfamily households: 325 1-person, 122 2-persons, 33 3-persons
603 married couples with children.
219 single-parent households (88 men, 131 women).
54.9% of residents of 80019 zip code speak English at home.
18.5% of residents speak Spanish at home (54% very well, 25% well, 21% not well).
11.0% of residents speak other Indo-European language at home (57% very well, 43% well).
4.0% of residents speak Asian or Pacific Island language at home (72% very well, 28% not well).
11.7% of residents speak other language at home (41% very well, 29% well, 11% not well, 19% not at all).
Foreign born population: 1,711 (35.2%) (68.6% of them are naturalized citizens)
This zip code:
35.2%
Whole state:
9.5%
22%Cameroon
21%Honduras
9%Congo
6%Costa Rica
4%Uruguay
4%Cabo Verde
3%Grenada
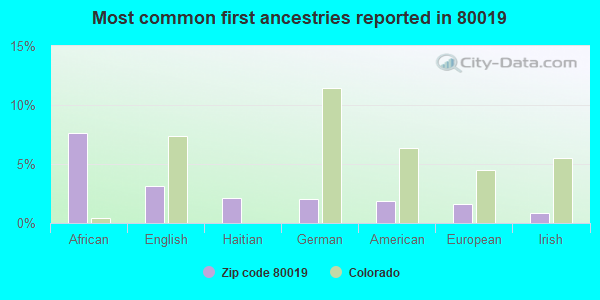
8%African
3%English
2%Haitian
2%German
2%American
2%European
1%Irish
Year of entry for the foreign-born population
1,0442010 or later
2732000 to 2009
3381990 to 1999
263Before 1990
Facilities with environmental interests located in this zip code:
BLUE SPRUCE ENERGY CENTER (SMITH RD AT POWHATON RD in AURORA, CO)
AIR MAJOR (AIRS/AFS) AIR PROGRAM (Clean Air Markets Division Business System) OIL CONTROL (Facility Response Plan for oil discharge) Business SIC classification: ELECTRIC SERVICES Organizations: CALPINE CORPORATION (CONTACT/GENERAL)
, BLUE SPRUCE ENERGY CENTER, LLC (OWNER/OPERATOR)
Alternative names: BLUE SPRUCE ENERGY CENTER LLC
GM SERVICE & PARTS OPERATIONS PLANT #22 (23400 E SMITH RD in AURORA, CO)
Conditionally Exempt Small Quantity Generators, less than 100 kg/month of hazardous waste (Resource Conservation and Recovery Act (tracking hazardous waste)) Organizations: GENERAL MOTORS CORPORATION (CONTACT/OWNER)
CSI TRUCKING INC (2401 PICADILLY RD in AURORA, CO)
AIR SYNTHETIC MINOR (AIRS/AFS) Business SIC classification: LOCAL TRUCKING WITHOUT STORAGE
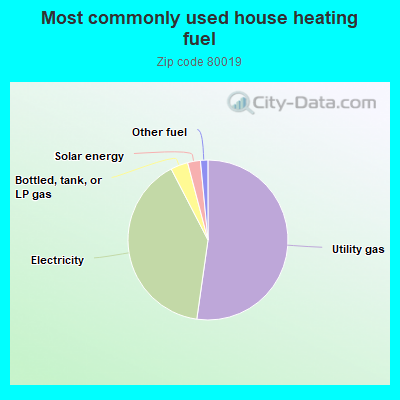
52.3%Utility gas
40.2%Electricity
3.5%Bottled, tank, or LP gas
2.6%Solar energy
1.5%Other fuel
Population in 1990: 46. Population change in the 1990s: +15 (+32.6%).
Place of birth for U.S.-born residents:
This state: 1,468
Northeast: 172
Midwest: 308
South: 629
West: 460
6% of the 80019 zip code residents lived in the same house 5 years ago. Out of people who lived in different houses, 22% lived in this county. Out of people who lived in different counties, 50% lived in Colorado.
84% of the 80019 zip code residents lived in the same house 1 year ago. Out of people who lived in different houses, 11% moved from this county. Out of people who lived in different houses, 76% moved from different county within same state. Out of people who lived in different houses, 11% moved from different state. Out of people who lived in different houses, 6% moved from abroad.
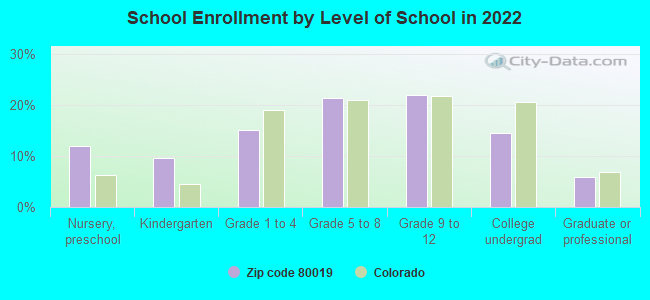
Private vs. public school enrollment:
Students in private schools in grades 1 to 8 (elementary and middle school):
Here:
0.0%
Colorado:
11.4%
Students in private schools in grades 9 to 12 (high school):
Here:
0.0%
Colorado:
8.5%
Students in private undergraduate colleges:
Here:
0.0%
Colorado:
14.0%
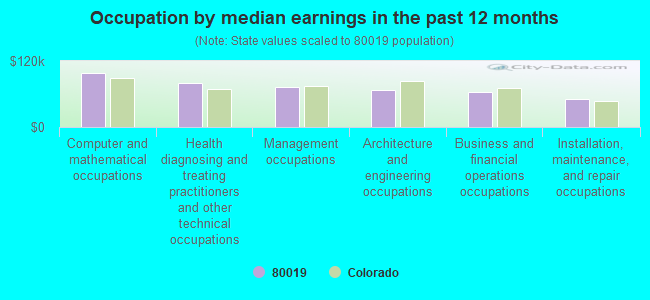
Occupation by median earnings in the past 12 months ($)
98,040Computer and mathematical occupations
80,331Health diagnosing and treating practitioners and other technical occupations
72,424Management occupations
66,952Architecture and engineering occupations
64,406Business and financial operations occupations
50,486Installation, maintenance, and repair occupations
Companies with federal contracts located in this zip code:
PHILLIPS TWO, INC (19575 E 58TH DRIVE in AURORA, CO; small business) : $81,021 in 14 contractsfrom 2005 to 2006
Contracts for Semiconductor Devices and Associated Hardware, Microcircuits, Electronic, Circuit Breakers, Aircraft Air Conditioning, Heating, and Pressurizing Equipment, and moreby Defense Logistics Agency Signed by year:2000: $0; 2001: $0; 2002: $0; 2003: $0; 2004: $0; 2005: $55,912; 2006: $25,109.
Biggest contracts:
$12,510 with Defense Logistics Agency for Semiconductor Devices and Associated Hardware. Signed on 2005-09-28. Completion date: 2005-10-27.
$10,134, same as above.Signed on 2005-04-15. Completion date: 2005-05-18.
$8,964, same as above.Signed on 2005-10-19. Completion date: 2005-11-19.
$7,650 with Defense Logistics Agency for Microcircuits, Electronic. Signed on 2005-06-15. Completion date: 2005-07-16.
Top industries in this zip code by the number of employees in 2005:
Other Services (except Public Administration): Parking Lots and Garages (20-49 employees: 1 establishment)
Utilities: Natural Gas Distribution (20-49: 1)
Health Care and Social Assistance: Other Residential Care Facilities (5-9: 1)
Utilities: Fossil Fuel Electric Power Generation (5-9: 1)
Real Estate and Rental and Leasing: Passenger Car Rental (5-9: 1)
Administrative and Support and Waste Management and Remediation Services: Court Reporting and Stenotype Services (1-4: 1)
Administrative and Support and Waste Management and Remediation Services: Solid Waste Collection (1-4: 1)
Real Estate and Rental and Leasing: Offices of Real Estate Agents and Brokers (1-4: 1)
People in group quarters in 2000:
21 people in halfway houses
Fatal accident statistics in 2014:
Fatal accident count: 1
Vehicles involved in fatal accidents: 2
Fatal accidents caused by drunken drivers: 0
Fatalities: 1
Persons involved in fatal accidents: 5
Pedestrians involved in fatal accidents: 0
Home Mortgage Disclosure Act Aggregated Statistics For Year 2009 (Based on 2 partial tracts)
A) FHA, FSA/RHS & VA Home Purchase Loans
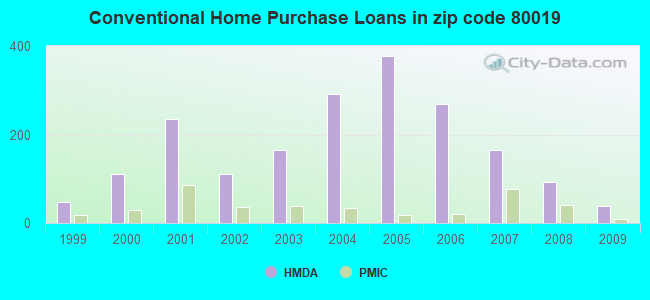
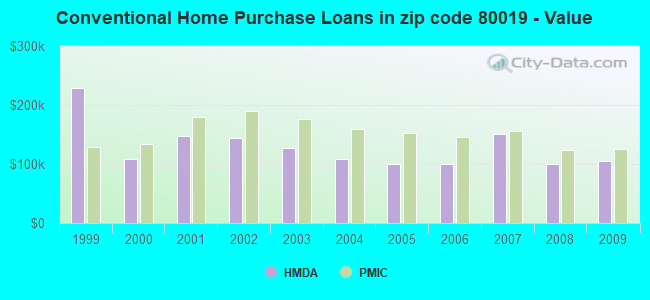
B) Conventional Home Purchase Loans
C) Refinancings
D) Home Improvement Loans
F) Non-occupant Loans on < 5 Family Dwellings (A B C & D)
Number
Average Value
Number
Average Value
Number
Average Value
Number
Average Value
Number
Average Value
LOANS ORIGINATED
130
$135,911
38
$105,710
146
$155,173
4
$92,162
19
$91,794
APPLICATIONS APPROVED, NOT ACCEPTED
5
$93,560
1
$129,660
10
$114,154
3
$11,440
1
$129,660
APPLICATIONS DENIED
18
$114,549
13
$155,184
56
$136,086
13
$25,619
10
$177,205
APPLICATIONS WITHDRAWN
10
$131,061
9
$78,391
38
$154,718
0
$0
4
$87,395
FILES CLOSED FOR INCOMPLETENESS
1
$181,780
3
$71,610
8
$124,419
0
$0
0
$0
Aggregated Statistics For Year 2008 (Based on 2 partial tracts)
A) FHA, FSA/RHS & VA Home Purchase Loans
B) Conventional Home Purchase Loans
C) Refinancings
D) Home Improvement Loans
F) Non-occupant Loans on < 5 Family Dwellings (A B C & D)
G) Loans On Manufactured Home Dwelling (A B C & D)
Number
Average Value
Number
Average Value
Number
Average Value
Number
Average Value
Number
Average Value
Number
Average Value
LOANS ORIGINATED
142
$134,998
93
$100,616
107
$146,734
8
$74,365
51
$84,497
1
$391,530
APPLICATIONS APPROVED, NOT ACCEPTED
3
$99,577
10
$137,290
22
$134,285
6
$23,942
4
$102,968
0
$0
APPLICATIONS DENIED
42
$137,078
50
$118,857
104
$157,763
22
$23,228
24
$87,077
0
$0
APPLICATIONS WITHDRAWN
10
$140,468
13
$97,394
34
$141,215
3
$25,423
17
$97,135
0
$0
FILES CLOSED FOR INCOMPLETENESS
3
$106,357
1
$124,580
9
$165,821
1
$177,970
1
$124,580
0
$0
Aggregated Statistics For Year 2007 (Based on 2 partial tracts)
A) FHA, FSA/RHS & VA Home Purchase Loans
B) Conventional Home Purchase Loans
C) Refinancings
D) Home Improvement Loans
F) Non-occupant Loans on < 5 Family Dwellings (A B C & D)
G) Loans On Manufactured Home Dwelling (A B C & D)
Number
Average Value
Number
Average Value
Number
Average Value
Number
Average Value
Number
Average Value
Number
Average Value
LOANS ORIGINATED
43
$161,265
165
$150,903
122
$126,818
14
$60,927
44
$111,057
0
$0
APPLICATIONS APPROVED, NOT ACCEPTED
1
$225,000
20
$158,582
42
$141,103
6
$87,713
5
$113,900
0
$0
APPLICATIONS DENIED
22
$169,416
50
$140,010
262
$150,516
19
$75,135
14
$121,944
1
$22,880
APPLICATIONS WITHDRAWN
6
$180,087
38
$138,026
86
$156,698
3
$145,340
10
$116,696
0
$0
FILES CLOSED FOR INCOMPLETENESS
0
$0
6
$216,740
19
$179,239
3
$25,847
1
$142,370
0
$0
Aggregated Statistics For Year 2006 (Based on 2 partial tracts)
A) FHA, FSA/RHS & VA Home Purchase Loans
B) Conventional Home Purchase Loans
C) Refinancings
D) Home Improvement Loans
F) Non-occupant Loans on < 5 Family Dwellings (A B C & D)
G) Loans On Manufactured Home Dwelling (A B C & D)
Number
Average Value
Number
Average Value
Number
Average Value
Number
Average Value
Number
Average Value
Number
Average Value
LOANS ORIGINATED
31
$163,616
268
$99,547
277
$116,262
22
$50,097
99
$90,037
0
$0
APPLICATIONS APPROVED, NOT ACCEPTED
5
$178,222
38
$117,151
97
$131,536
13
$23,664
9
$131,640
0
$0
APPLICATIONS DENIED
4
$132,840
125
$91,099
268
$141,549
38
$35,159
56
$80,653
1
$45,760
APPLICATIONS WITHDRAWN
5
$169,578
46
$113,220
150
$149,637
0
$0
15
$97,459
0
$0
FILES CLOSED FOR INCOMPLETENESS
1
$250,430
10
$133,222
42
$146,612
0
$0
0
$0
0
$0
Aggregated Statistics For Year 2005 (Based on 2 partial tracts)
A) FHA, FSA/RHS & VA Home Purchase Loans
B) Conventional Home Purchase Loans
C) Refinancings
D) Home Improvement Loans
E) Loans on Dwellings For 5+ Families
F) Non-occupant Loans on < 5 Family Dwellings (A B C & D)
G) Loans On Manufactured Home Dwelling (A B C & D)
Number
Average Value
Number
Average Value
Number
Average Value
Number
Average Value
Number
Average Value
Number
Average Value
Number
Average Value
LOANS ORIGINATED
61
$148,501
378
$100,294
350
$124,708
24
$43,698
0
$0
83
$104,300
1
$183,050
APPLICATIONS APPROVED, NOT ACCEPTED
1
$194,490
47
$106,105
88
$123,552
5
$24,152
0
$0
11
$98,345
0
$0
APPLICATIONS DENIED
6
$178,603
140
$100,506
283
$145,119
51
$55,385
0
$0
15
$99,916
0
$0
APPLICATIONS WITHDRAWN
9
$163,138
78
$109,812
238
$150,707
14
$61,835
1
$235,170
17
$103,416
0
$0
FILES CLOSED FOR INCOMPLETENESS
1
$245,340
13
$128,978
38
$152,109
4
$70,235
0
$0
3
$144,070
0
$0
Aggregated Statistics For Year 2004 (Based on 2 partial tracts)
A) FHA, FSA/RHS & VA Home Purchase Loans
B) Conventional Home Purchase Loans
C) Refinancings
D) Home Improvement Loans
F) Non-occupant Loans on < 5 Family Dwellings (A B C & D)
G) Loans On Manufactured Home Dwelling (A B C & D)
Number
Average Value
Number
Average Value
Number
Average Value
Number
Average Value
Number
Average Value
Number
Average Value
LOANS ORIGINATED
142
$157,092
292
$109,018
422
$142,374
25
$61,679
58
$120,874
4
$122,670
APPLICATIONS APPROVED, NOT ACCEPTED
6
$174,578
36
$111,265
130
$144,545
6
$16,737
19
$120,831
0
$0
APPLICATIONS DENIED
15
$182,459
67
$100,994
357
$154,047
29
$29,720
15
$132,883
0
$0
APPLICATIONS WITHDRAWN
14
$165,529
28
$108,006
188
$146,682
5
$141,866
9
$135,736
0
$0
FILES CLOSED FOR INCOMPLETENESS
0
$0
10
$94,577
44
$163,002
3
$72,460
0
$0
0
$0
Aggregated Statistics For Year 2003 (Based on 1 full and 2 partial tracts)
A) FHA, FSA/RHS & VA Home Purchase Loans
B) Conventional Home Purchase Loans
C) Refinancings
D) Home Improvement Loans
F) Non-occupant Loans on < 5 Family Dwellings (A B C & D)
Number
Average Value
Number
Average Value
Number
Average Value
Number
Average Value
Number
Average Value
LOANS ORIGINATED
175
$171,818
165
$126,457
721
$141,602
29
$26,914
48
$113,084
APPLICATIONS APPROVED, NOT ACCEPTED
6
$139,620
24
$117,162
116
$146,988
4
$11,440
10
$120,891
APPLICATIONS DENIED
22
$166,643
44
$128,131
273
$145,601
42
$21,096
9
$91,527
APPLICATIONS WITHDRAWN
18
$163,491
28
$146,778
215
$154,217
3
$26,270
8
$117,586
FILES CLOSED FOR INCOMPLETENESS
0
$0
5
$165,510
34
$160,545
1
$44,490
0
$0
Aggregated Statistics For Year 2002 (Based on 1 full and 2 partial tracts)
A) FHA, FSA/RHS & VA Home Purchase Loans
B) Conventional Home Purchase Loans
C) Refinancings
D) Home Improvement Loans
E) Loans on Dwellings For 5+ Families
F) Non-occupant Loans on < 5 Family Dwellings (A B C & D)
Number
Average Value
Number
Average Value
Number
Average Value
Number
Average Value
Number
Average Value
Number
Average Value
LOANS ORIGINATED
156
$180,940
111
$144,756
557
$139,053
34
$22,881
1
$183,050
32
$123,664
APPLICATIONS APPROVED, NOT ACCEPTED
3
$144,917
19
$135,483
94
$136,275
11
$19,068
0
$0
1
$170,340
APPLICATIONS DENIED
10
$188,773
44
$117,702
191
$122,401
24
$14,195
0
$0
3
$105,933
APPLICATIONS WITHDRAWN
10
$186,358
17
$166,004
135
$143,627
5
$55,170
0
$0
5
$158,392
FILES CLOSED FOR INCOMPLETENESS
4
$171,295
3
$131,357
64
$147,658
1
$33,050
0
$0
3
$95,340
Aggregated Statistics For Year 2001 (Based on 1 full and 2 partial tracts)
A) FHA, FSA/RHS & VA Home Purchase Loans
B) Conventional Home Purchase Loans
C) Refinancings
D) Home Improvement Loans
F) Non-occupant Loans on < 5 Family Dwellings (A B C & D)
Number
Average Value
Number
Average Value
Number
Average Value
Number
Average Value
Number
Average Value
LOANS ORIGINATED
235
$174,893
234
$147,327
483
$126,888
52
$24,911
35
$120,403
APPLICATIONS APPROVED, NOT ACCEPTED
8
$158,582
9
$125,708
70
$118,040
10
$25,043
3
$72,883
APPLICATIONS DENIED
9
$159,241
32
$107,178
234
$118,988
41
$21,610
4
$128,710
APPLICATIONS WITHDRAWN
5
$168,306
27
$133,994
139
$119,164
11
$39,292
5
$46,018
FILES CLOSED FOR INCOMPLETENESS
3
$138,560
4
$138,878
17
$120,016
1
$31,780
1
$167,800
Aggregated Statistics For Year 2000 (Based on 1 full and 2 partial tracts)
A) FHA, FSA/RHS & VA Home Purchase Loans
B) Conventional Home Purchase Loans
C) Refinancings
D) Home Improvement Loans
E) Loans on Dwellings For 5+ Families
F) Non-occupant Loans on < 5 Family Dwellings (A B C & D)
Number
Average Value
Number
Average Value
Number
Average Value
Number
Average Value
Number
Average Value
Number
Average Value
LOANS ORIGINATED
136
$140,729
111
$108,063
167
$85,033
53
$25,112
1
$166,530
10
$127,120
APPLICATIONS APPROVED, NOT ACCEPTED
4
$111,230
25
$78,764
43
$92,561
19
$15,455
0
$0
4
$94,070
APPLICATIONS DENIED
3
$125,427
42
$93,191
128
$91,586
38
$17,730
0
$0
4
$99,472
APPLICATIONS WITHDRAWN
8
$117,269
22
$102,332
67
$82,628
10
$47,289
0
$0
4
$108,688
FILES CLOSED FOR INCOMPLETENESS
3
$111,867
1
$169,070
19
$108,186
1
$30,510
0
$0
0
$0
Aggregated Statistics For Year 1999 (Based on 1 full and 1 partial tracts)
A) FHA, FSA/RHS & VA Home Purchase Loans
B) Conventional Home Purchase Loans
C) Refinancings
D) Home Improvement Loans
E) Loans on Dwellings For 5+ Families
F) Non-occupant Loans on < 5 Family Dwellings (A B C & D)
Detailed PMIC statistics for the following Tracts:0083.53
2003 - 2018 National Fire Incident Reporting System (NFIRS) incidents
Based on the data from the years 2003 - 2018 the average number of fires per year is 8. The highest number of reported fires - 21 took place in 2016, and the least - 1 in 2004. The data has a growing trend.
When looking into fire subcategories, the most reports belonged to: Outside Fires (59.8%), and Structure Fires (19.7%).
Fire incident types reported to NFIRS in Zip Code 80019


 Nearest zip codes: 80249, 80011, 80018, 80137, 80017, 80022.


 Based on the data from the years 2003 - 2018 the average number of fires per year is 8. The highest number of reported fires - 21 took place in 2016, and the least - 1 in 2004. The data has a growing trend.
 When looking into fire subcategories, the most reports belonged to: Outside Fires (59.8%), and Structure Fires (19.7%).